
The Daily Shot: 13-Apr-23
• The United States
• Canada
• The United Kingdom
• Asia – Pacific
• China
• Emerging Markets
• Cryptocurrency
• Commodities
• Energy
• Equities
• Credit
• Global Developments
• Food for Thought
The United States
1. Inflation cooled more than expected in March.
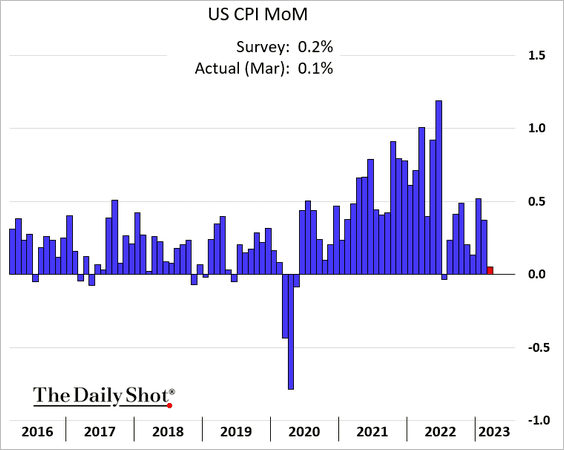
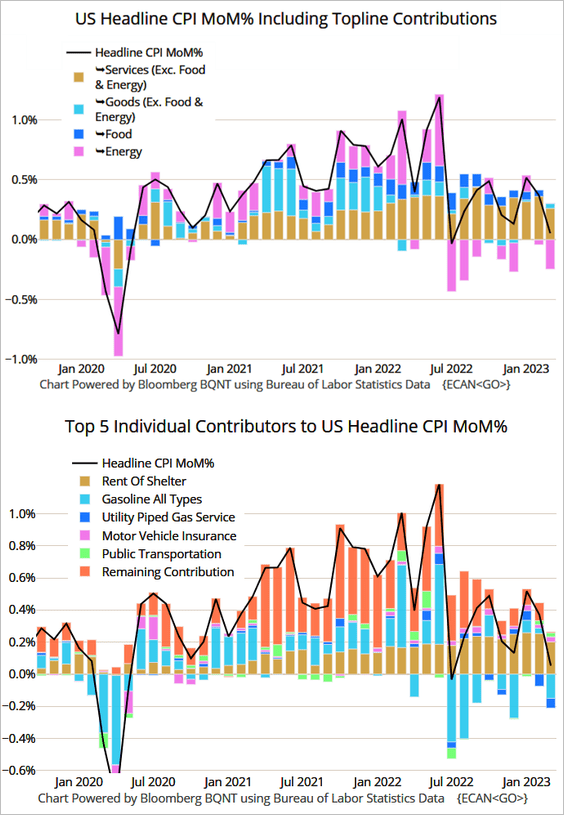
• Here are the contributions.
 Source: @TheTerminal, Bloomberg Finance L.P.
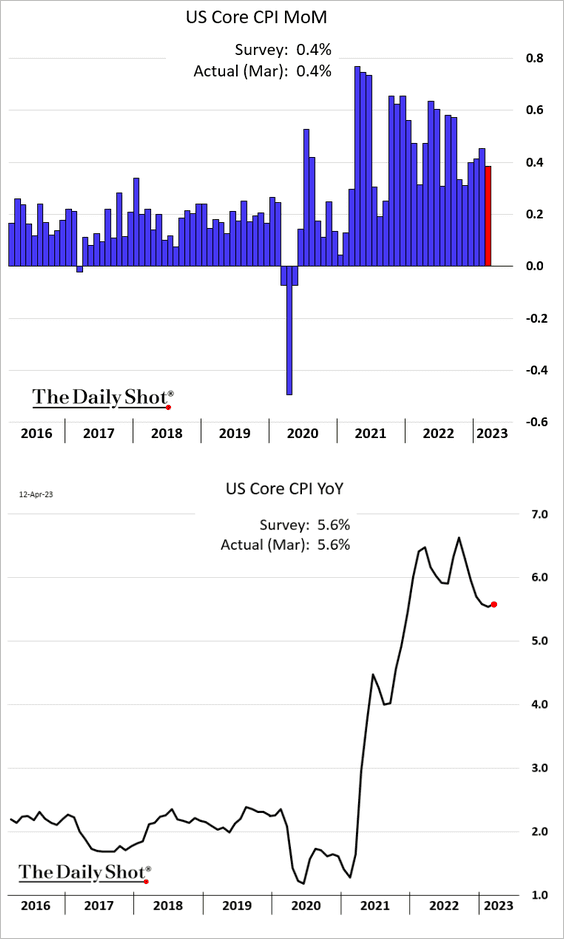
The core CPI was in line with forecasts, edging higher on a year-over-year basis (2nd panel).
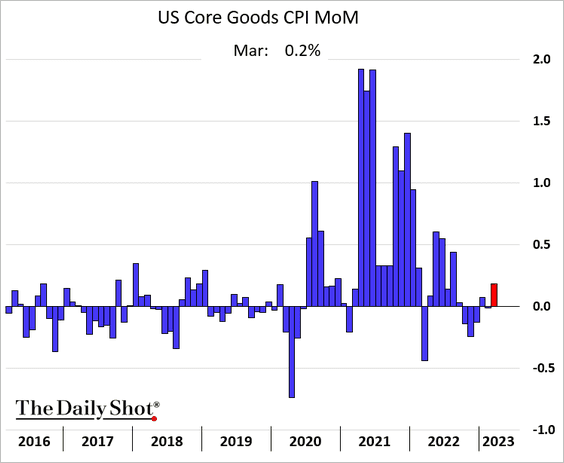
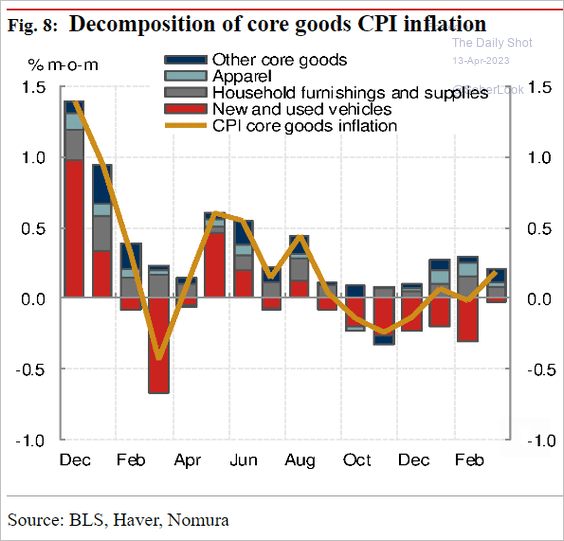
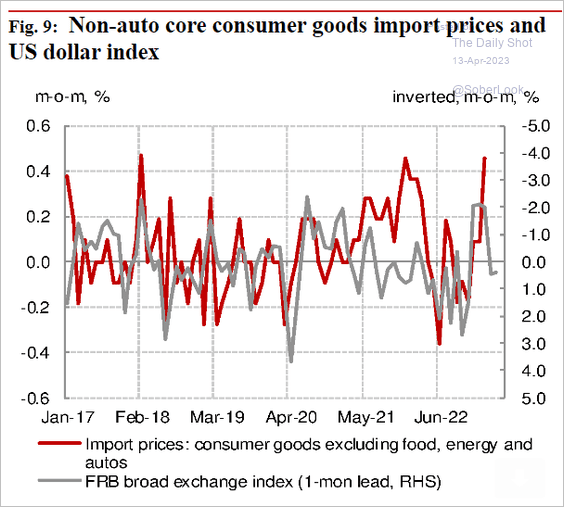
• The core goods CPI increased by most in months, …
 Source: Nomura Securities
… which was partially driven by higher import prices.
 Source: Nomura Securities
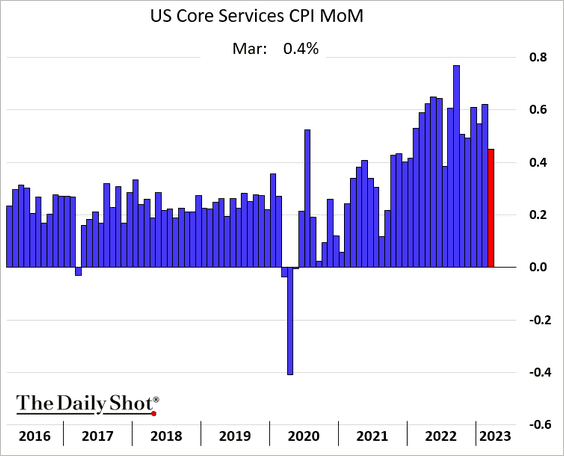
• Core services inflation slowed, but it remains elevated.
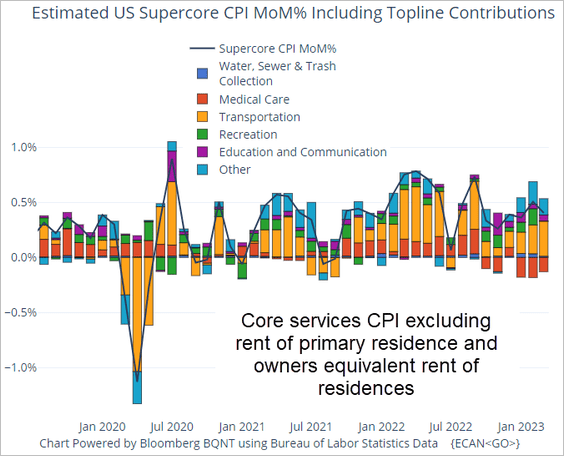
• Here is the “supercore” CPI, which is monitored closely by the FOMC.
 Source: @TheTerminal, Bloomberg Finance L.P.
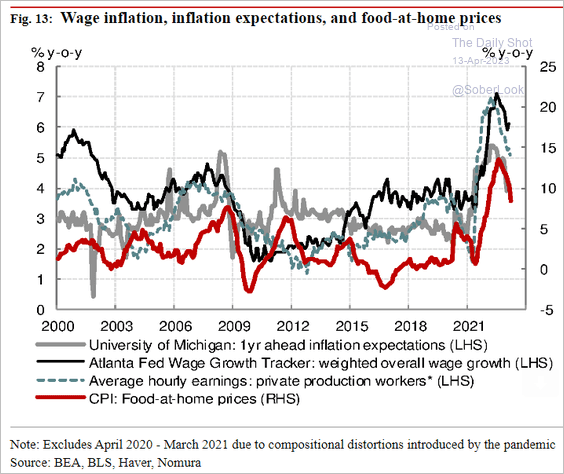
• Next, let’s take a look at some key components of inflation.
– Grocery costs declined in March for the first time since 2020 (2nd panel).
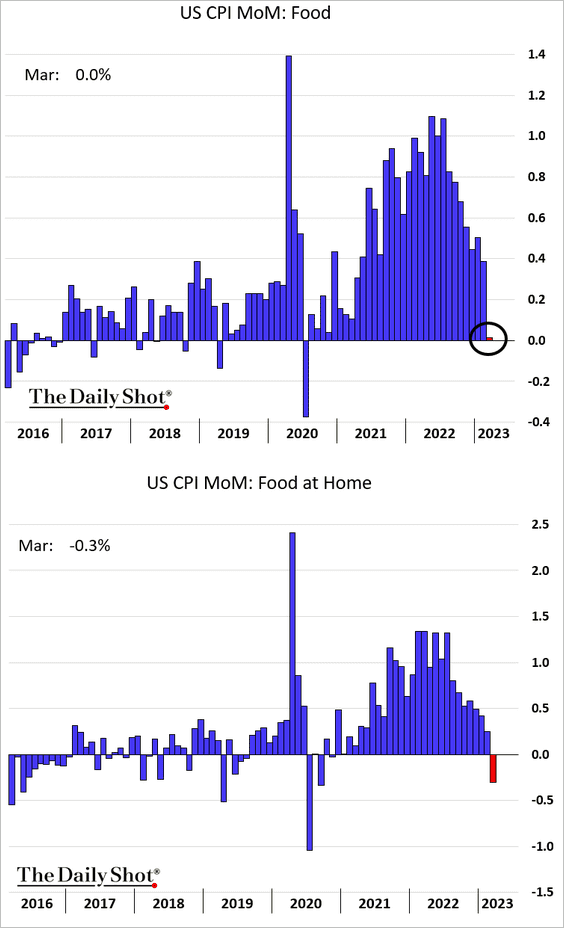
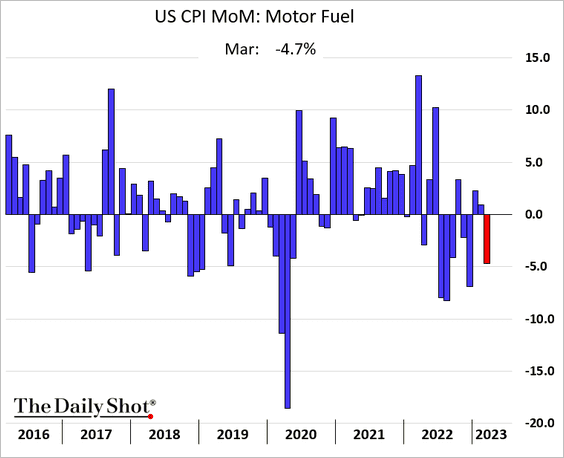
Combined with softer gasoline prices, …
… lower food CPI should ease inflation expectations and potentially slow wage gains.
 Source: Nomura Securities
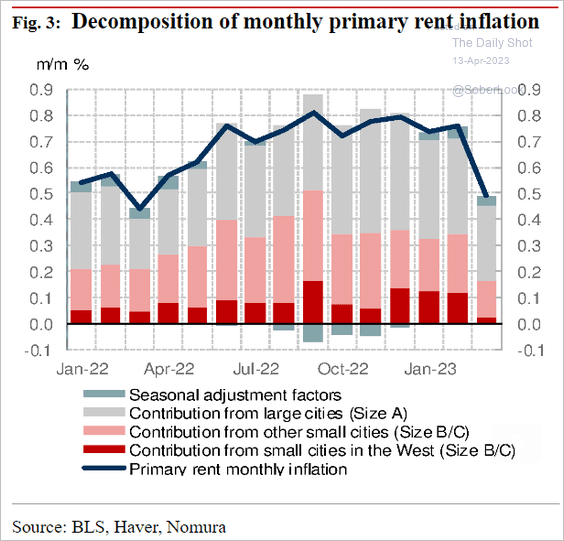
– While still elevated, housing inflation slowed sharply.
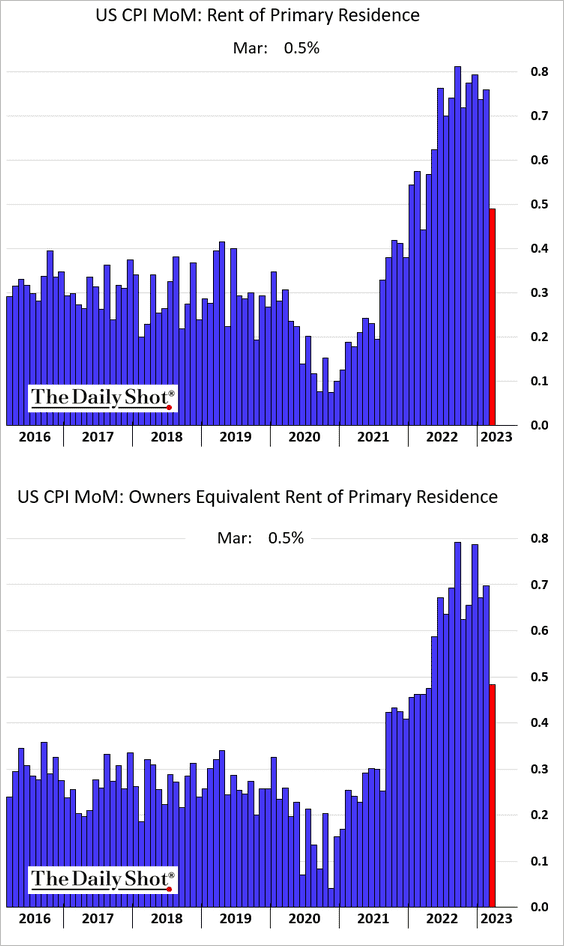
Here is the decomposition of rent inflation from Nomura.
 Source: Nomura Securities
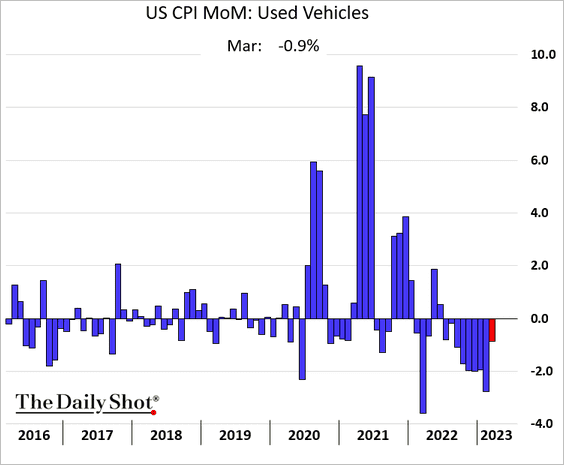
– Used vehicle prices unexpectedly declined, diverging from the Manheim wholesale index.
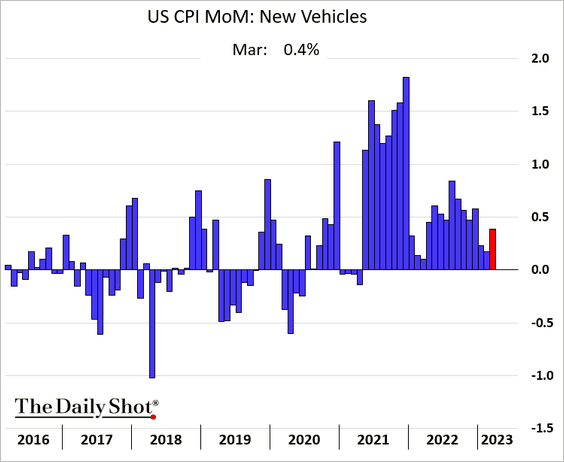
– But new car prices increased again.
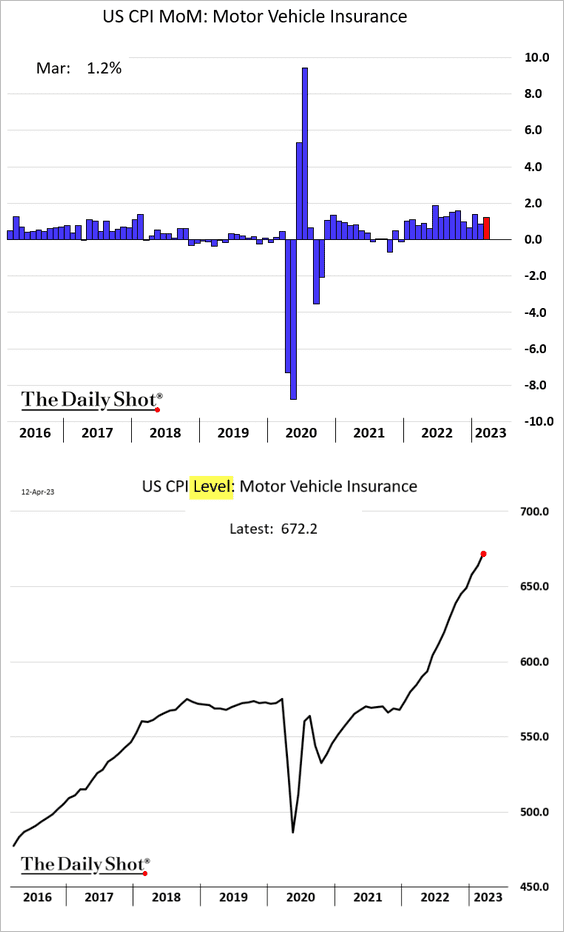
Below are some additional CPI trends.
– Car insurance:
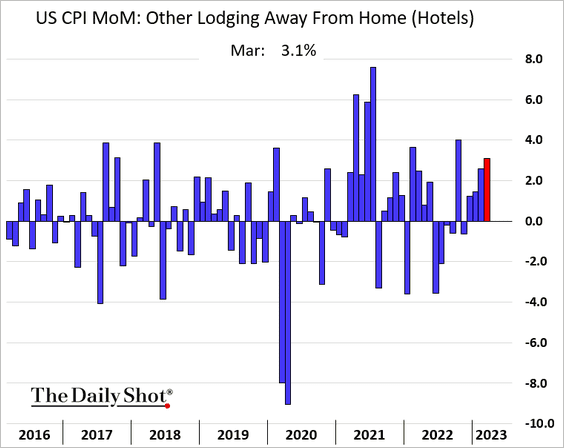
– Hotels:
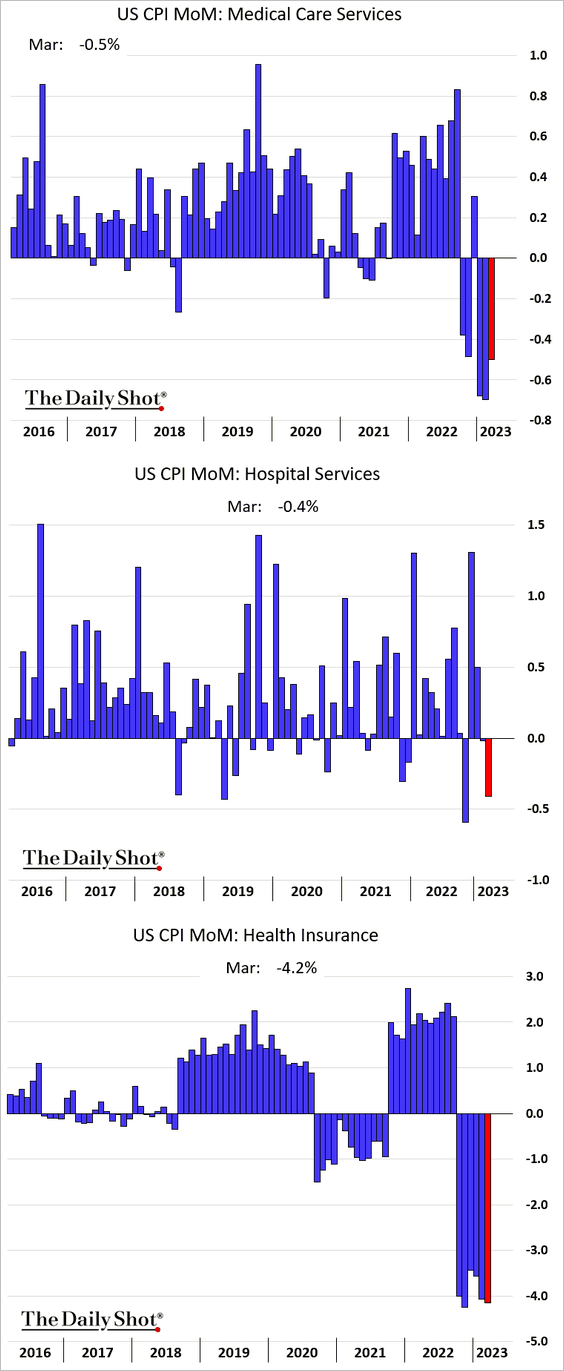
– Medical care services:
——————–
2. The FOMC minutes suggest that without the banking turmoil, the FOMC would have raised rates by 50 bps. But concerns about financial sector stress and tighter credit conditions caused the Fed to downgrade its forecasts for economic activity.
Staff Economic Outlook:
For some time, the forecast for the U.S. economy prepared by the staff had featured subdued real GDP growth for this year and some softening in the labor market. Given their assessment of the potential economic effects of the recent banking-sector developments, the staff’s projection at the time of the March meeting included a mild recession starting later this year, with a recovery over the subsequent two years. Real GDP growth in 2024 was projected to remain below the staff’s estimate of potential output growth, and then GDP growth in 2025 was expected to be above that of potential. Resource utilization in both product and labor markets was forecast to be much less tight than in the January projection. The level of real output was projected to move below the staff’s estimate of potential output in early 2024, more than a year sooner than in the previous projection. Likewise, the unemployment rate was projected to rise above the staff’s estimate of its natural rate early next year.
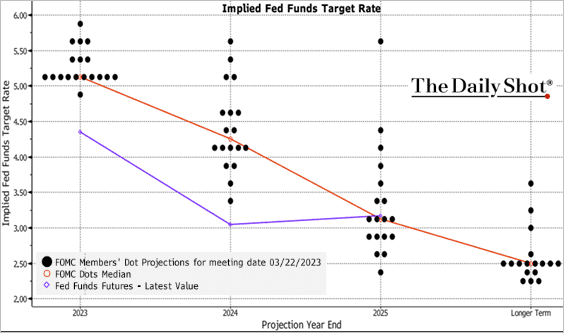
• The market remains well below the last dot plot for the end of 2023 and 2024.
 Source: @TheTerminal, Bloomberg Finance L.P.
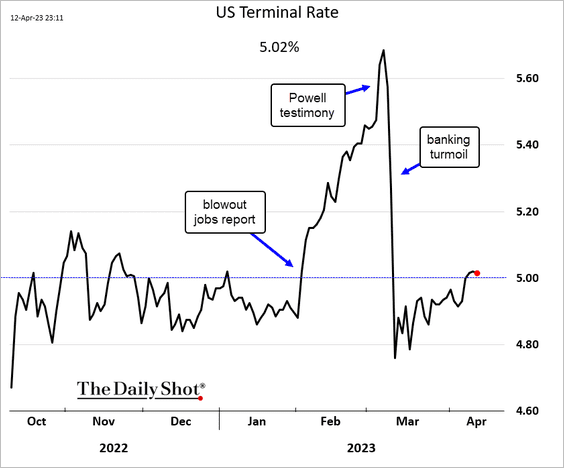
• The terminal rate is back above 5%, with a May rate hike in play.
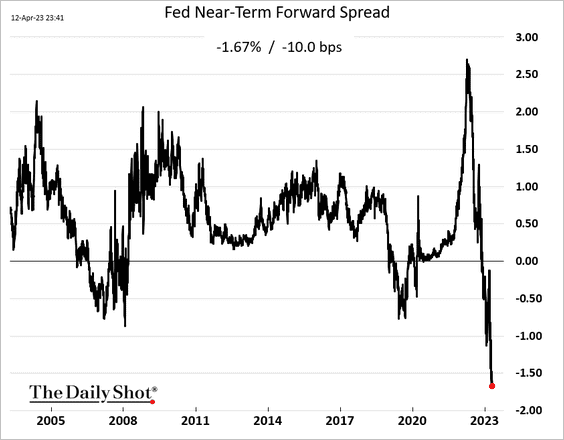
• The near-term forward spread continues to hit extreme inversion levels.
——————–
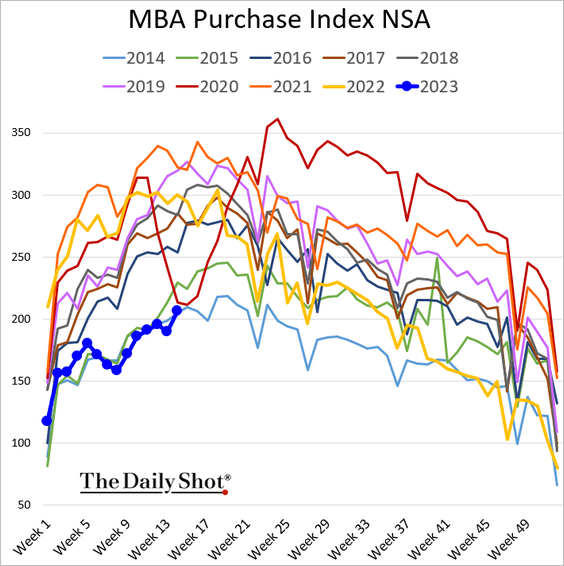
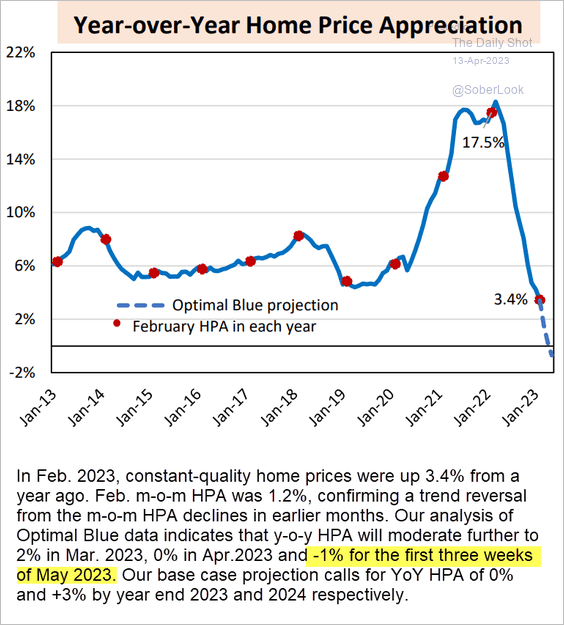
3. Mortgage applications climbed just above the 2014 levels last week.
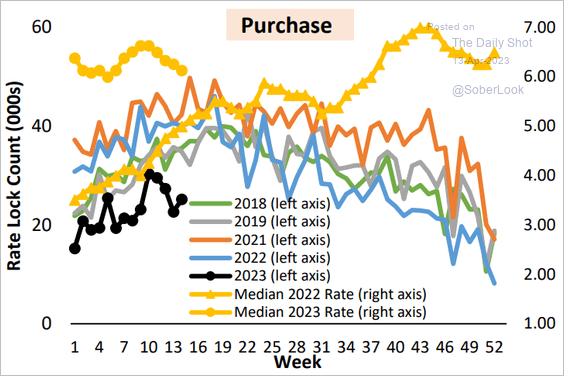
Here is the rate lock count.
 Source: AEI Housing Center
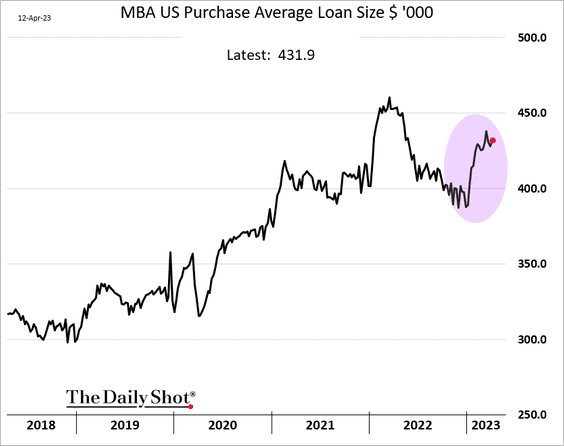
• The average loan size has been rising.
• Optimal Blue’s projection for home prices (via the AEI Housing Center) shows a year-over-year decline in May, with prices finishing flat on a year-over-year basis for 2023. The forecast calls for a 3% price appreciation next year.
 Source: AEI Housing Center
——————–
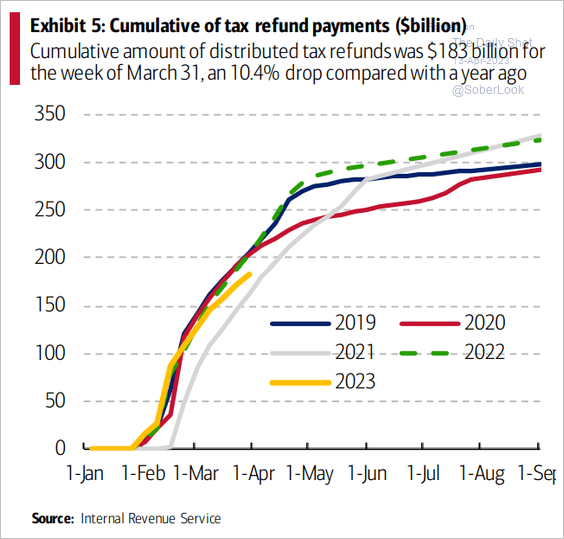
4. Tax refunds continue to run below the levels we saw in recent years.
 Source: BofA Global Research
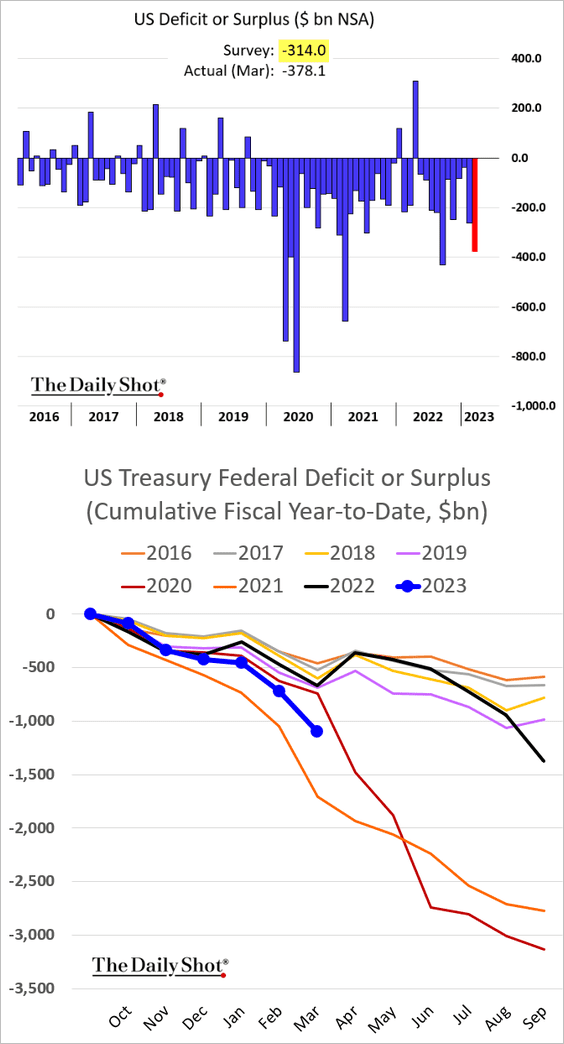
5. The federal budget deficit was wider than expected in March.
Back to Index
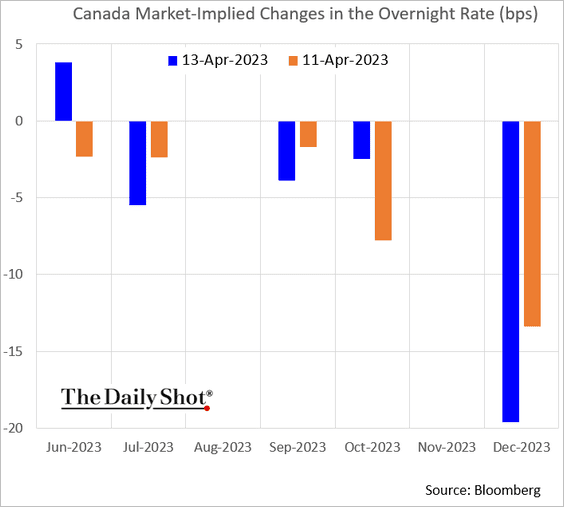
Canada
The BoC left rates unchanged but pushed back on market expectations for rate cuts.
 Source: The Globe and Mail Read full article
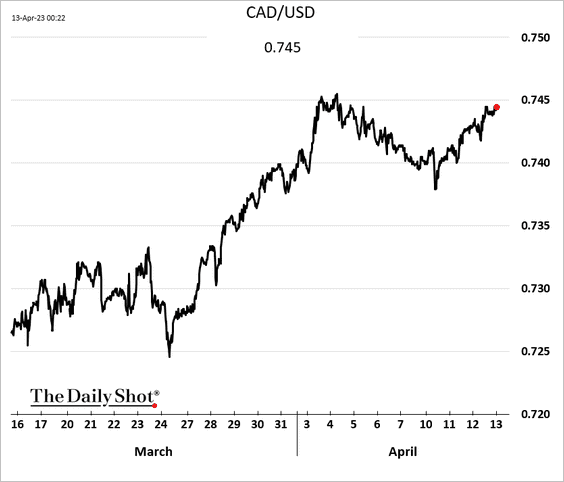
• The loonie has been rising vs. USD.
• The market is now pricing in a small probability of a rate hike in June.
——————–
The United Kingdom
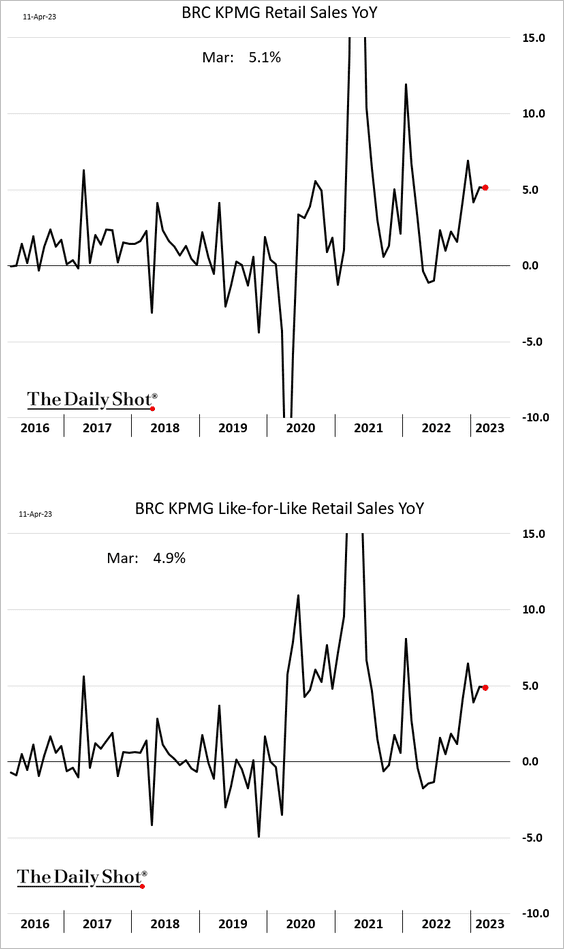
1. Retail sales were robust in March, up about 5% on a year-over-year basis.
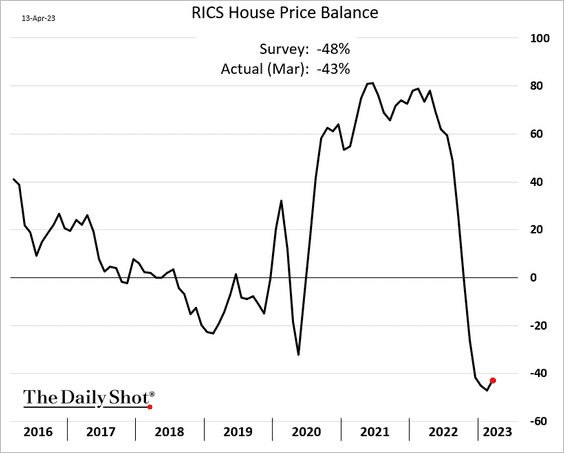
2. The RICS housing market index appears to have bottomed.
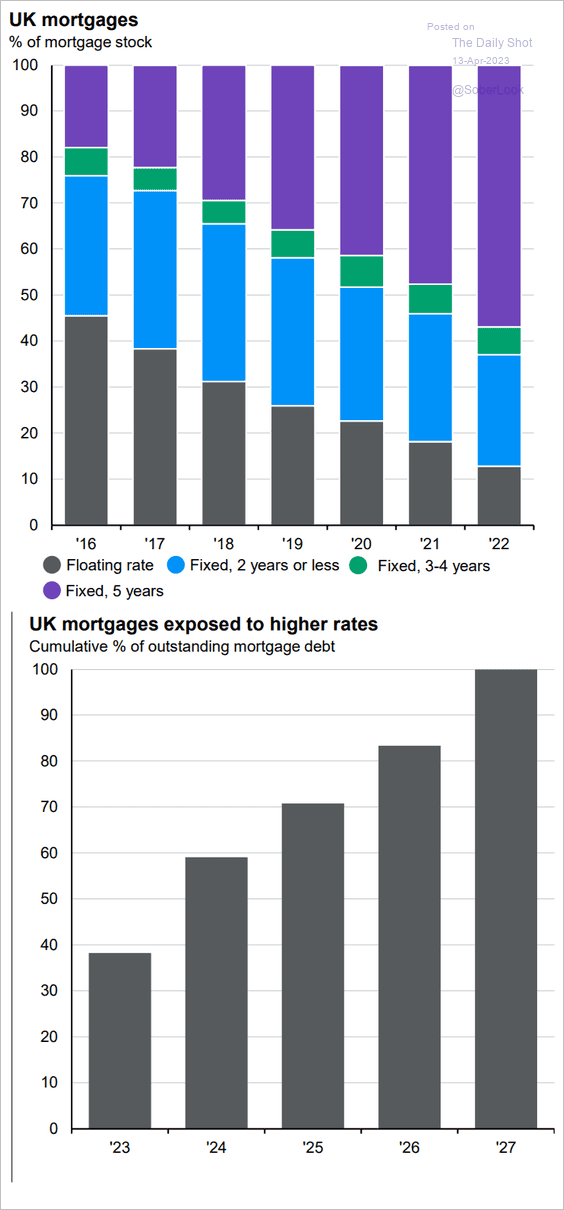
3. Next, we have some data on UK mortgages and sensitivity to higher rates.
 Source: J.P. Morgan Asset Management
4. Rising corporate insolvencies typically coincide with higher unemployment.
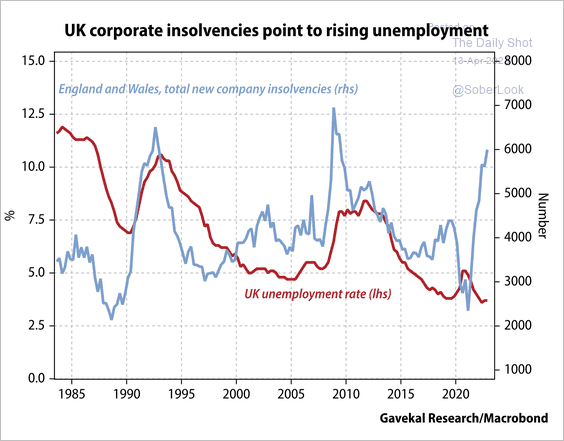 Source: Gavekal Research
Back to Index
Asia – Pacific
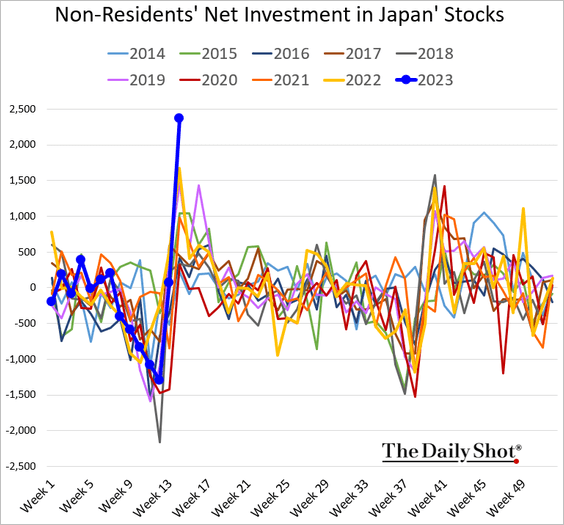
1. Foreigners jumped into Japanese equities in recent days.
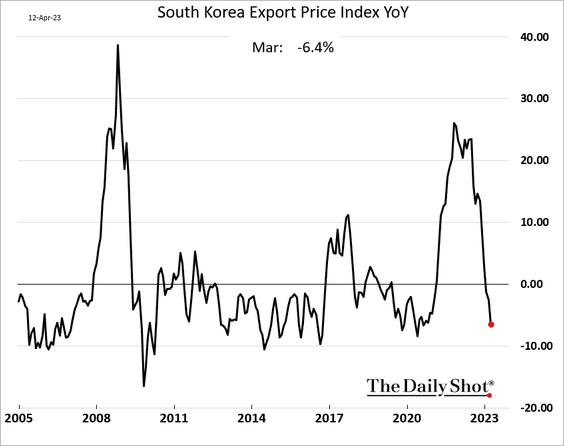
2. South Korea’s export prices continue to fall.
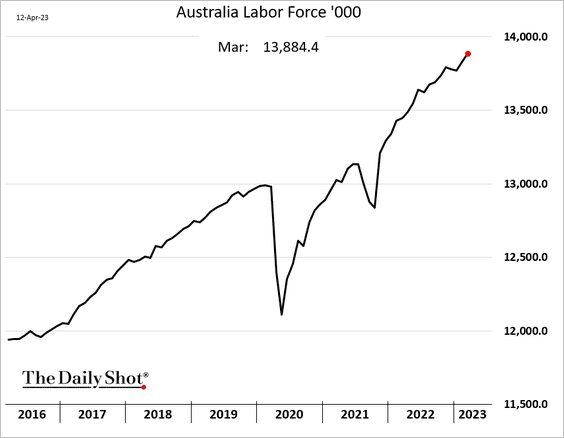
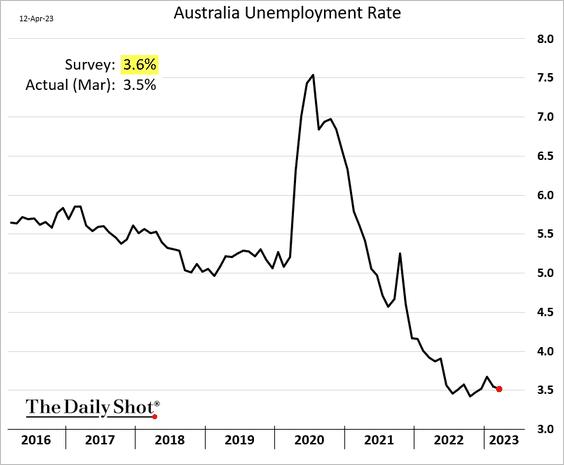
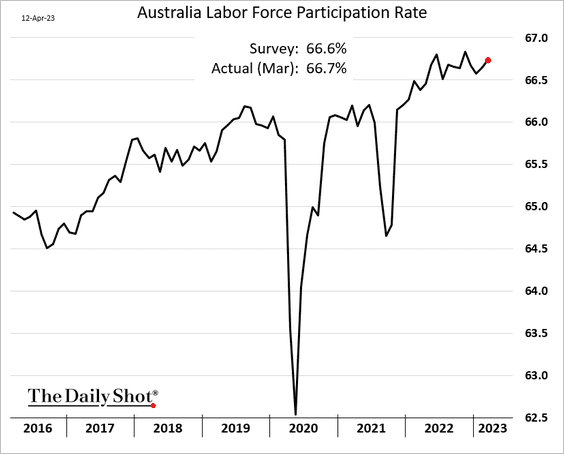
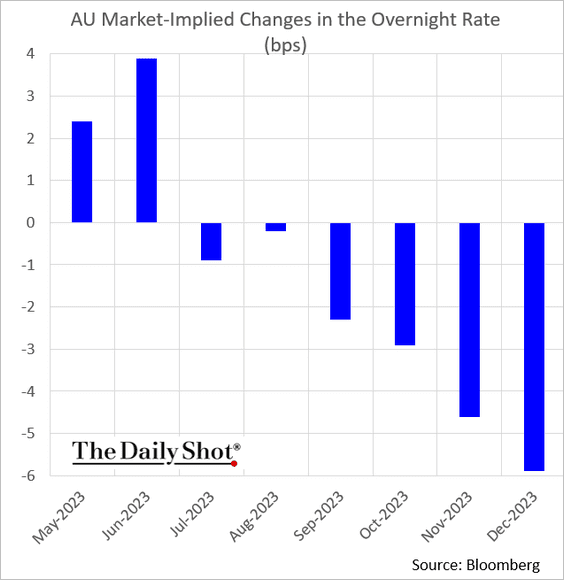
3. Next, we have some updates on Australia.
• The employment report topped expectations again.
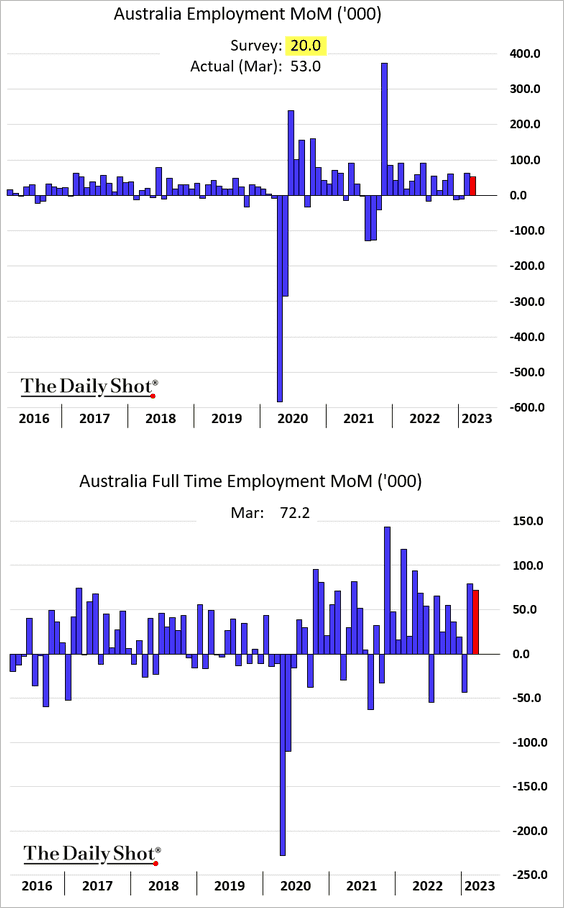
– The labor force growth has been remarkable.
– The unemployment rate is back at 3.5%.
– Labor force participation increased.
• Bond yields jumped, …
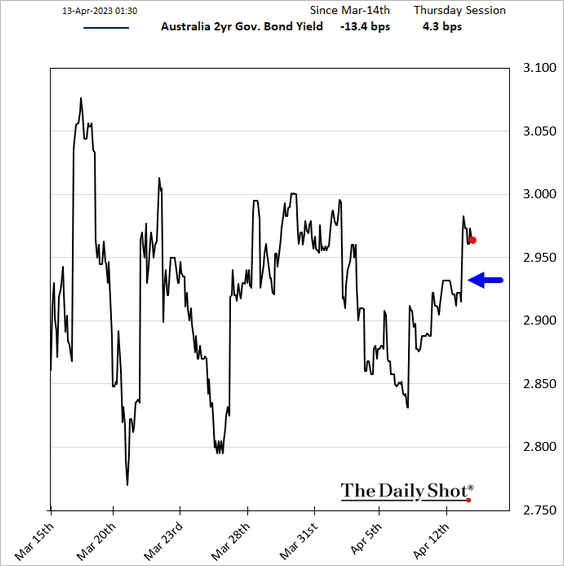
… with the market pricing in the possibility of another rate hike.
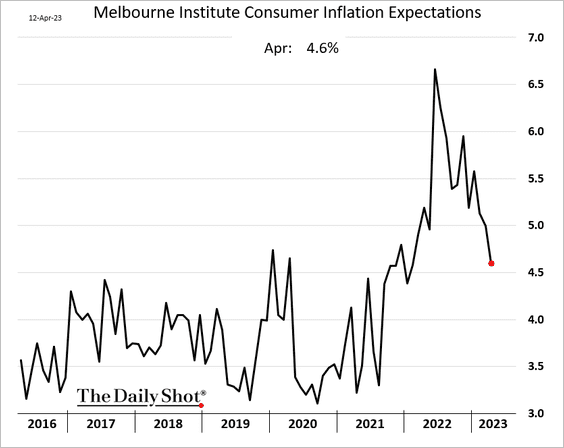
• Inflation expectations continue to ease.
Back to Index
China
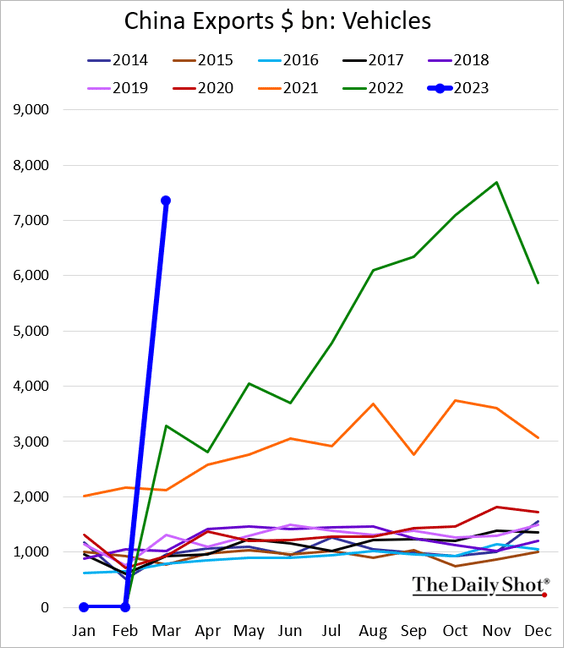
1. Exports exceeded expectations, …
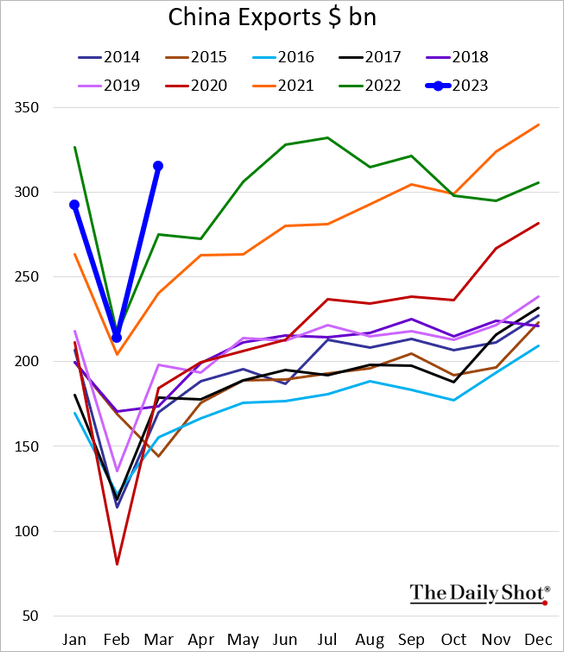
… boosted by EV sales.
 Source: Reuters Read full article
• The trade surplus hit a record high for March (more the twice the forecast).
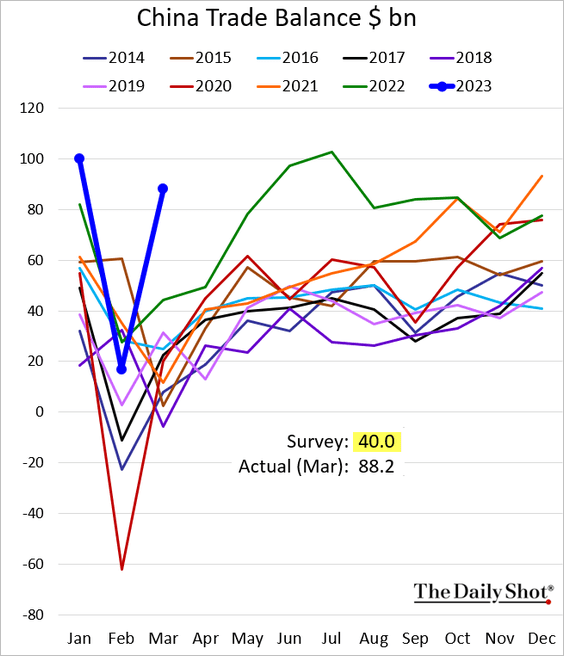
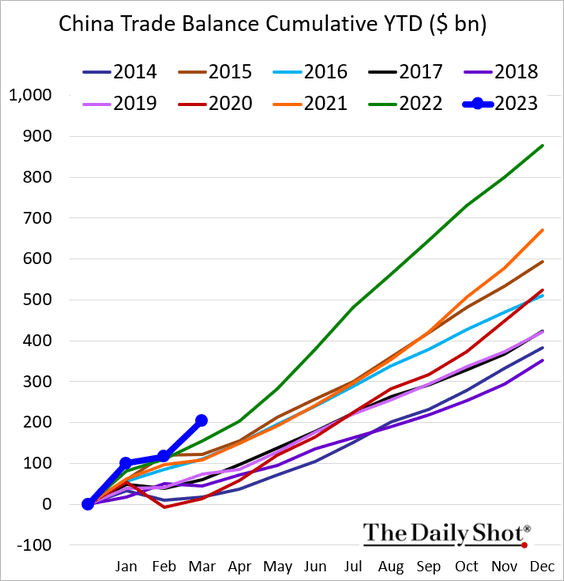
Here is the cumulative trade balance.
——————–
2. Fixed investment in manufacturing and infrastructure has been strong, while real estate investment failed to maintain its post-pandemic uplift.
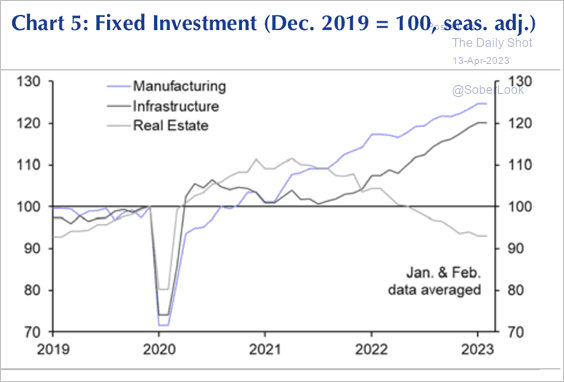 Source: Capital Economics
Back to Index
Emerging Markets
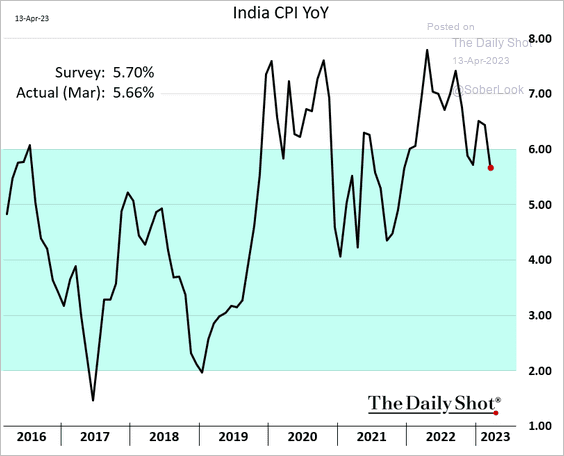
1. India’s inflation dipped back inside the RBI’s target range.
 Source: Reuters Read full article
 Source: Reuters Read full article
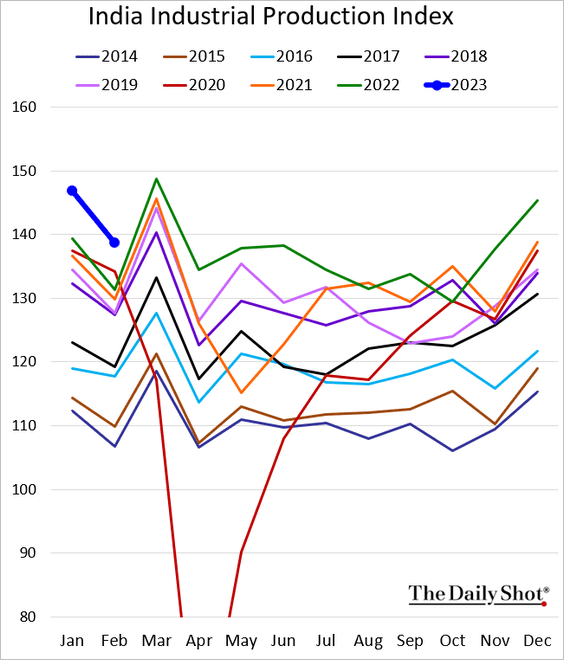
India’s industrial production remains well above last year’s levels.
——————–
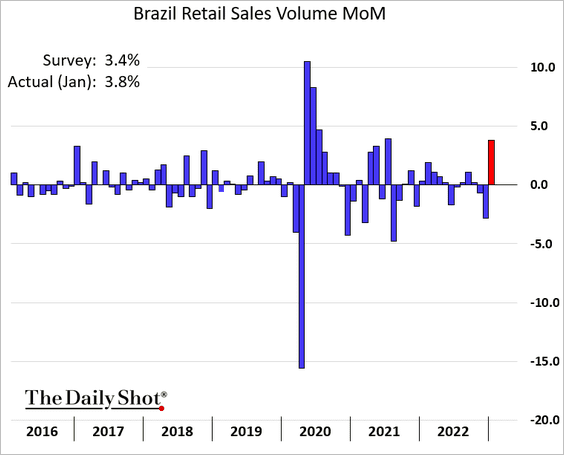
2. Brazil’s retail sales jumped in January.
 Source: Reuters Read full article
——————–
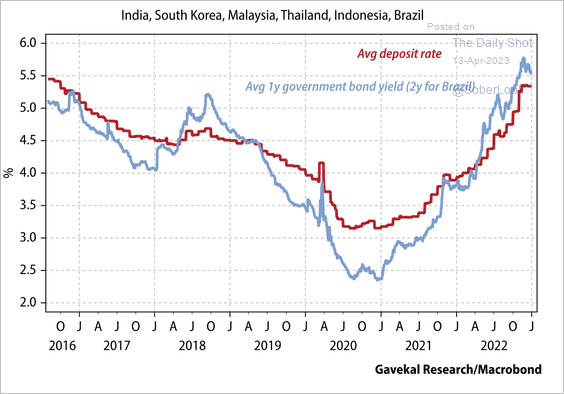
3. EM bank deposit rates have adjusted quickly to rising bond yields.
 Source: Gavekal Research
Back to Index
Cryptocurrency
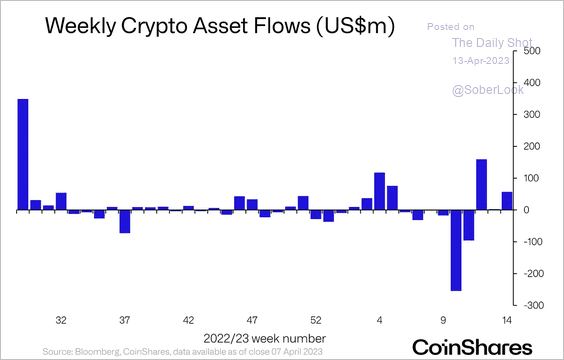
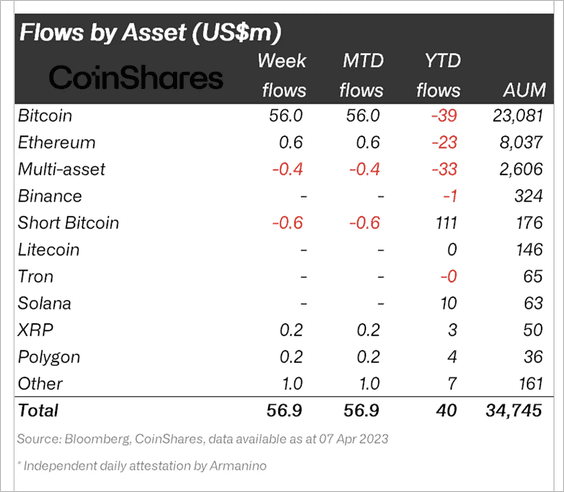
1. Crypto inflows turned net positive for the year, although volumes are still low.
 Source: CoinShares Read full article
Bitcoin funds continued to lead inflows last week, although short-bitcoin funds are still net positive for the year.
 Source: CoinShares Read full article
——————–
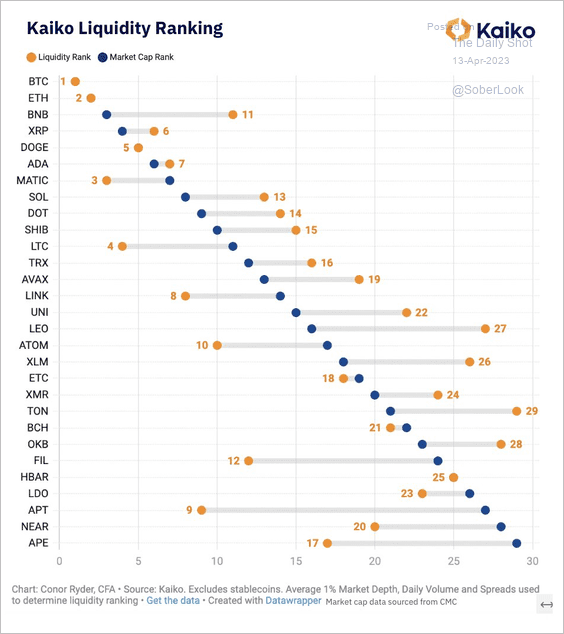
2. This chart compares liquidity and market cap across select crypto tokens.
 Source: @KaikoData
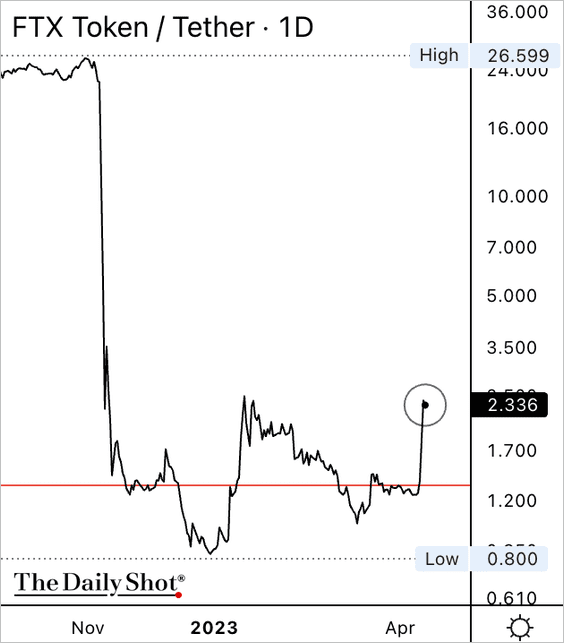
3. News of a possible FTX reopening sparked a rally in the exchange’s FTT token.
 Source: CoinDesk Read full article
FTT suddenly doubled in price but remains well below post-crisis highs.
——————–
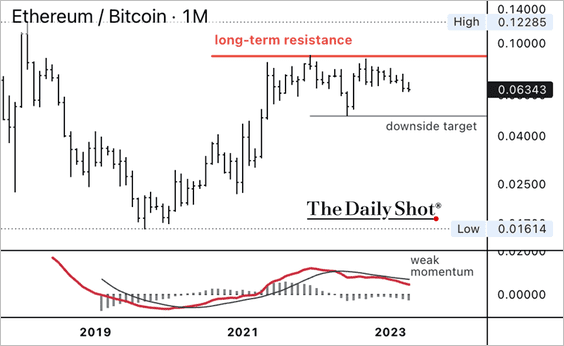
4. The Ethereum blockchain completed a major upgrade. Roughly 1.1 million accrued ETH from rewards is now eligible to be immediately withdrawn. Will this unleash selling pressure?
 Source: CoinDesk Read full article
The ETH/BTC price ratio continues to fade from long-term resistance. Traders have flocked to BTC during the crypto rally.
——————–
5. VC deal activity in crypto has been shrinking.
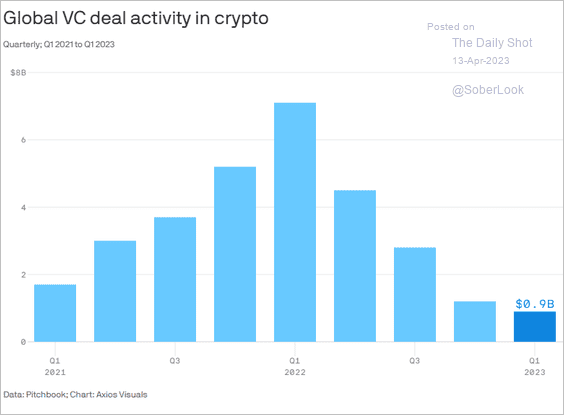 Source: @axios Read full article
Back to Index
Commodities
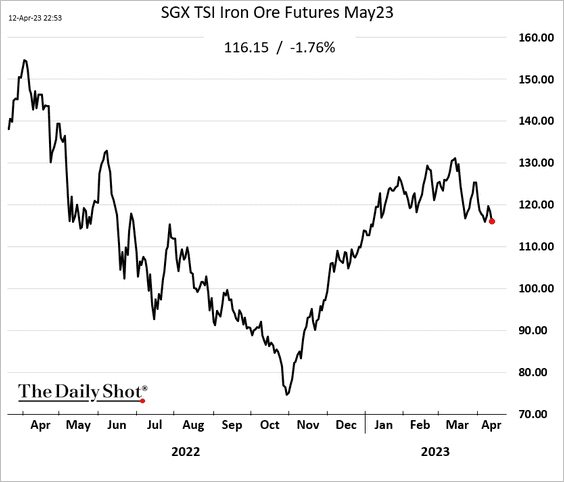
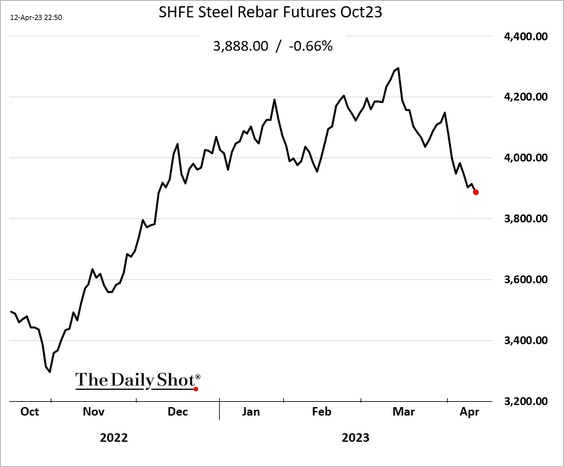
1. Iron ore and steel futures continue to roll over, as mills in China lowered export prices amid worries about future demand.
——————–
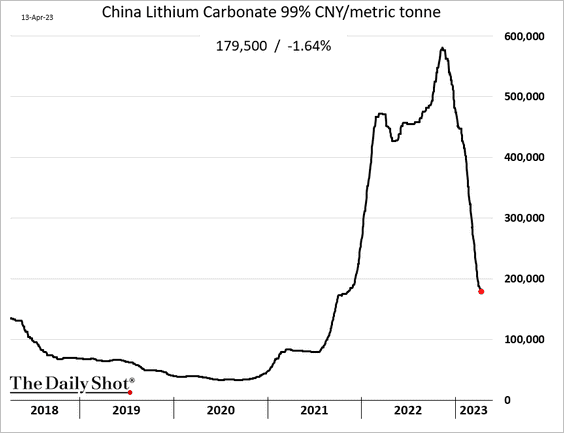
2. Lithium prices continue to sink.
Back to Index
Energy
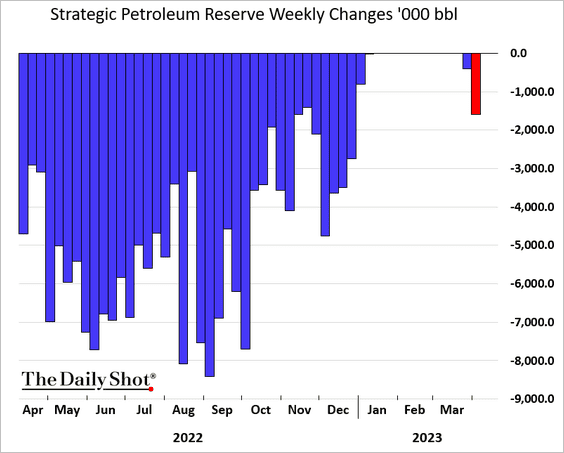
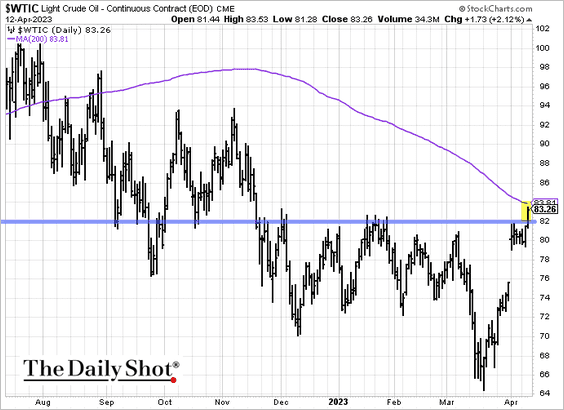
1. US oil inventories unexpectedly increased last week, …
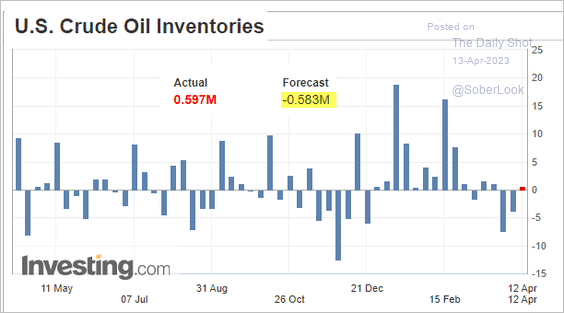
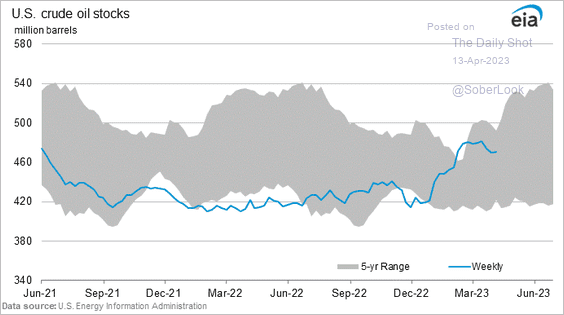
… driven in part by more SPR releases.
 Source: Reuters Read full article
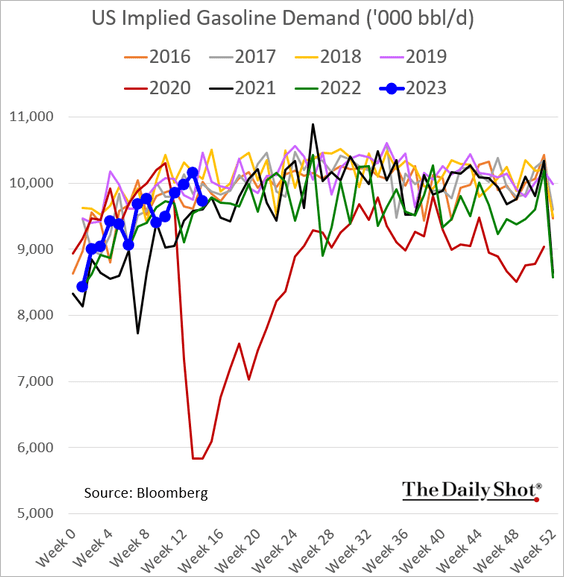
• The weekly gasoline inventory decline was smaller than expected, …
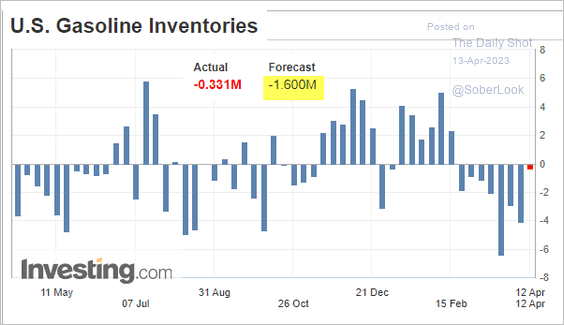
… as demand softened.
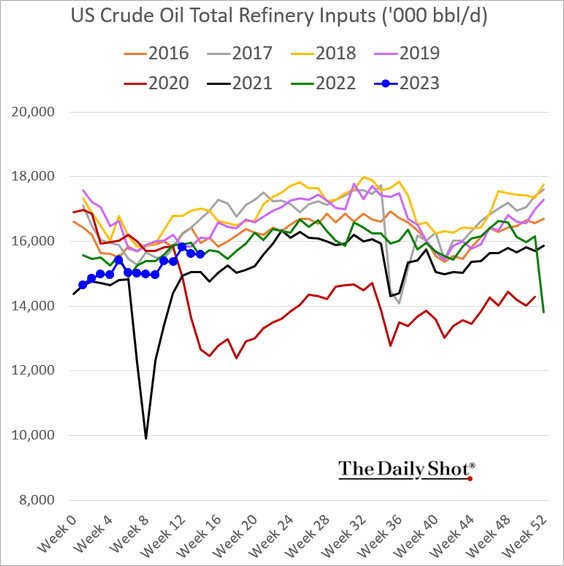
• Refinery runs are holding near last year’s levels.
——————–
2. Despite the inventory increase, US crude oil jumped above $82/bbl and is nearing the 200-day moving average.
Back to Index
Equities
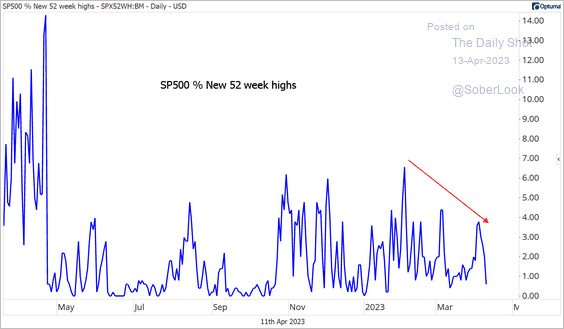
1. S&P 500 breadth and momentum indicators have improved over the past month.
 Source: Aazan Habib, Paradigm Capital
However, the number of stocks that set new highs has declined on each successive rally this year.
 Source: @meanstoatrend
——————–
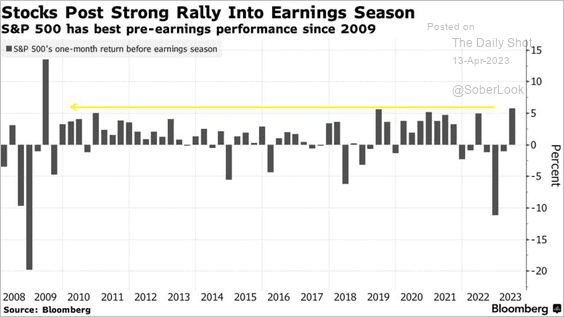
2. Retrurns have been strong coming into this earnings season.
 Source: @luwangnyc, @isabelletanlee, @markets Read full article
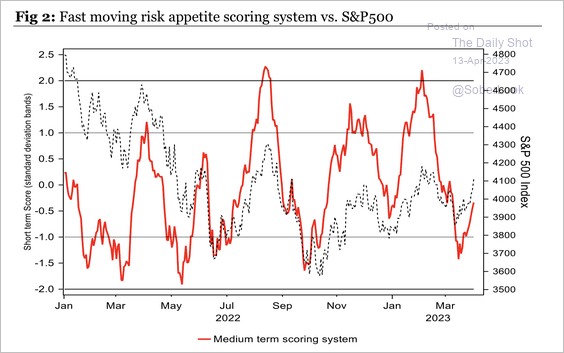
3. Risk appetite is improving from low levels in March.
 Source: Longview Economics
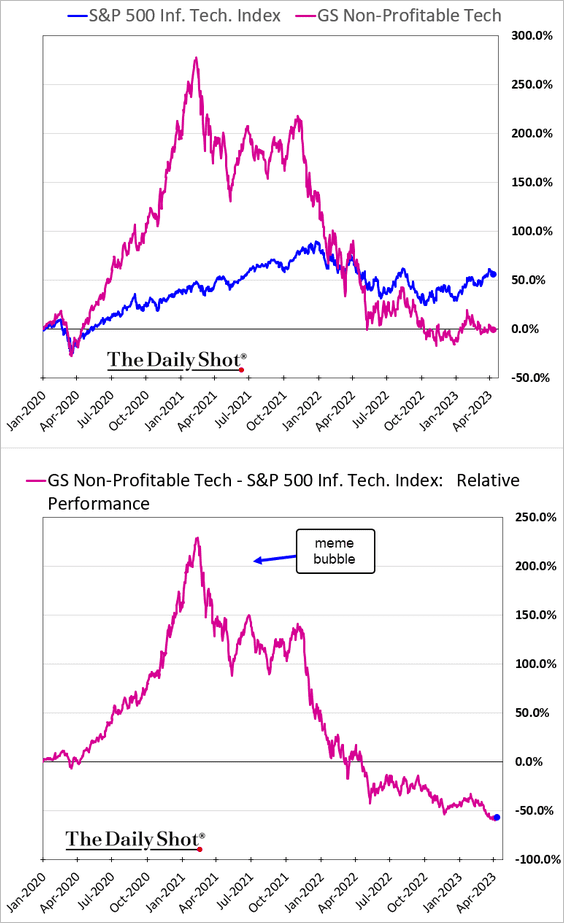
4. Non-profitable tech stocks are down some 280% on a relative basis from the 2021 peak, as the meme bubble deflates.
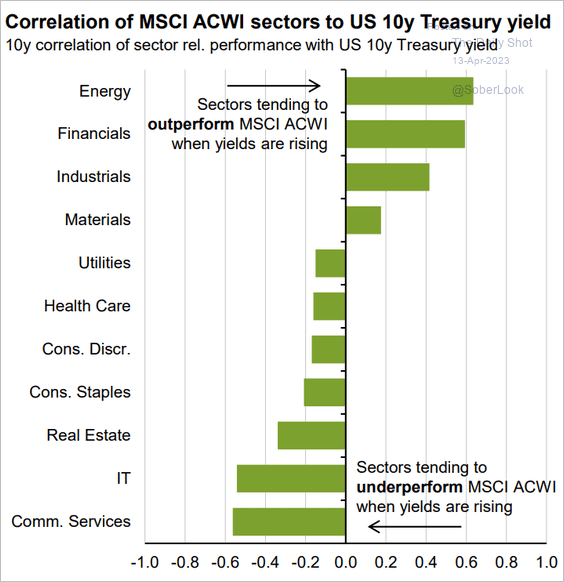
5. How are global equity sectors correlated to the 10-year Treasury yield?
 Source: J.P. Morgan Asset Management
Back to Index
Credit
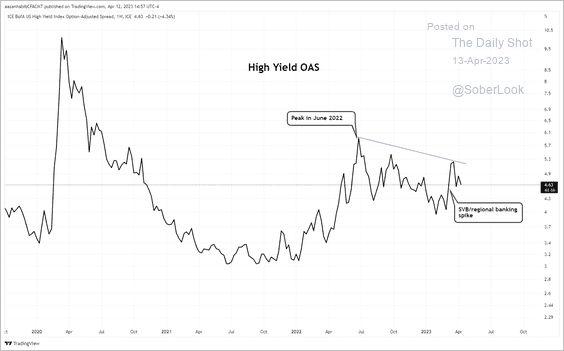
US high-yield spreads have tightened, but remain below the June 2022 peak, which was when several risk appetite indicators bottomed out, according to Paradigm Capital.
 Source: Aazan Habib, Paradigm Capital
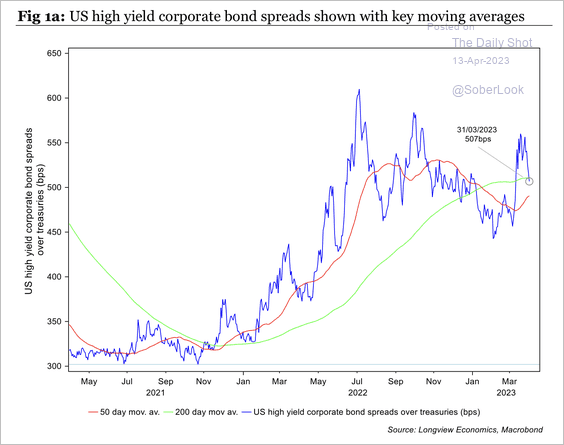
High-yield spreads are testing their 200-day moving average.
 Source: Longview Economics
Back to Index
Global Developments
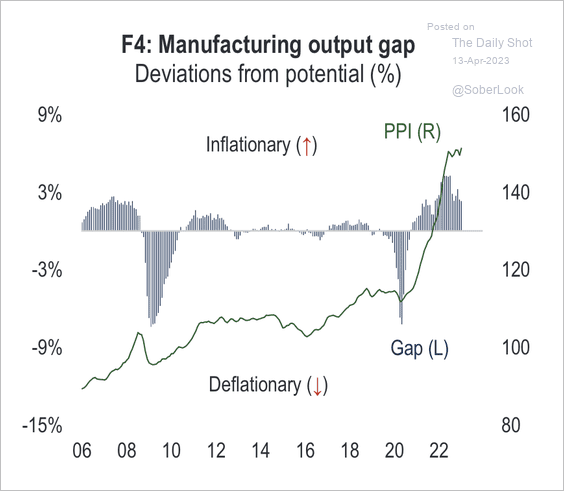
1. The global manufacturing output gap remains inflationary.
 Source: Numera Analytics (@NumeraAnalytics)
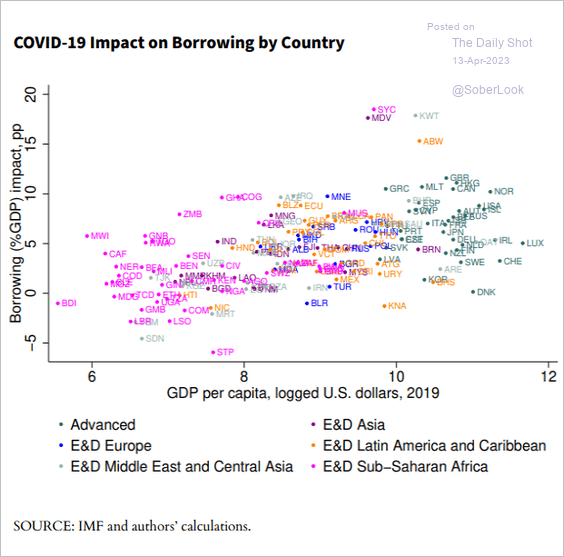
2. Richer countries increased borrowing more than poorer countries after the COVID shock (mostly due to easier access to credit).
 Source: Martin, Sánchez, Wilkinson; Federal Reserve Bank of St. Louis Read full article
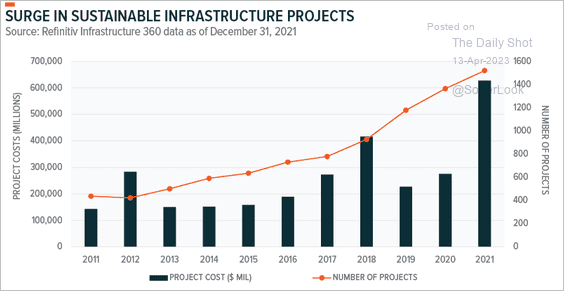
3. There has been a surge in sustainable infrastructure projects in recent years.
 Source: Global X ETFs Read full article
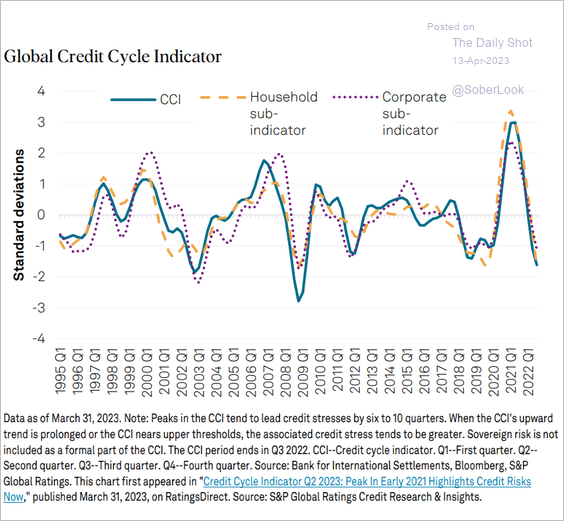
4. This chart shows the Global Credit Cycle Indicator from S&P Global Ratings.
 Source: S&P Global Ratings
——————–
Food for Thought
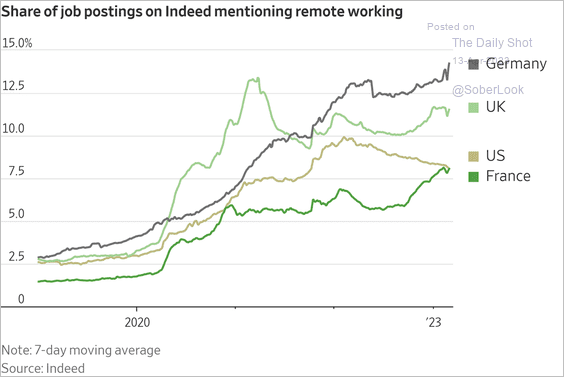
1. Remote-work job postings on Indeed, by country:
 Source: @WSJ Read full article
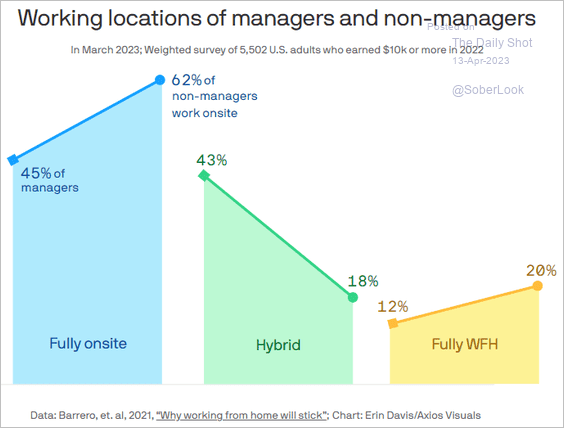
2. Working locations for managers vs. non-managers:
 Source: @axios Read full article
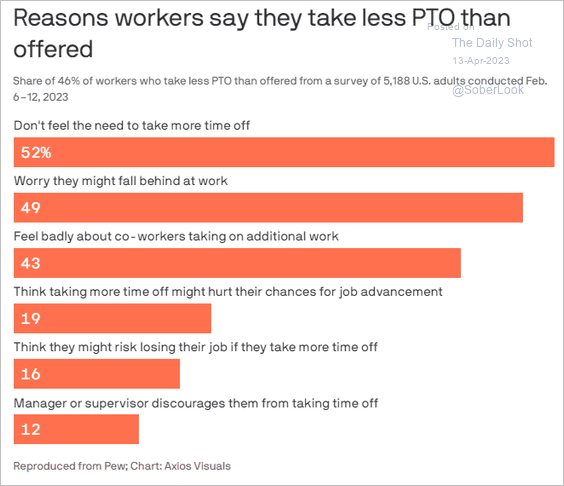
3. Not taking time off:
 Source: @axios Read full article
4. Trusting AI systems:
 Source: Statista
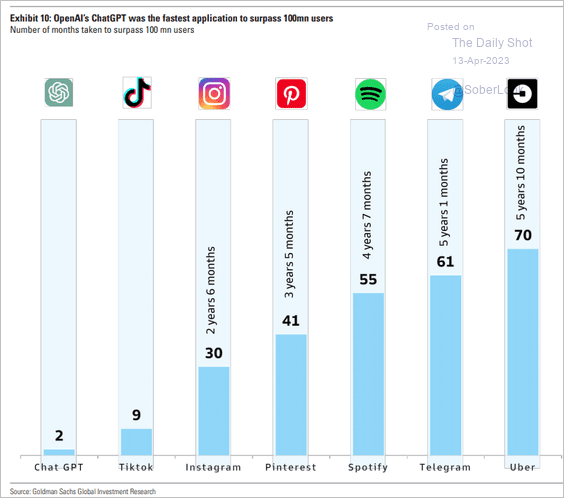
5. The number of months it took to surpass 100 million users:
 Source: Goldman Sachs
6. Homeless veterans:
 Source: USAFacts
7. Access to basic sanitation:
 Source: Statista
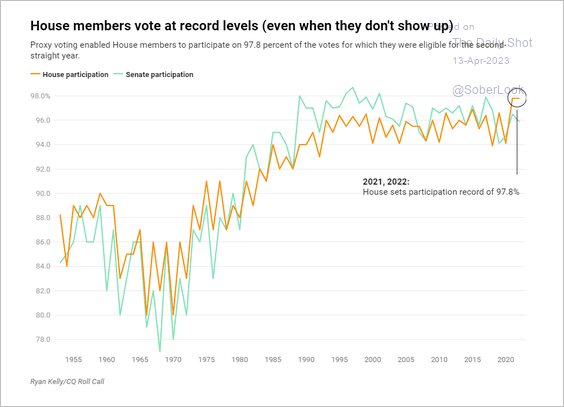
8. Proxies help keep the House of Representatives voting participation at record levels.
 Source: Roll Call Read full article
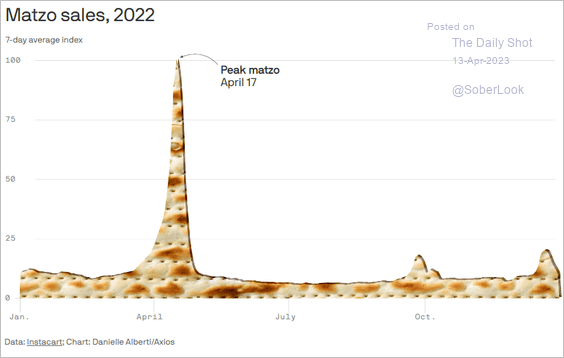
9. Matzo sales:
 Source: @axios Read full article
——————–
Back to Index