
The Daily Shot: 12-May-23
• The United States
• The United Kingdom
• Europe
• Asia-Pacific
• China
• Commodities
• Energy
• Equities
• Credit
• Rates
• Food for Thought
The United States
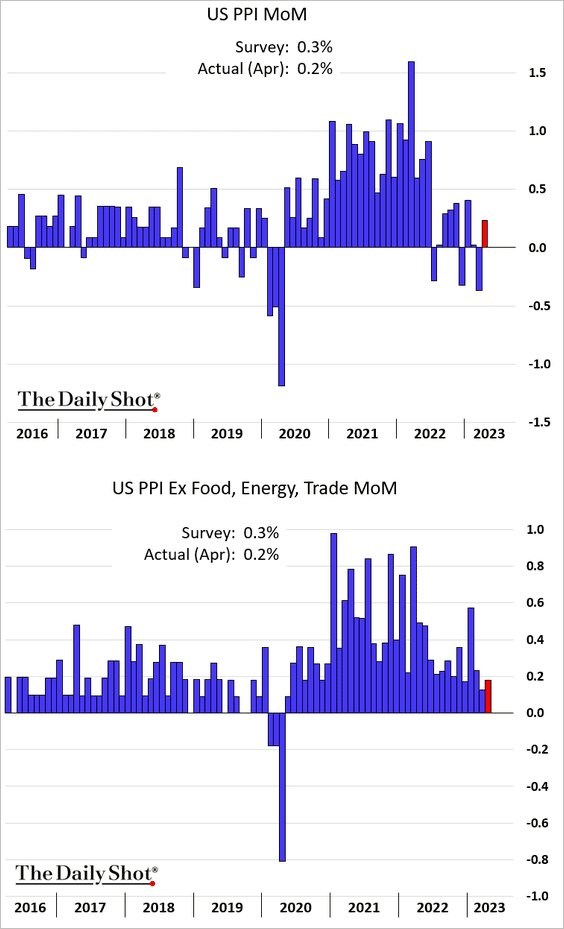
1. Let’s begin with some updates on inflation.
• Gains in producer prices were lower than expected.
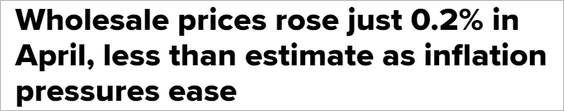 Source: CNBC Read full article
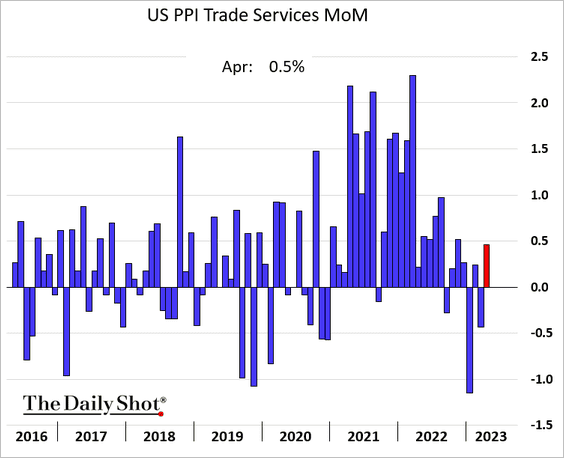
– The trade services PPI (business markups) jumped in April, suggesting that profit margins are not collapsing.
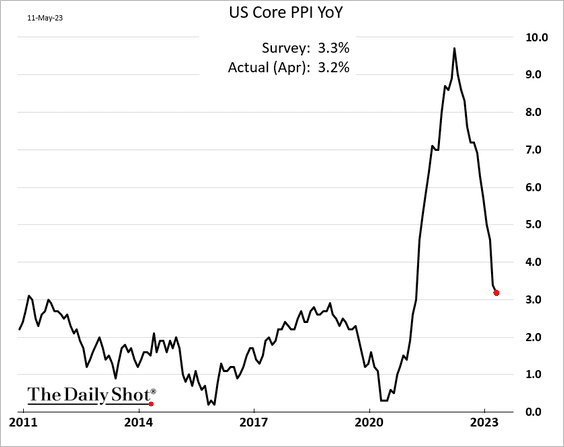
– The core PPI is nearing 3% on a year-over-year basis.
– The PPI is signaling a further slowdown in consumer inflation. This chart includes a forecast from Pantheon Macroeconomics.
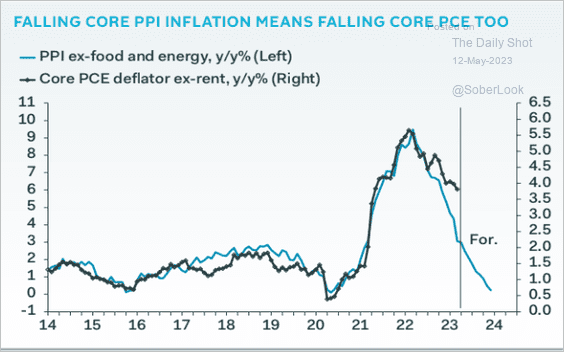 Source: Pantheon Macroeconomics
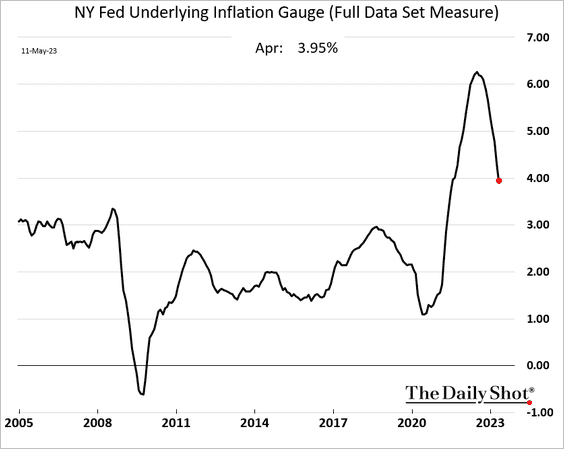
• The Fed’s UIG measure continues to moderate.
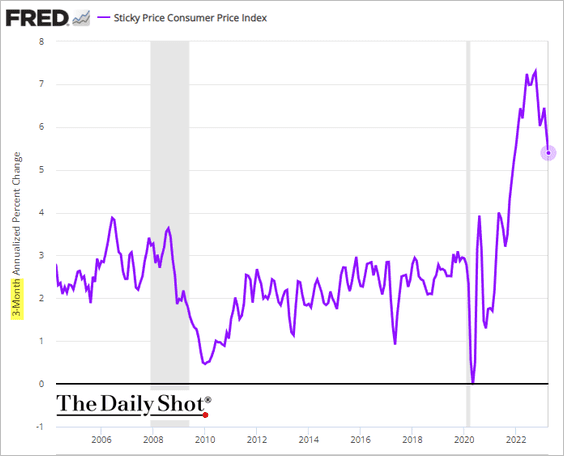
• Here is the sticky CPI (3-month changes).
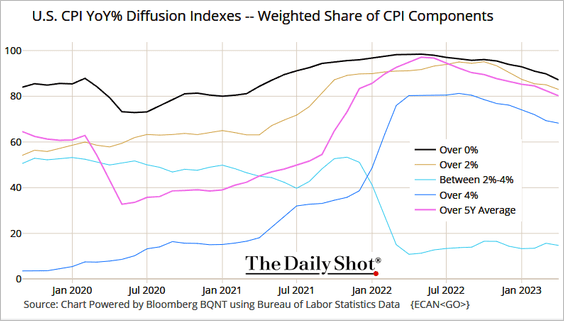
• This chart shows CPI diffusion indices.
 Source: @TheTerminal, Bloomberg Finance L.P.
• China’s PPI signals slower US consumer inflation ahead.
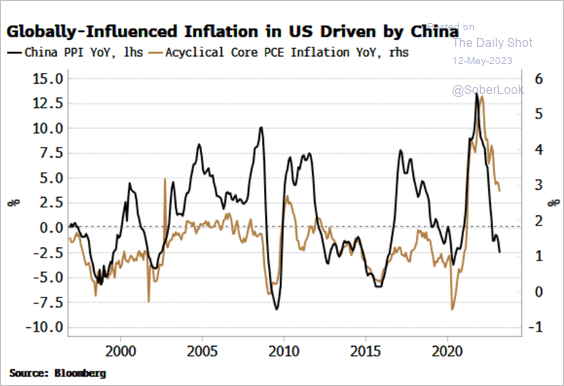 Source: Simon White, Bloomberg Markets Live Blog
• Easing labor shortages helped reduce inflation at restaurants and hotels.
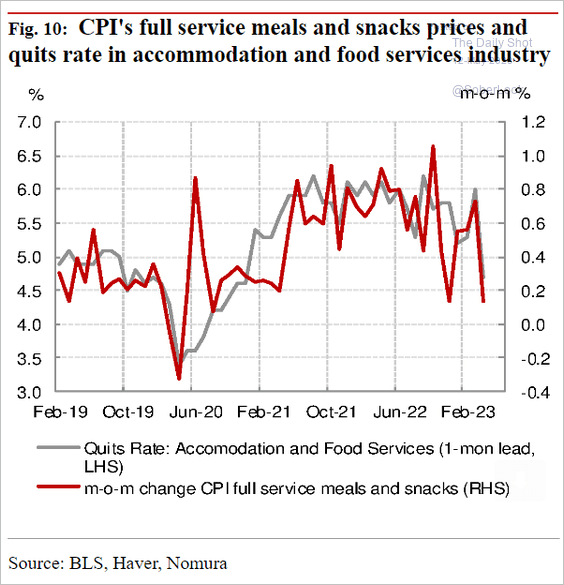 Source: Nomura Securities
• Still waiting …
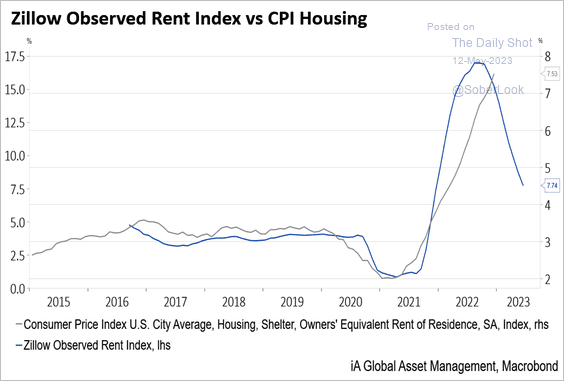 Source: Industrial Alliance Investment Management
——————–
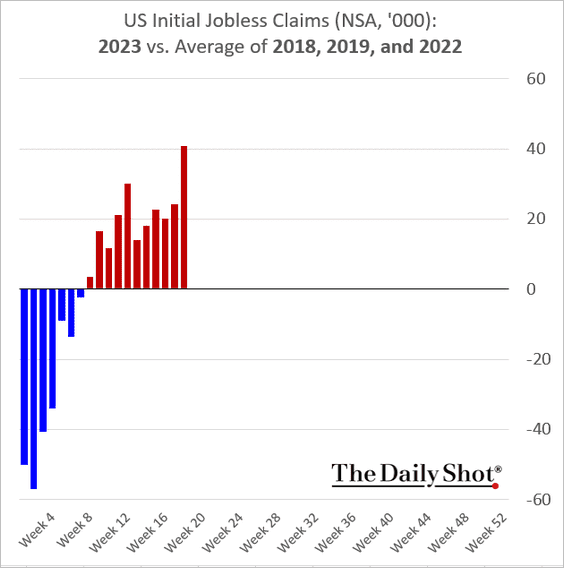
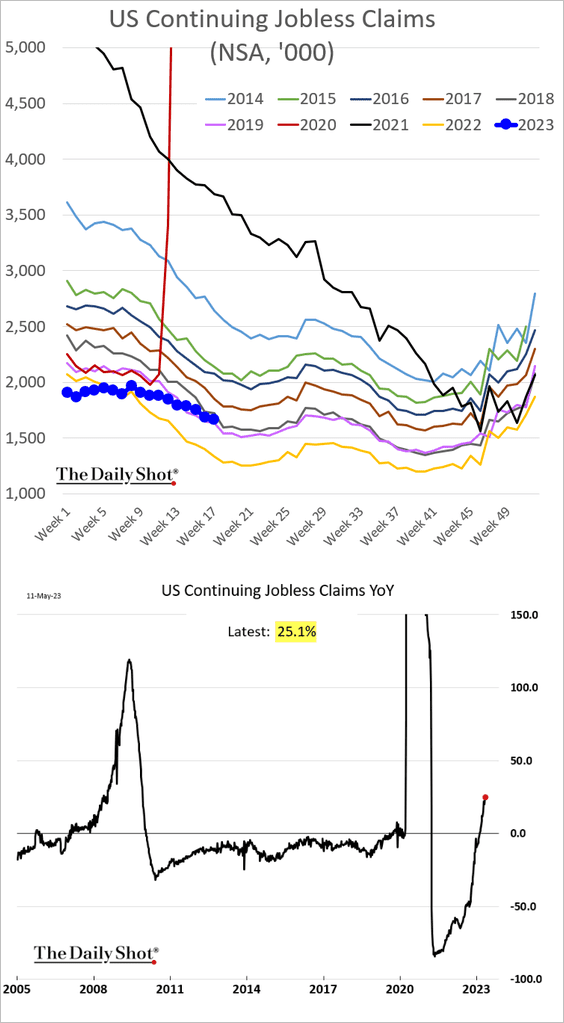
2. The US labor market is starting to sputter as initial jobless claims jump (2 charts).
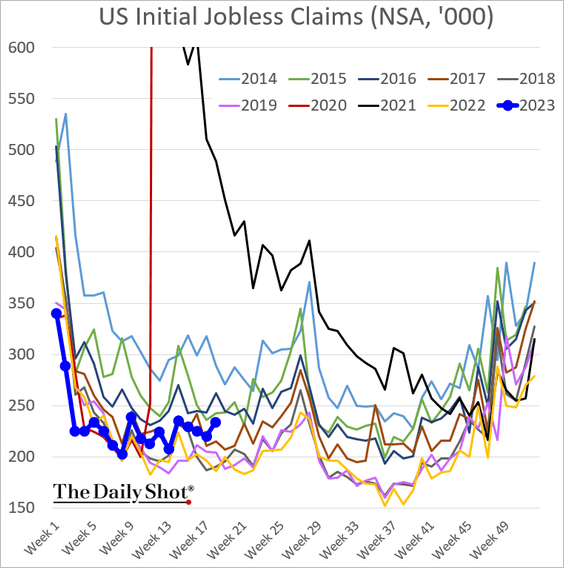
• The number of Americans receiving unemployment benefits is now 25% above last year’s levels.
• States with large tech and financial sectors are seeing higher unemployment claims.
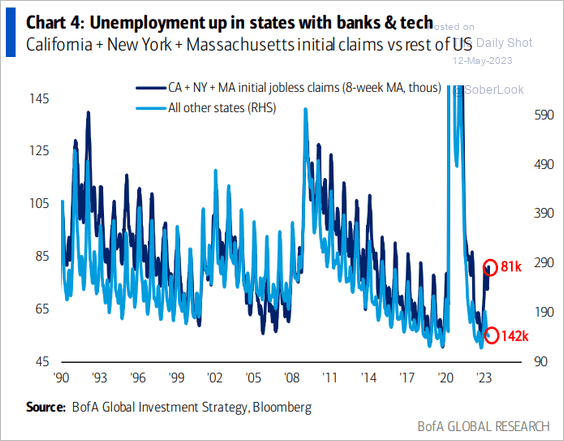 Source: BofA Global Research
——————–
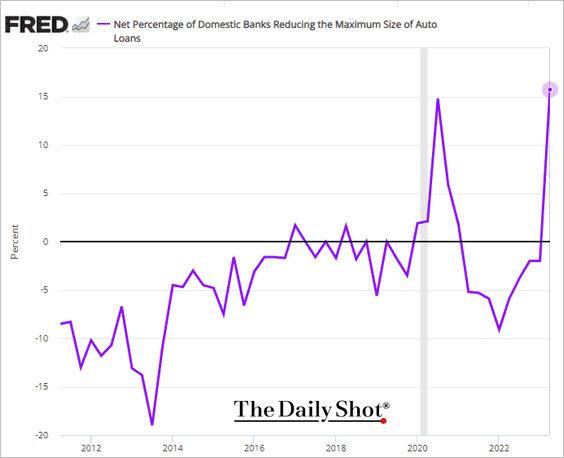
3. Next, we have some updates on consumer credit.
• Banks are lowering limits on auto loans.
• Credit card delinquencies among US millennial homeowners are now above renters.
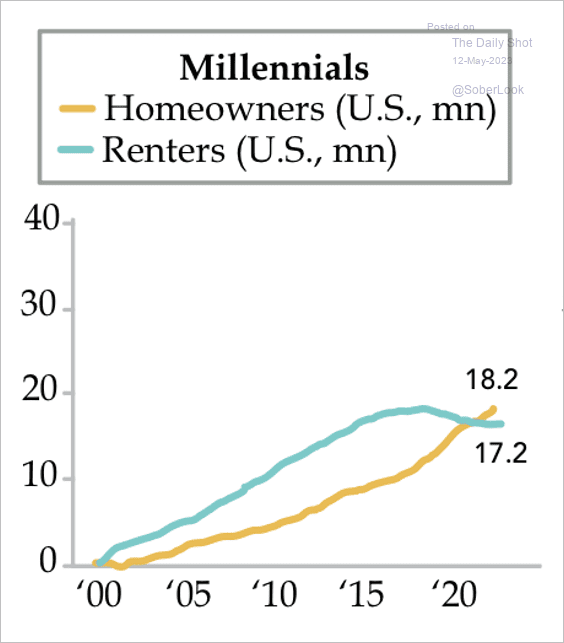 Source: Quill Intelligence
• Here is the distribution of household liabilities by income tier.
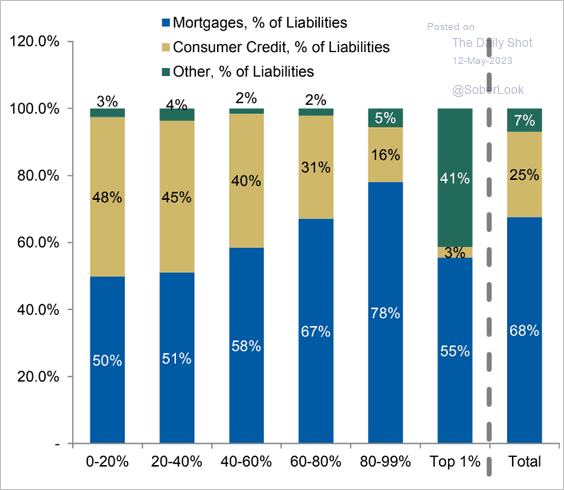 Source: Morgan Stanley Research
——————–
4. The wage growth slowdown has been sharper among higher-income households (1st panel), resulting in softer discretionary spending (2nd panel).
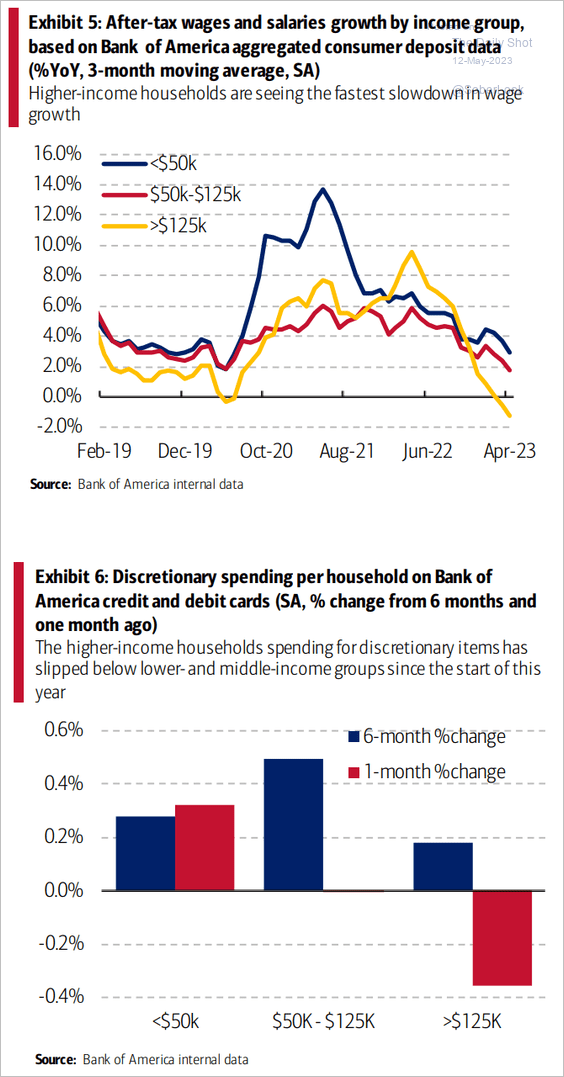 Source: BofA Global Research
5. The average gap between the last Fed rate hike in a cycle and the first cut thereafter is about six months. The median gap is four months. Typically, rate cuts occur when a recession has already started or roughly three months afterward.
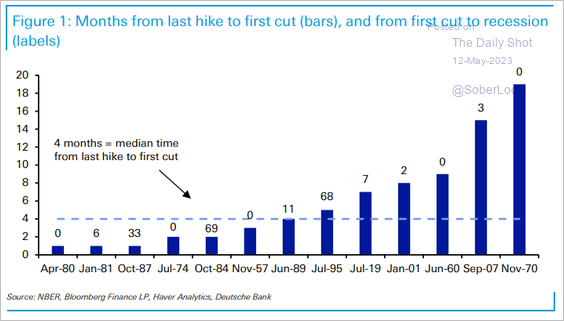 Source: Deutsche Bank Research
6. Pictet expects a recession to start in Q3, with real GDP declines similar to 1990 but significantly smaller than the financial crisis.
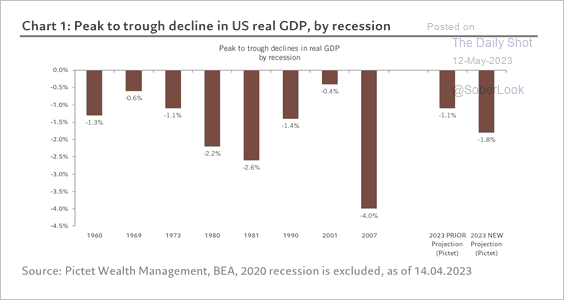 Source: Pictet Wealth Management
Back to Index
The United Kingdom
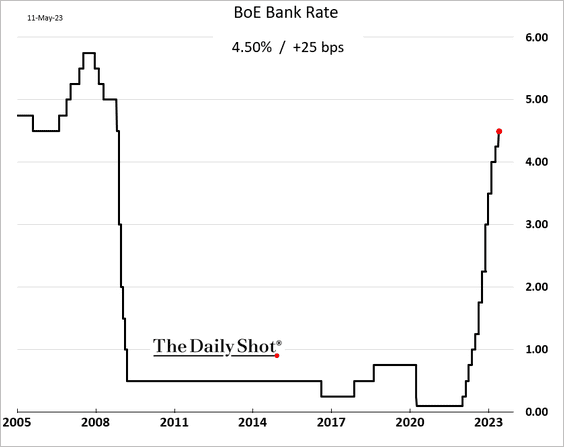
1. The BoE hiked rates by 25 bps (as expected).
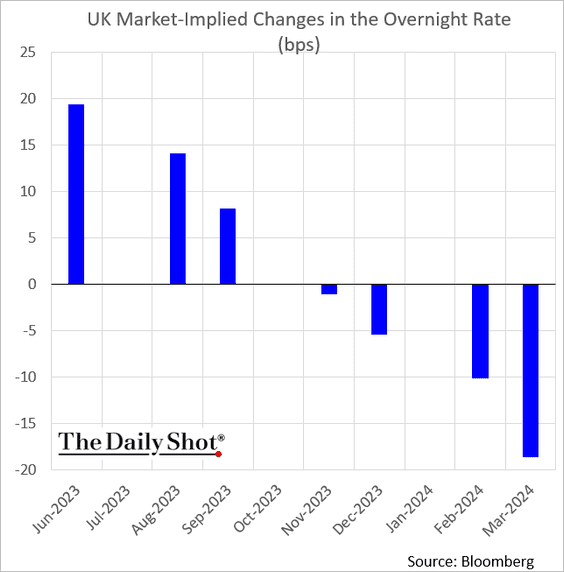
• The market sees a couple of additional rate hikes in this cycle.
• Inflation remains sticky, outpacing the US and the Eurozone.
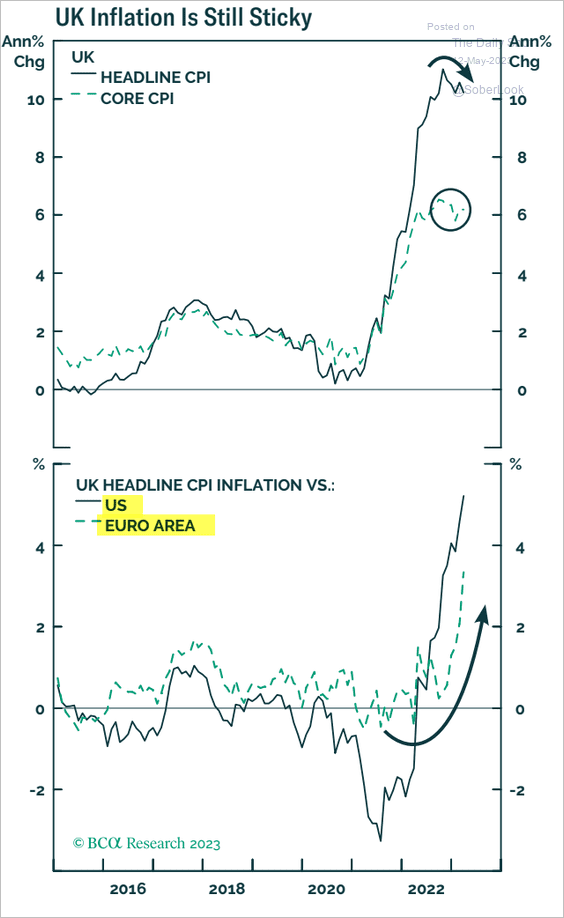 Source: BCA Research
• The BoE boosted its inflation forecast.
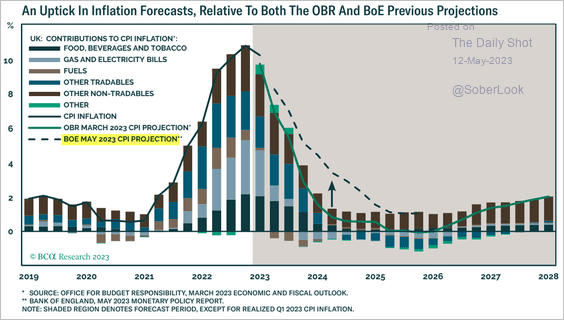 Source: BCA Research
• The central bank now sees the UK avoiding a recession.
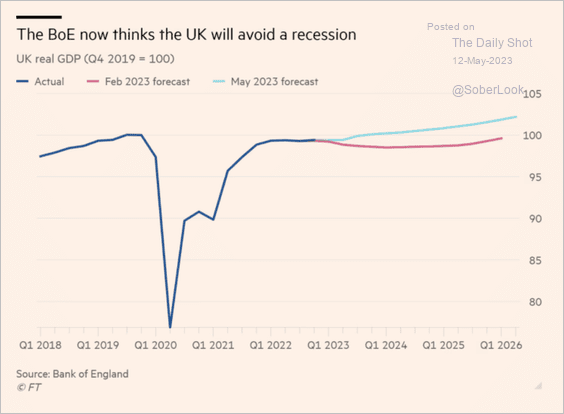 Source: @financialtimes Read full article
• The BoE sharply lowered its forecast for unemployment.
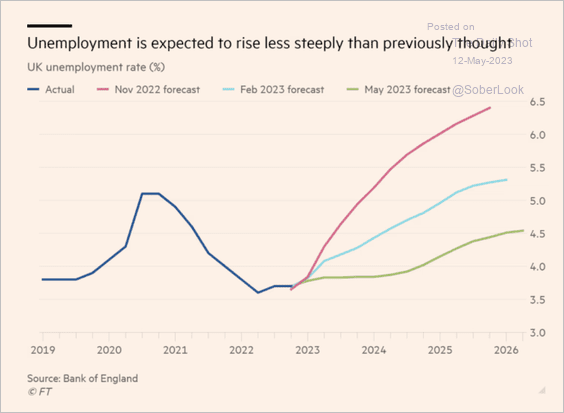 Source: @financialtimes Read full article
——————–
2. The Q1 GDP growth was in line with expectations. We will have more on the GDP report next week.

Back to Index
Europe
1. EUR/USD appears overbought, and bullish sentiment is stretched.
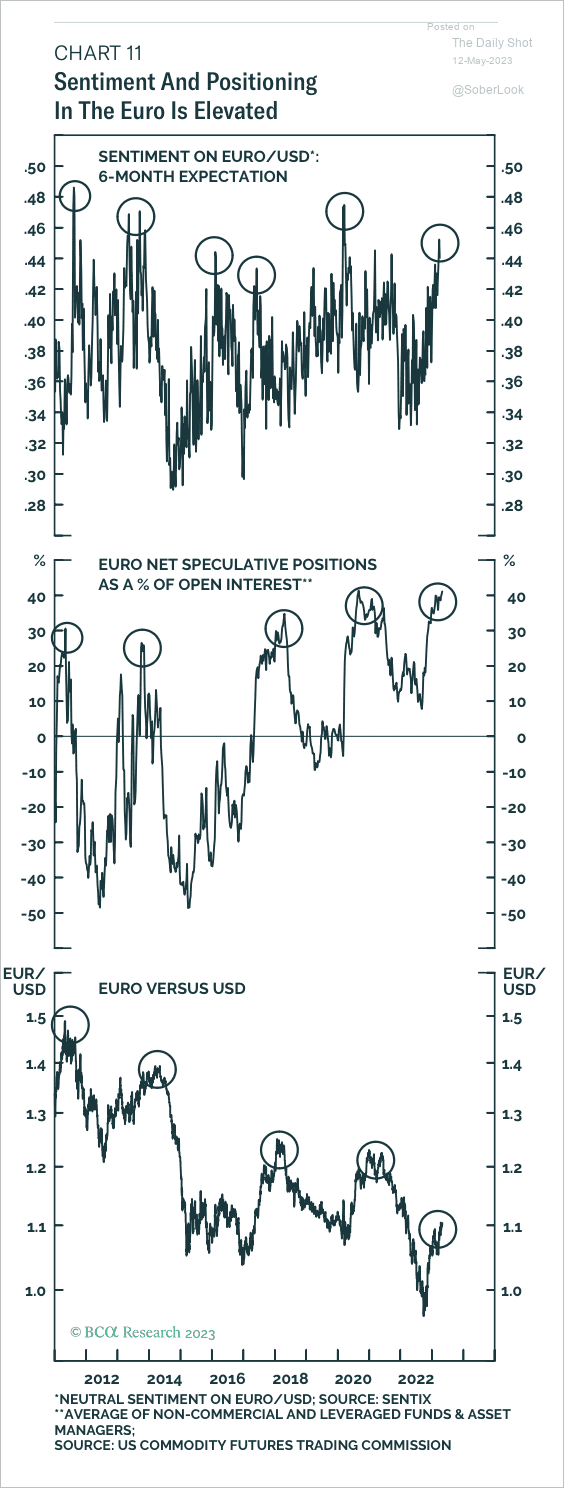 Source: BCA Research
2. This chart shows French, Italian, and German trade with China.
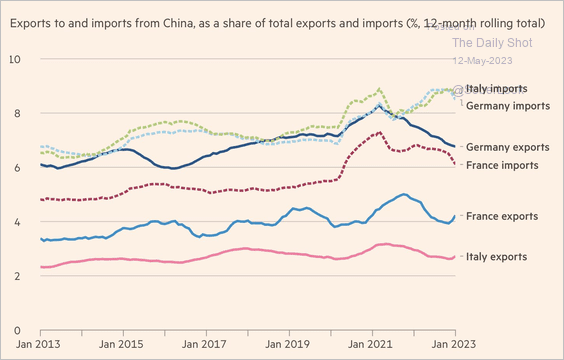 Source: @financialtimes Read full article
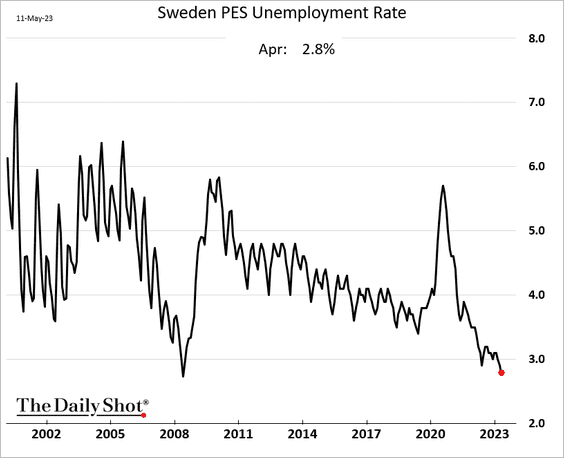
3. Sweden’s unemployment rate is very low.
4. Czech inflation is finally easing.
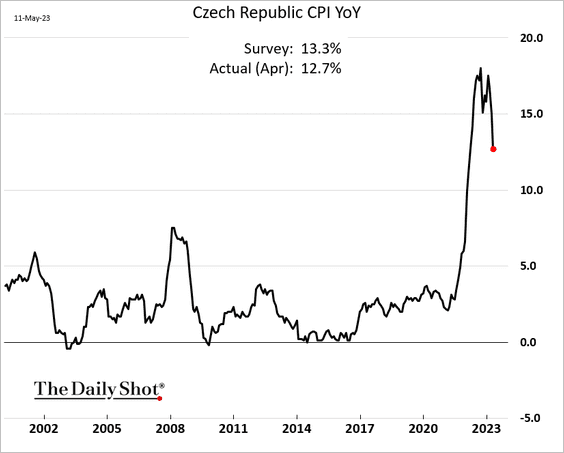
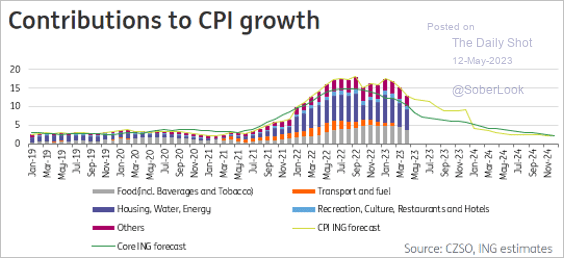 Source: ING
 Source: ING Read full article
——————–
5. Almost 100k non-EU citizens have returned to another country in 2022.
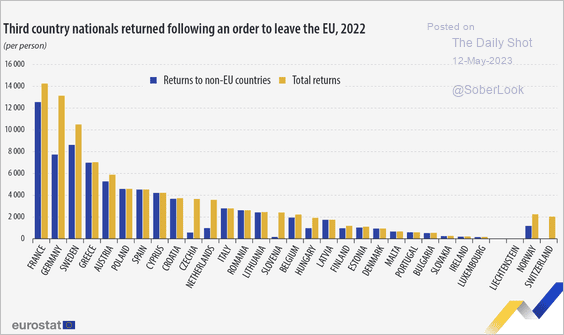 Source: Eurostat Read full article
Back to Index
Asia-Pacific
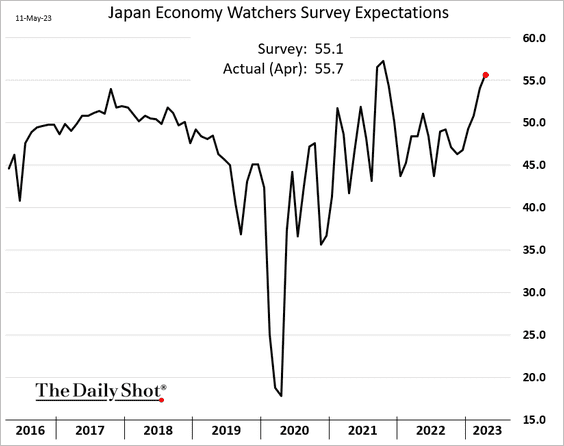
1. Japan’s Economy Watchers Survey continues to rebound.
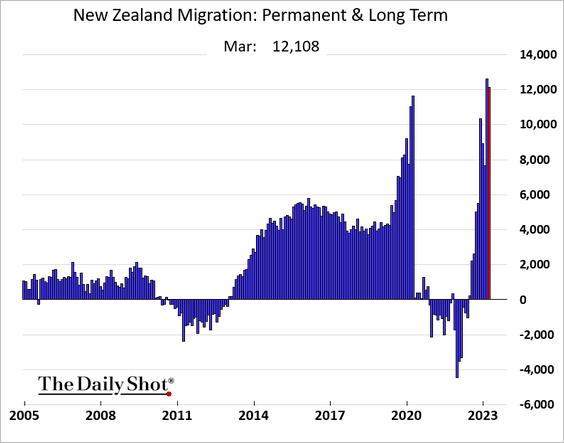
2. New Zealand continues to see increased immigration.
Back to Index
China
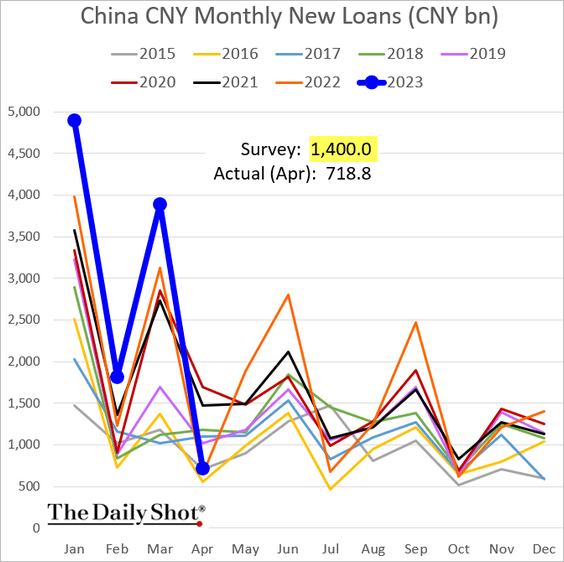
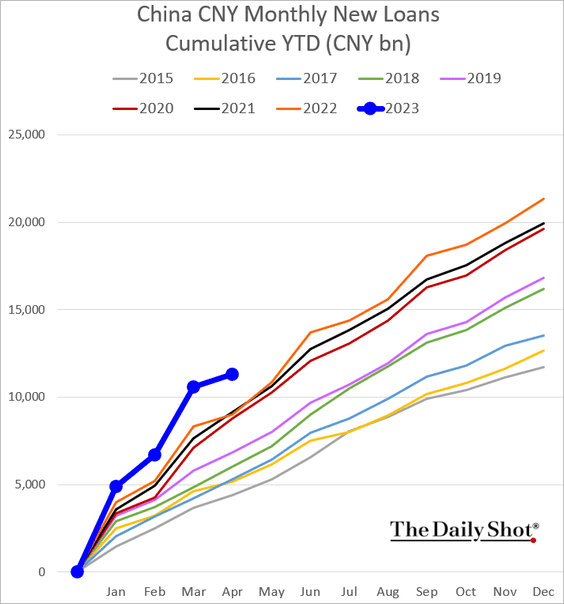
1. Lending slowed sharply in April (well below forecasts).
 Source: @economics Read full article
Total loan balances extended this year are still well above 2022.
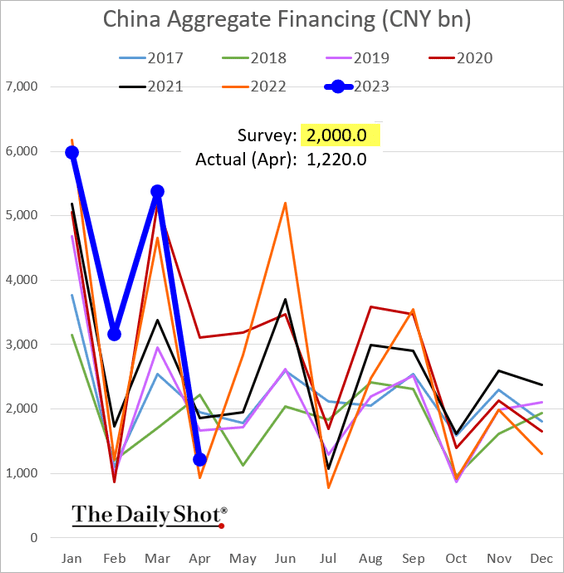
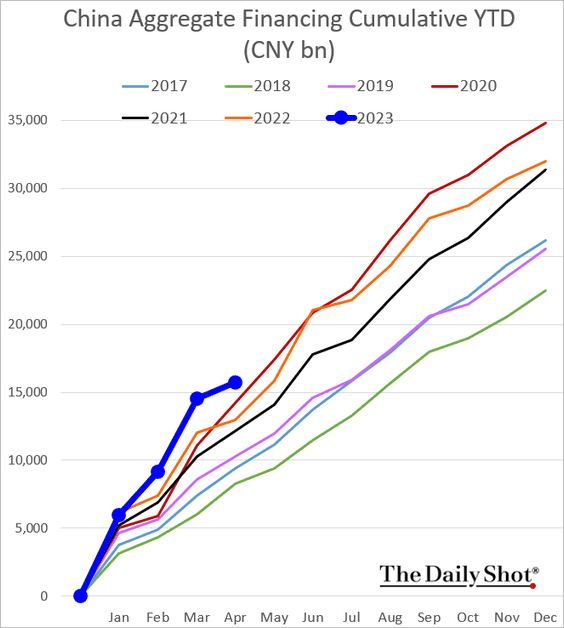
• Aggregate financing (including bonds) was also below forecasts.
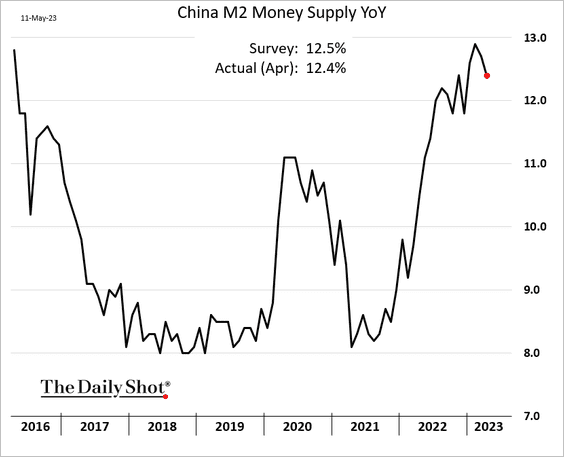
• The money supply growth eased.
——————–
2. The rebound in Chinese stocks has stalled despite positive earnings momentum.
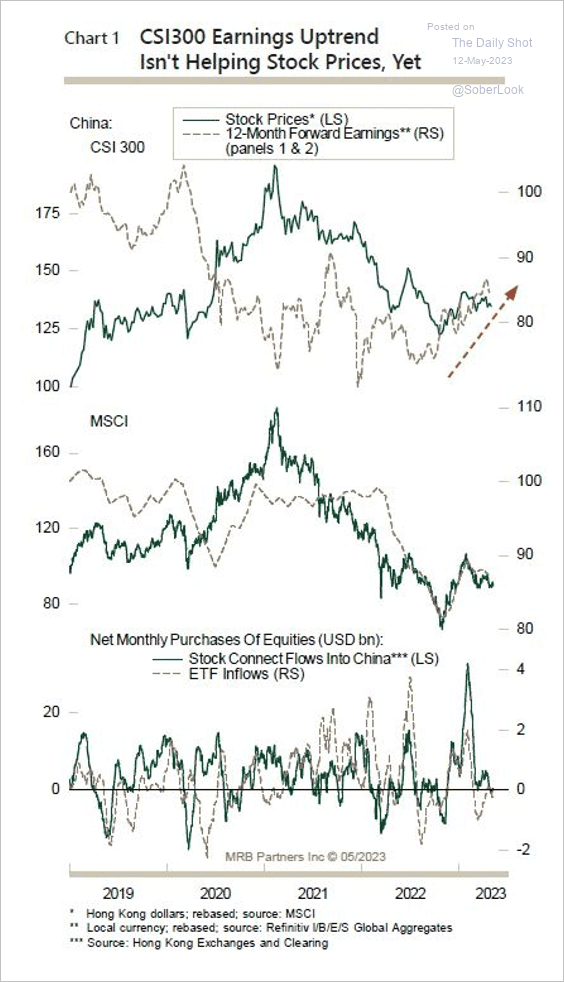 Source: MRB Partners
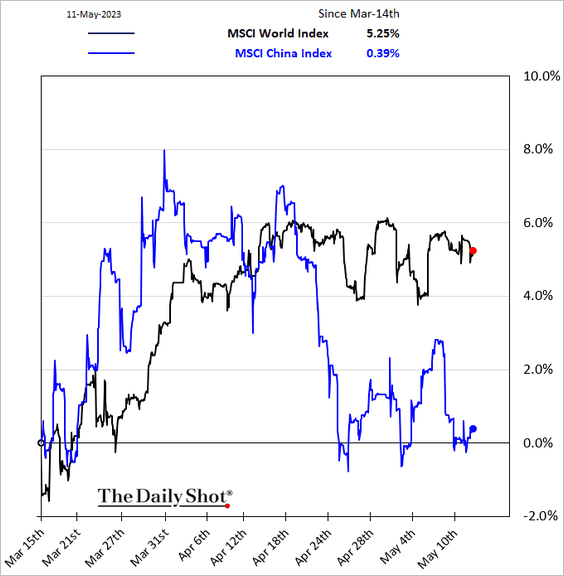
China’s shares are underperforming global peers.
——————–
3. Leading indicators suggest the industrial sector softened this month.
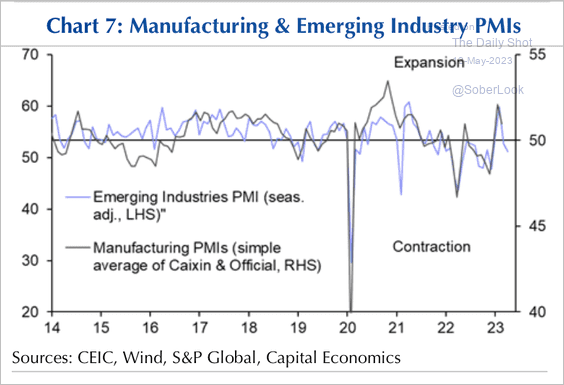 Source: Capital Economics
• Industrial capacity utilization is falling.
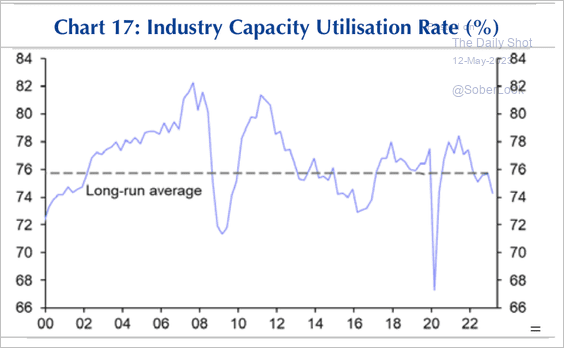 Source: Capital Economics
• The decline in Chinese steel and iron ore prices suggests a weaker-than-expected industrial recovery.
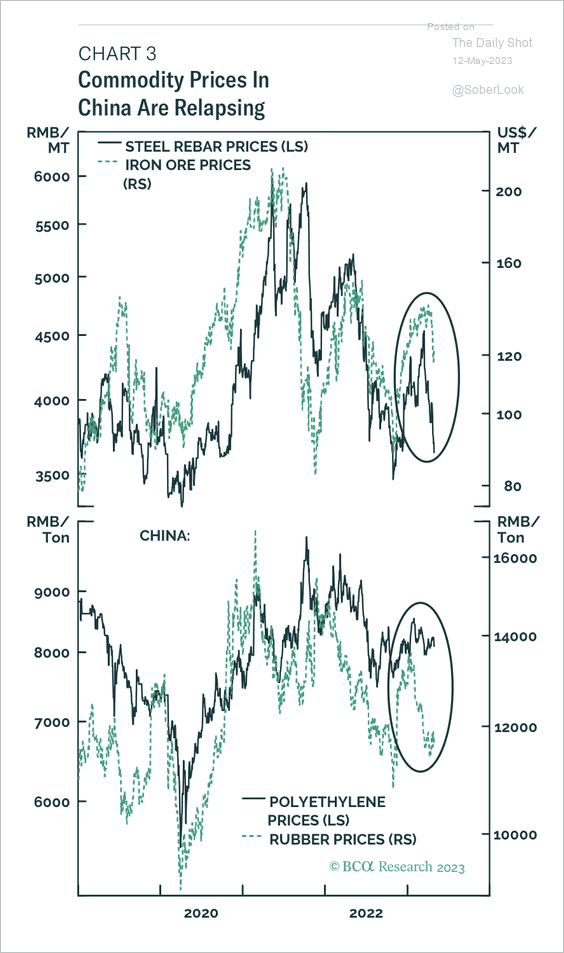 The decline in Chinese steel and iron ore prices suggests a weaker-than-expected industrial recovery.
Source: BCA Research
——————–
4. The improvement in hiring surveys in Q1 points to accelerating household income growth later this year, which could support greater consumption, according to Gavekal.
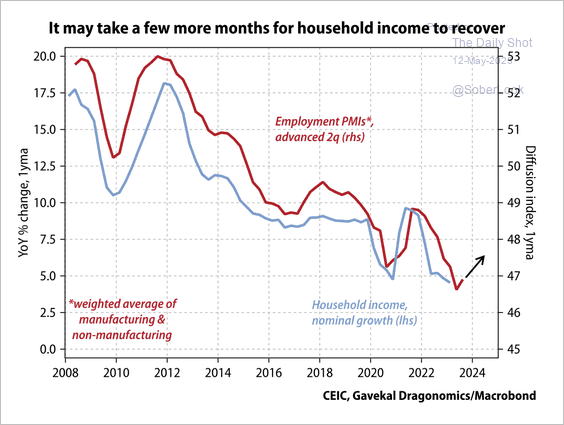 Source: Gavekal Research
Back to Index
Commodities
1. Silver declined sharply this week and is now at the 50-day moving average.
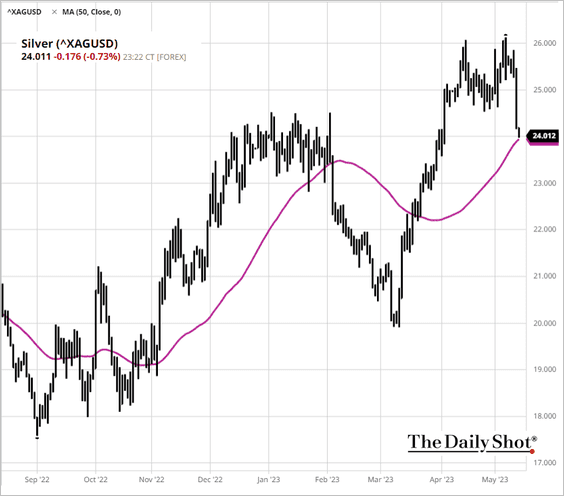 Source: barchart.com
2. Fertilizer prices are falling, reflecting declining input costs and becoming more affordable. (3 charts)
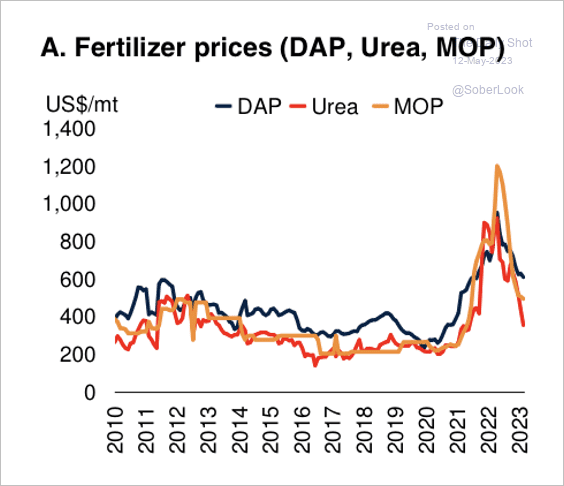 Source: The World Bank
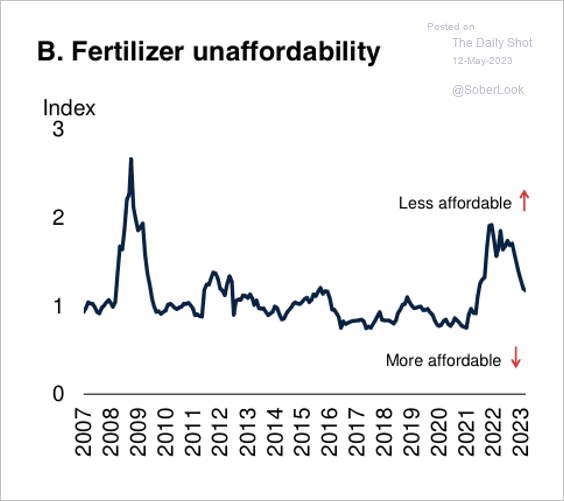 Source: The World Bank
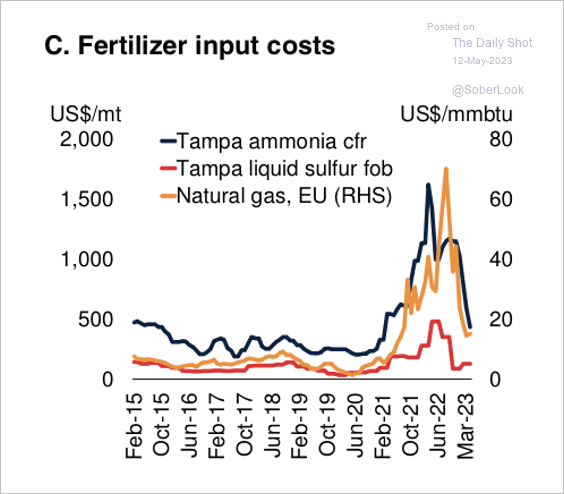 Source: The World Bank
——————–
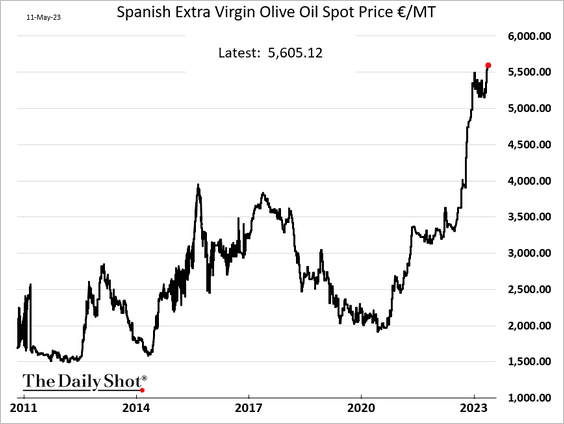
3. Olive oil prices hit a multi-year high.
4. This chart shows Russian grain and oilseed production.
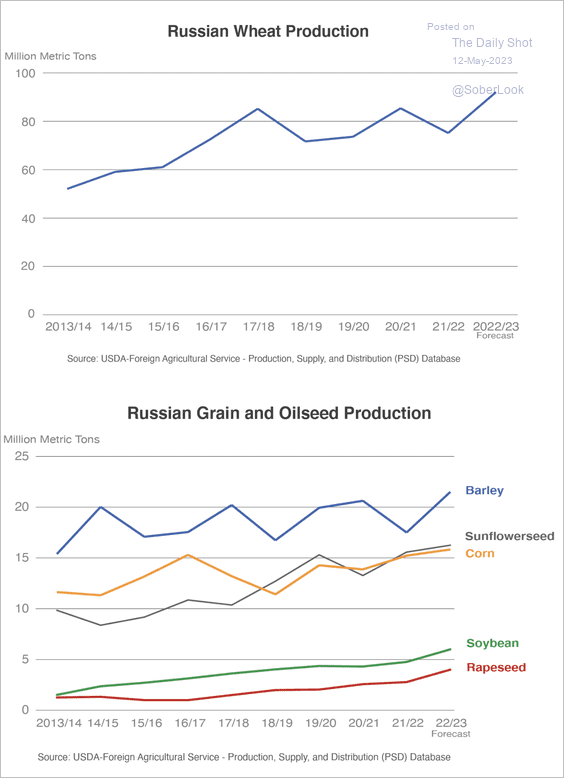 Source: USDA Read full article
Back to Index
Energy
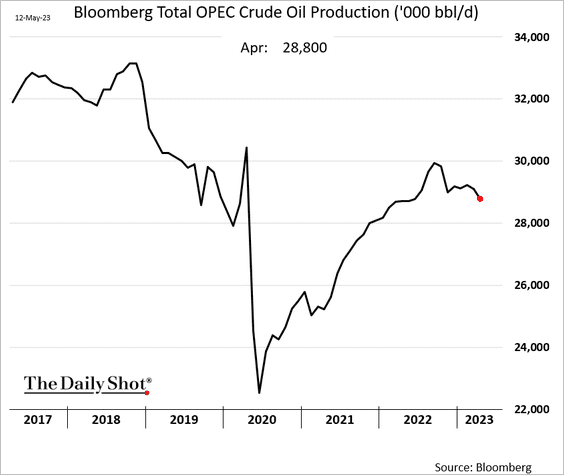
1. OPEC’s oil production slowed again last month.
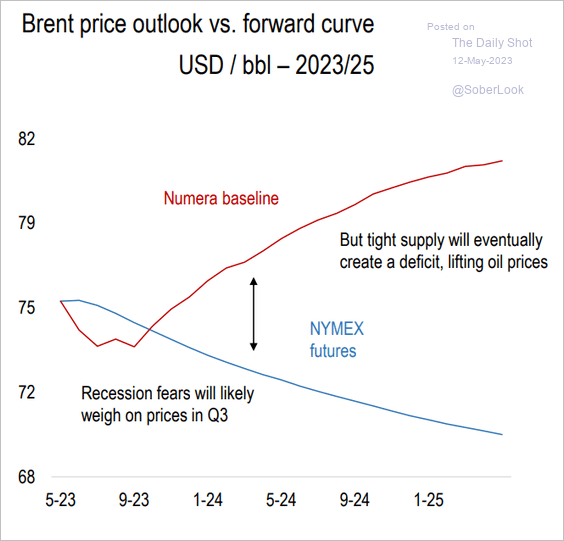
2. Here is a forecast for the Brent crude price trajectory from Numera Analytics.
 Source: Numera Analytics (@NumeraAnalytics)
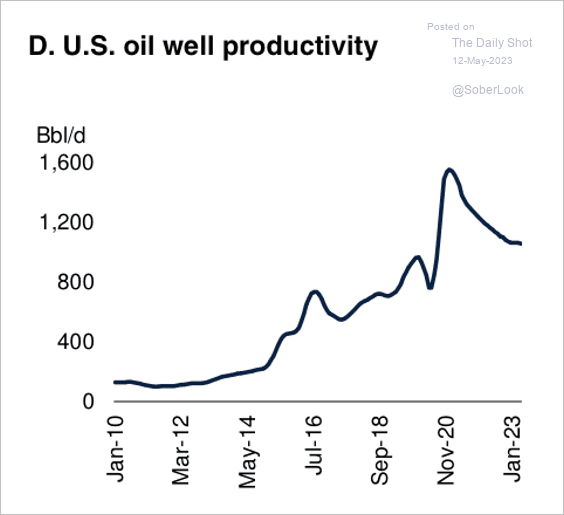
3. US oil well productivity has declined in recent years.
 Source: The World Bank
Back to Index
Equities
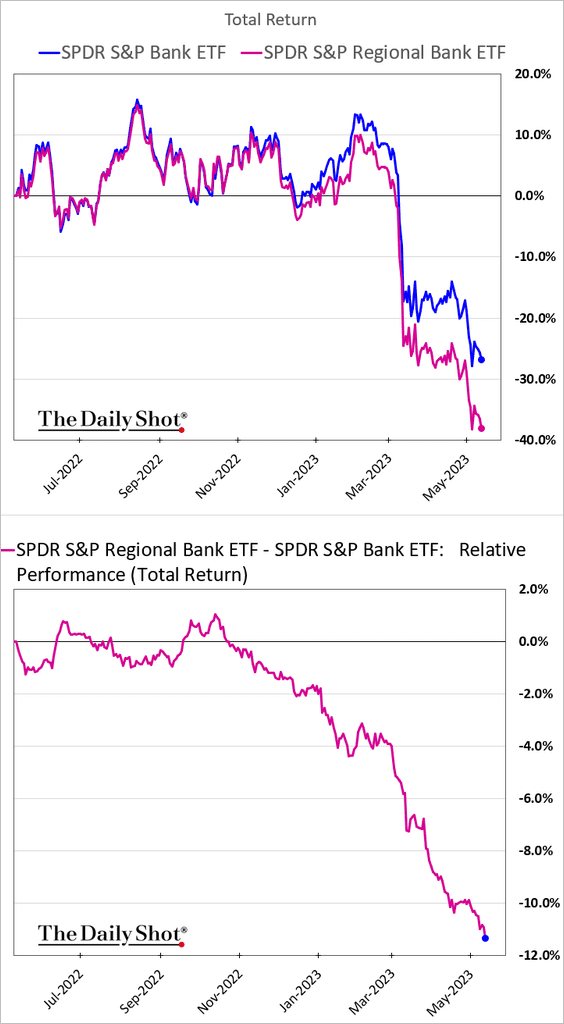
1. Shares of regional banks continue to sink, deepening underperformance relative to the overall banking sector.
• US banks keep underperforming European peers.
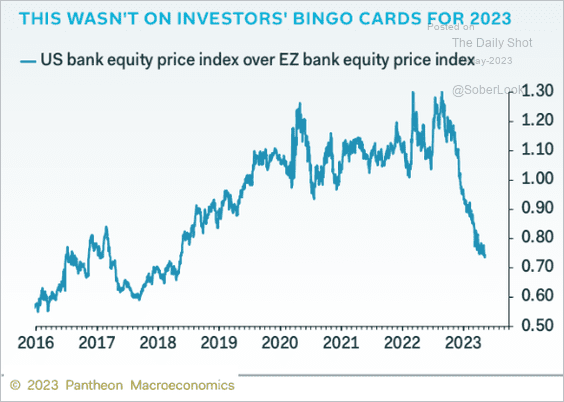 Source: Pantheon Macroeconomics
• The rotation out of financials into tech continues.
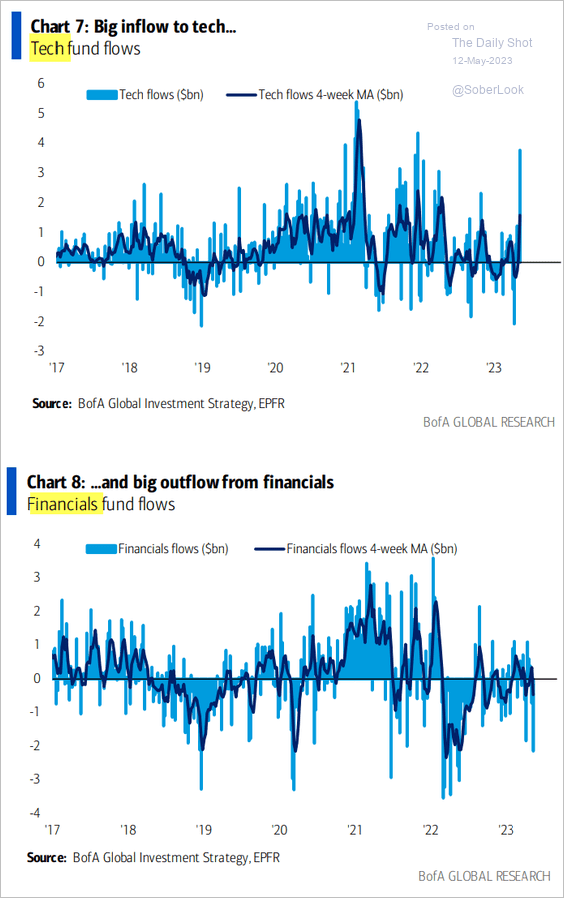 Source: BofA Global Research
——————–
2. The Nasdaq 100 (QQQ) is up about 11% relative to the S&P 500 (SPY) since late January.
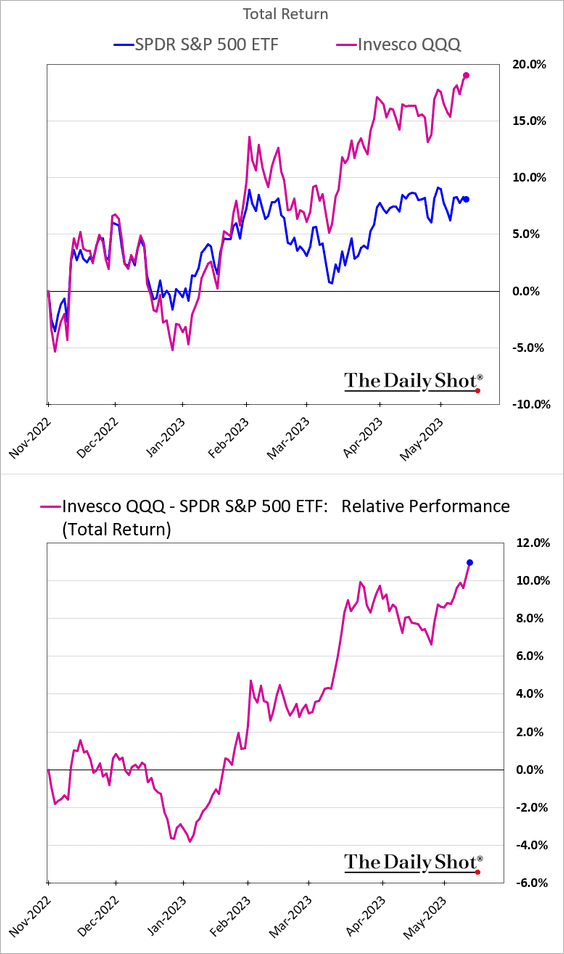
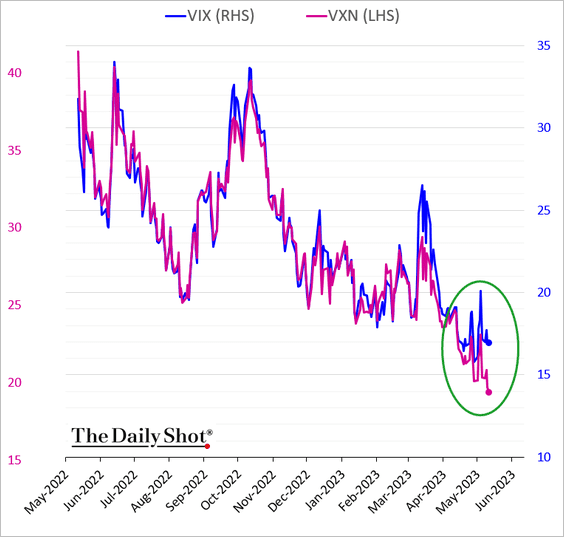
The Nasdaq’s strong performance is visible in the volatility market, with VXN (Nasdaq 100 VIX-equivalent) declining faster than VIX.
——————–
3. US growth stocks have nearly reversed half of last year’s downtrend versus value stocks.
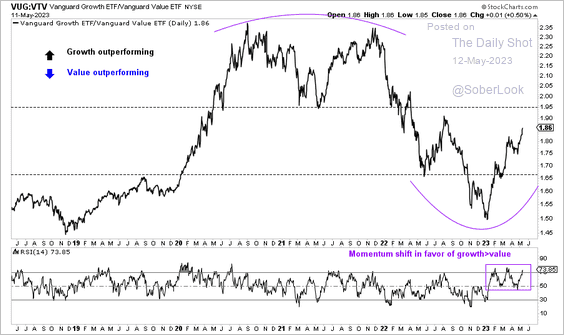 Source: Aazan Habib, Paradigm Capital
4. Demand for VIX call options keeps rising. Investors are preparing for a massive vol spike as the X-date nears.
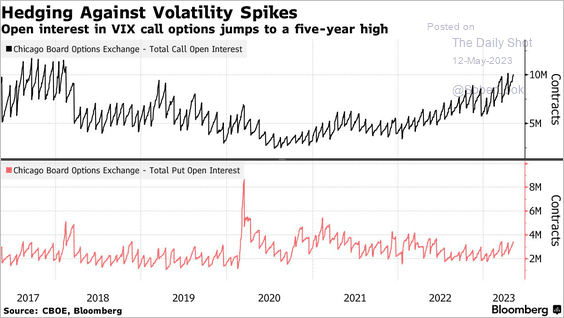 Source: @richhend, @markets Read full article
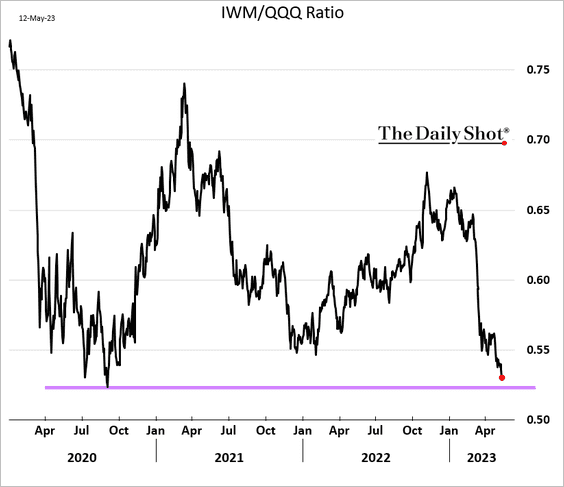
5. Small caps are nearing the 2020 lows vs. the Nasdaq 100.
6. The median earnings beat is at the higher end of its pre-pandemic range.
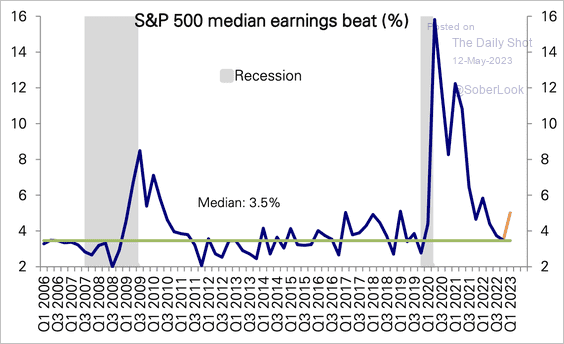 Source: Deutsche Bank Research
Cyclical stocks have been leading earnings beats.
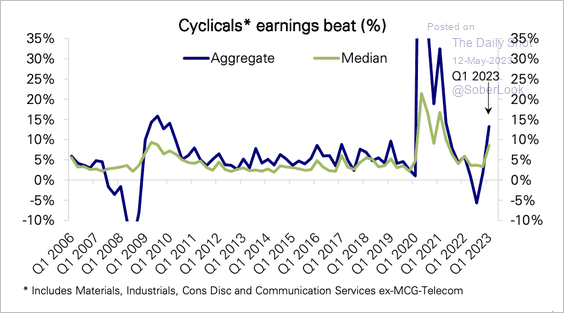 Source: Deutsche Bank Research
——————–
7. BofA’s private clients continue to dump REITs.
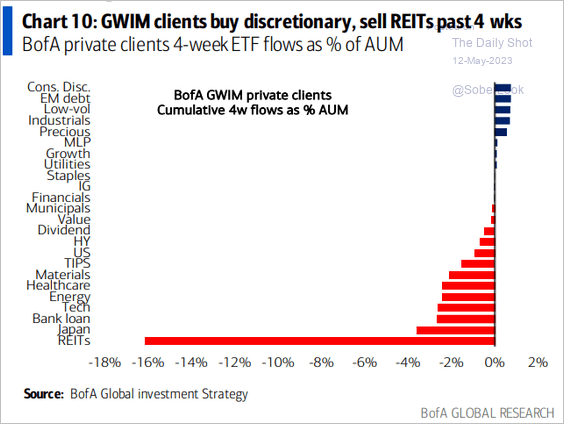 Source: BofA Global Research
Investors are particularly worried about office REITs.
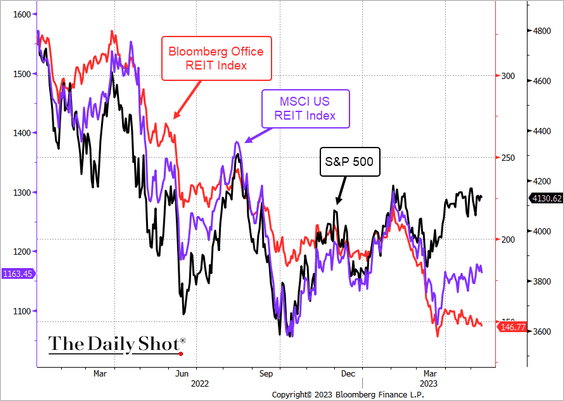 Source: @TheTerminal, Bloomberg Finance L.P.
——————–
8. Retail investors’ equity purchases tumbled this month, …
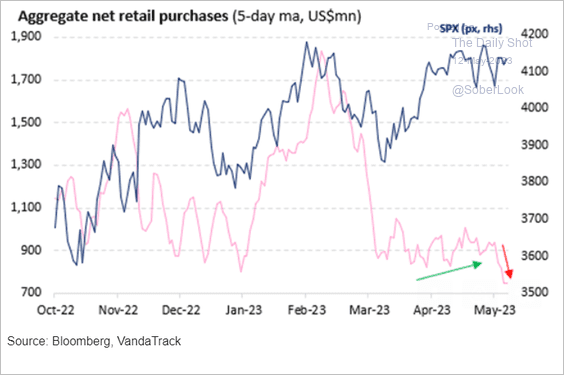 Source: Vanda Research
… mostly due to slower single-stock purchases.
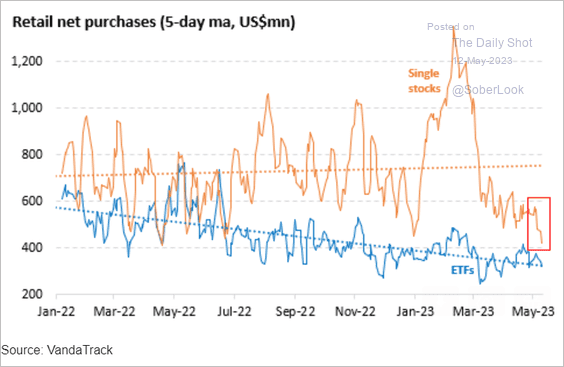 Source: Vanda Research
Back to Index
Credit
1. Bank shares’ relative performance has diverged sharply from Treasury yields. In the past, higher yields typically meant stronger interest margins. But these days, the inverted yield curve is a headwind for earnings, while higher yields mean underwater hold-to-maturity portfolios.
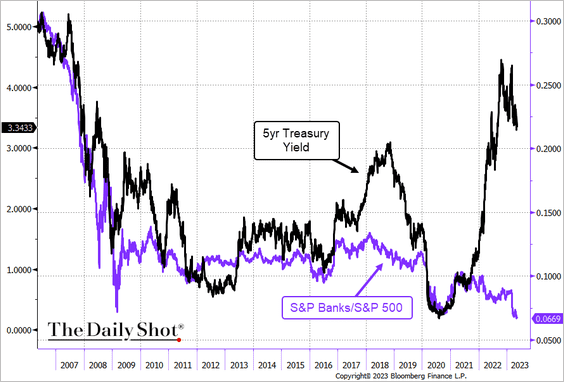 Source: @TheTerminal, Bloomberg Finance L.P.; h/t BofA Global Research
2. The US still has too many banks.
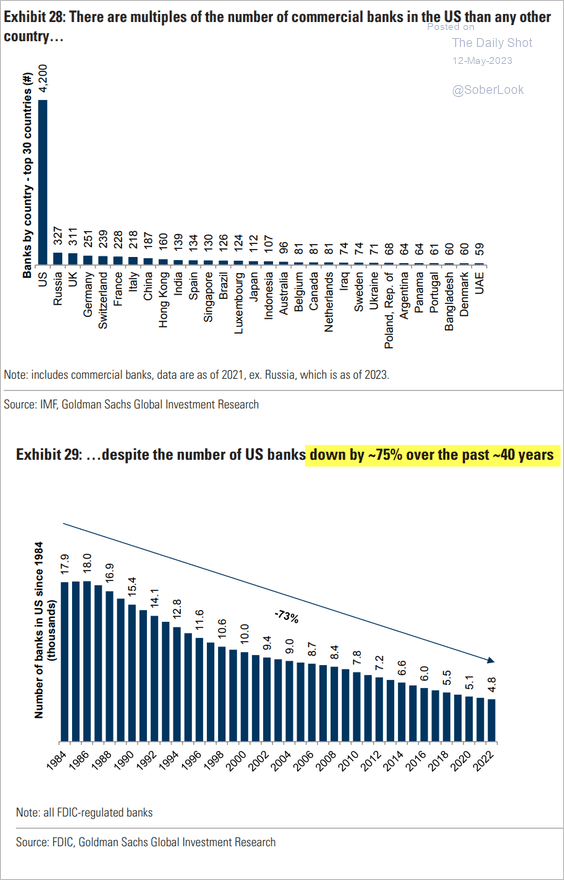 Source: Goldman Sachs
3. Interest coverage ratios on new leveraged loans have declined substantially.
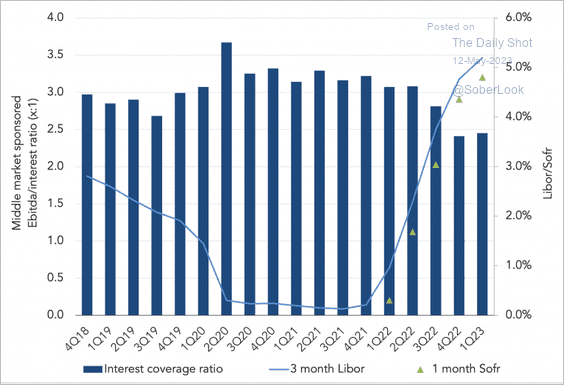 Source: TheLeadLeft Read full article
4. Leveraged loan repayment rates are at multi-year lows.
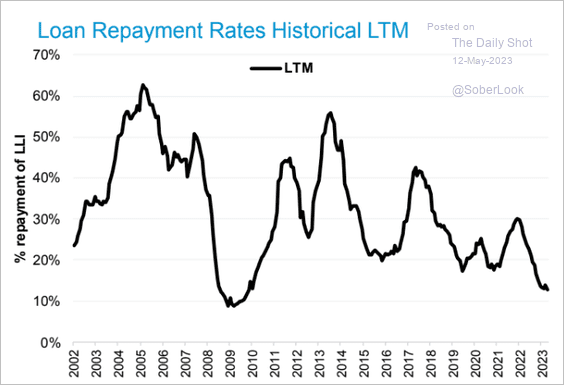 Source: Deutsche Bank Research
5. Office vacancies have risen sharply in the COVID era.
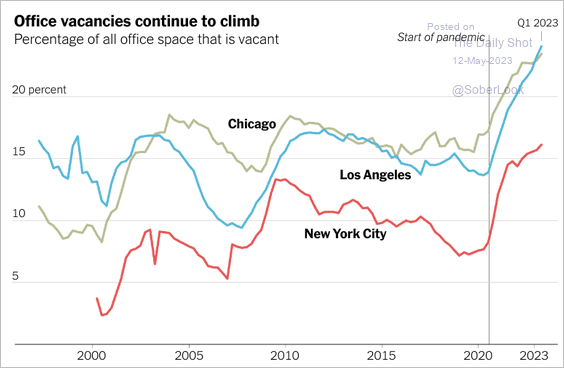 Source: The New York Times Read full article
Back to Index
Rates
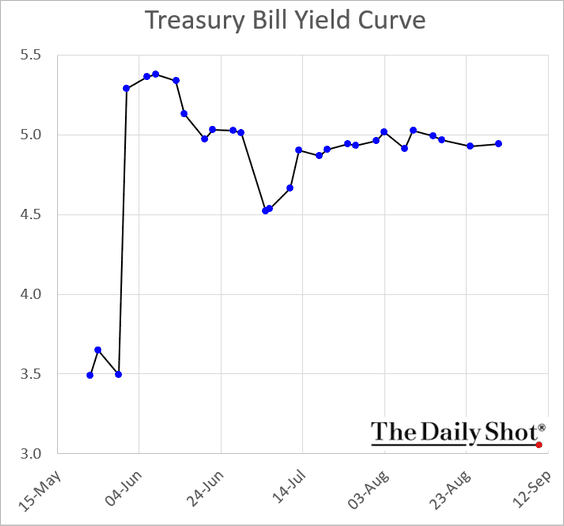
1. Let’s start with the Treasury bill curve.
2. The copper-to-gold ratio points to lower Treasury yields ahead.
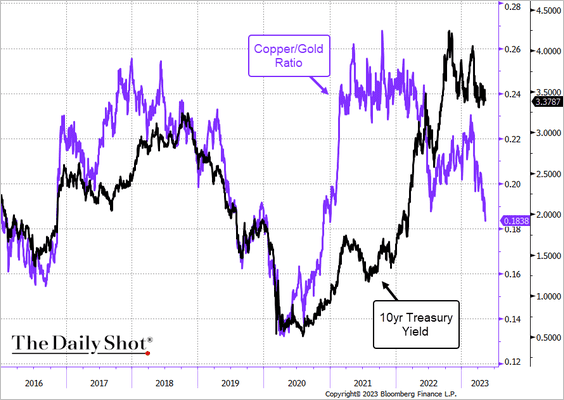 Source: @TheTerminal, Bloomberg Finance L.P.
3. Here is Numera Analytics’ attribution of the year-to-date decline in the 10-year Treasury yield.
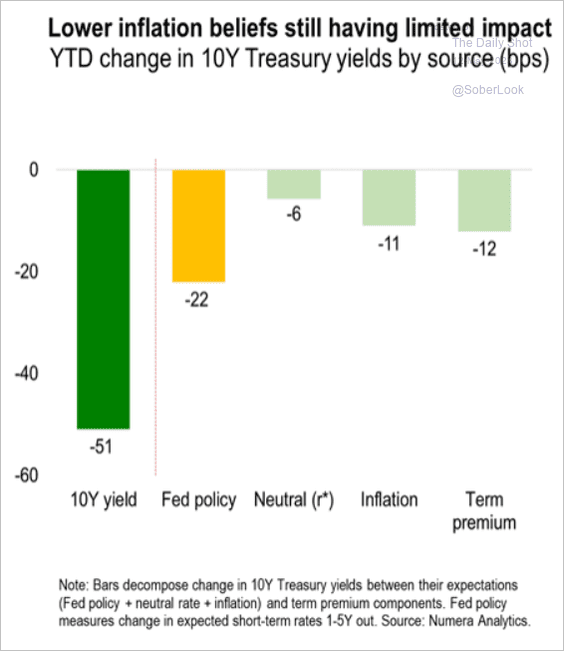 Source: Numera Analytics (@NumeraAnalytics)
——————–
Food for Thought
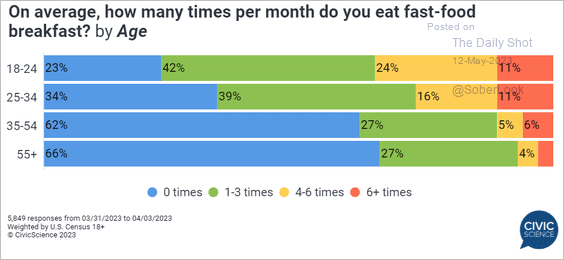
1. Fast-food breakfast:
 Source: @CivicScience Read full article
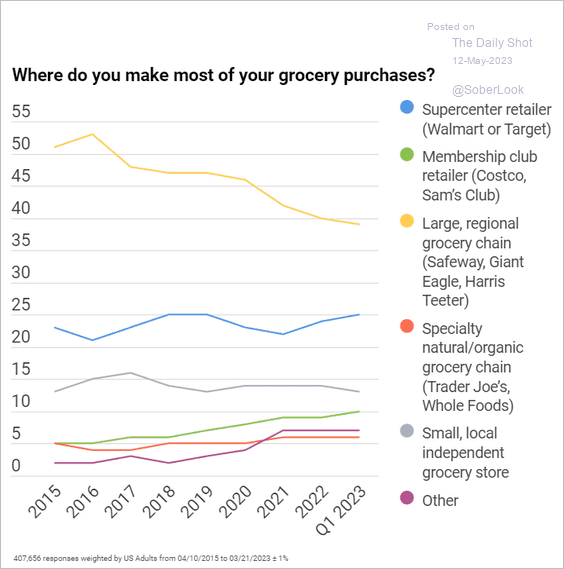
2. Grocery store preferences:
 Source: @CivicScience Read full article
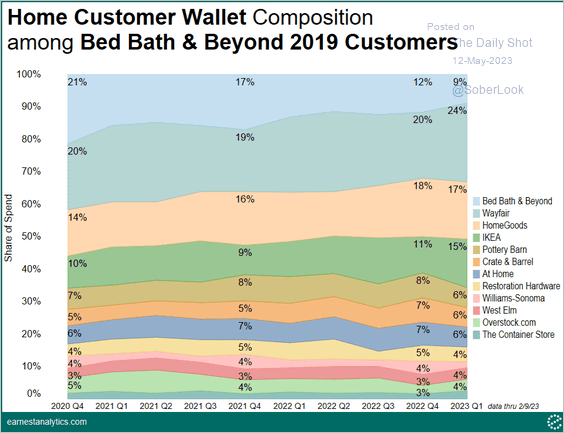
3. How Bed Bath & Beyond customers shifted their spending:
 Source: Earnest Analytics
4. NYC skyscraper construction speed (in stories per year):
 Source: Brian Potter Read full article
5. Labor-market exit age:
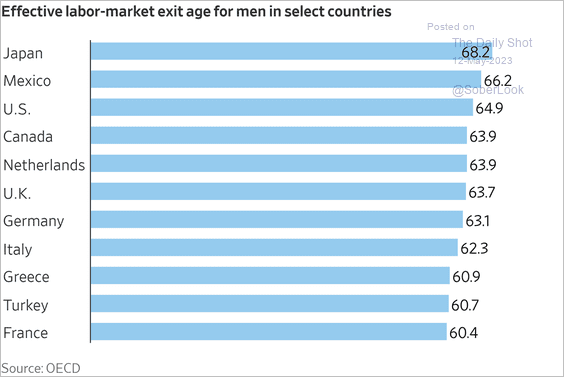 Source: @WSJ Read full article
6. States with the highest interest from home searchers:
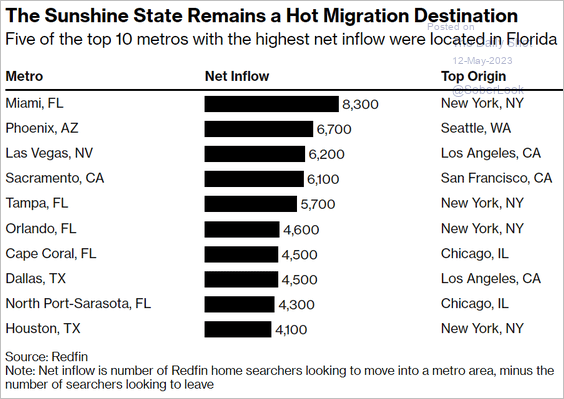 Source: @PaulinaCachero, @wealth Read full article
7. US families with children under 18:
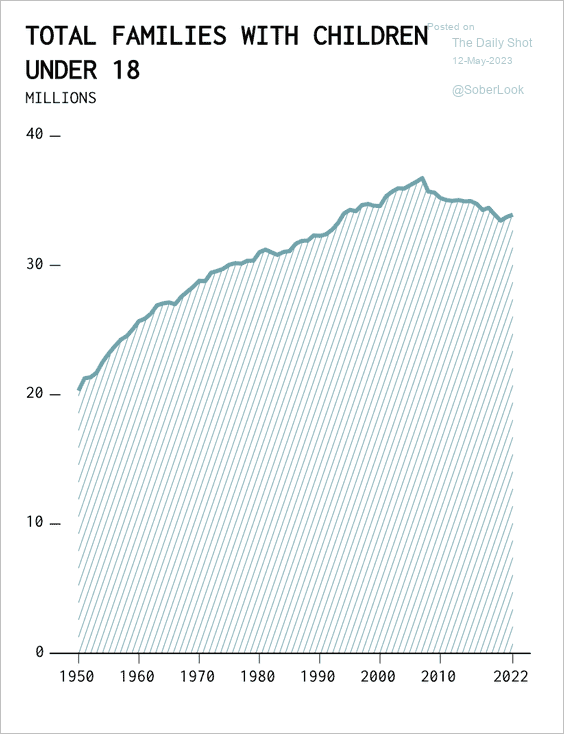 Source: FlowingData
8. Retail health clinics (most are in metropolitan areas):
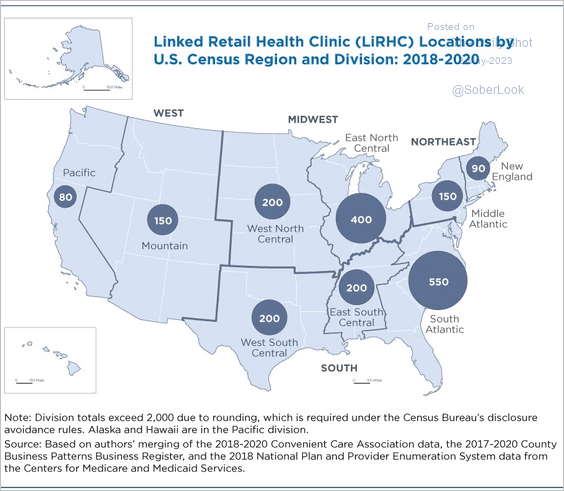 Source: The Census Bureau Read full article
9. US craft beer production:
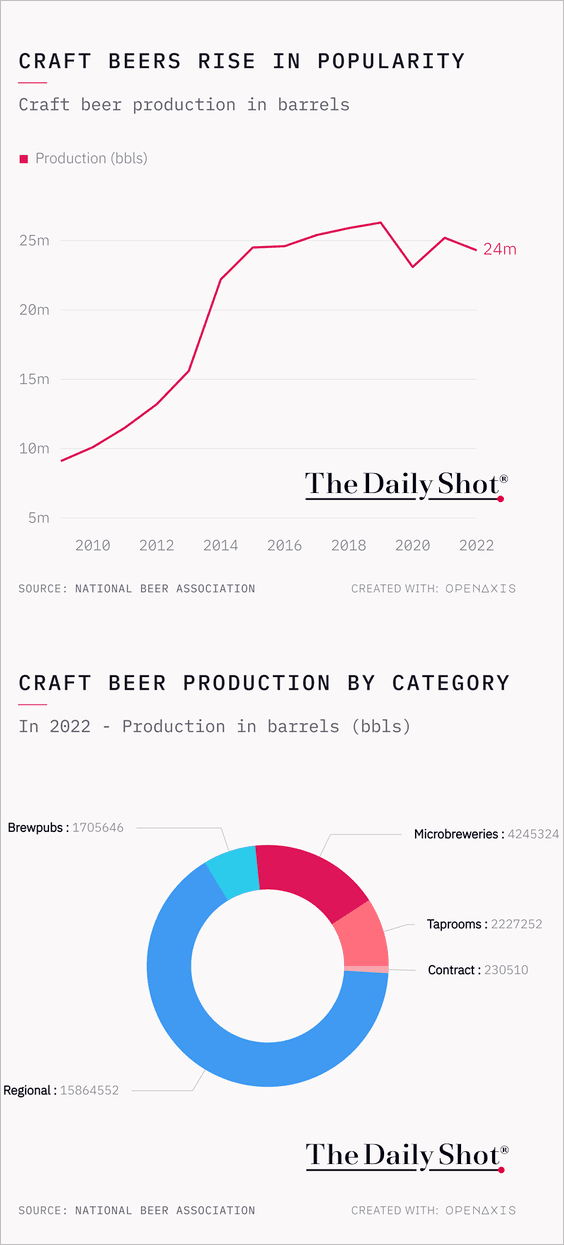 Source: @TheDailyShot
——————–
Have a great weekend!
Back to Index