
The Daily Shot: 30-May-23
• The United States
• The United Kingdom
• The Eurozone
• Europe
• Japan
• Asia-Pacific
• China
• Emerging Markets
• Commodities
• Energy
• Equities
• Credit
• Rates
• Global Developments
• Food for Thought
The United States
1. Consumer spending topped expectations, suggesting that economic activity remains robust.
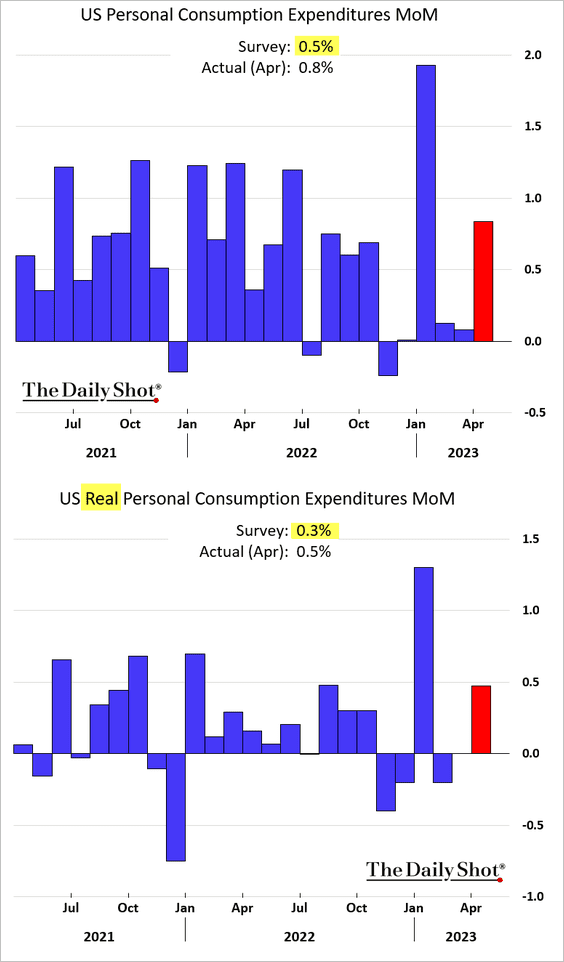
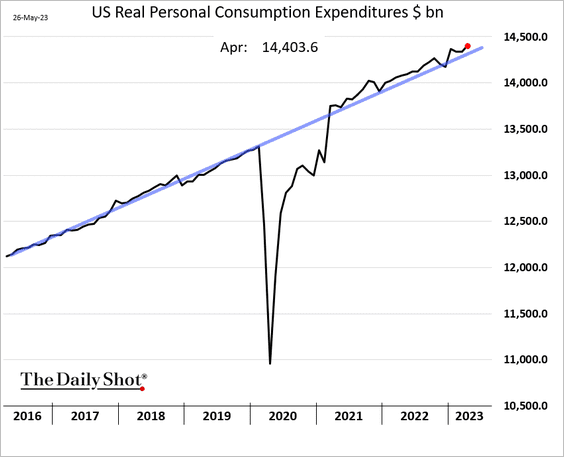
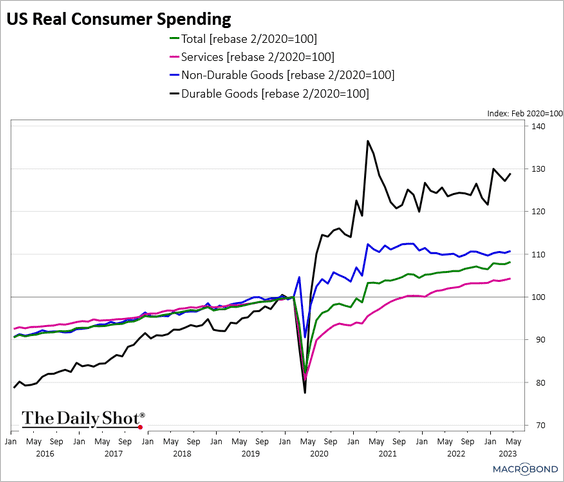
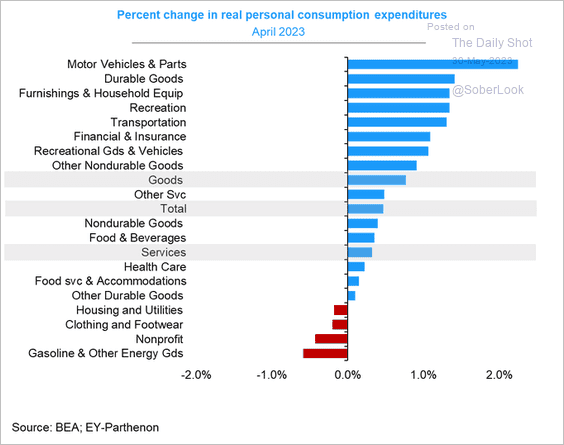
Here are some additional consumer spending trends.
• Real consumer spending level:
• Real consumer spending on goods and services:
 Source: Chart and data provided by Macrobond
• Last month’s changes in consumer spending by sector:
 Source: @GregDaco
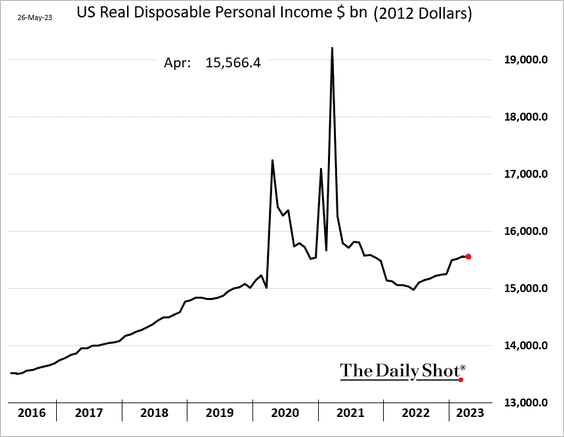
2. Real disposable income was unchanged.
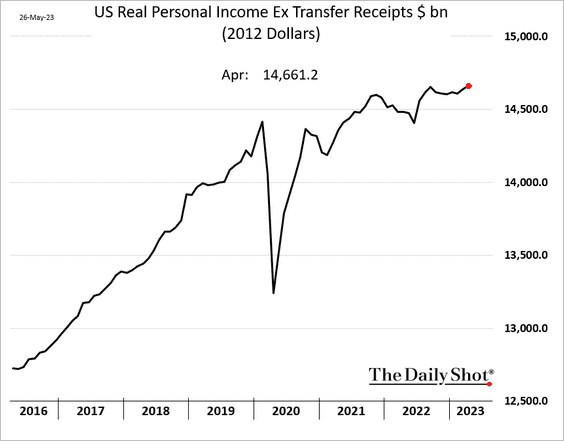
This chart shows real personal income, excluding government checks.
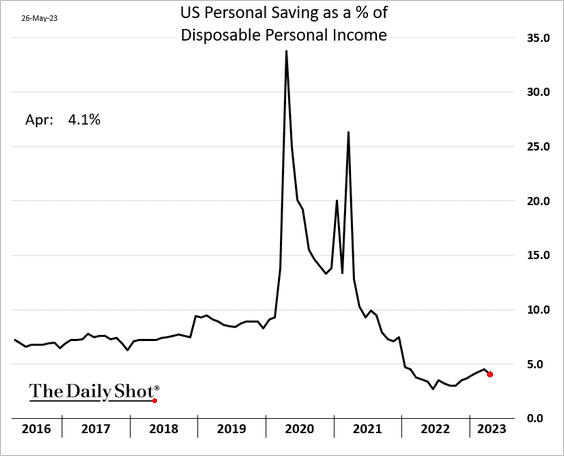
3. Personal savings declined last month.
——————–
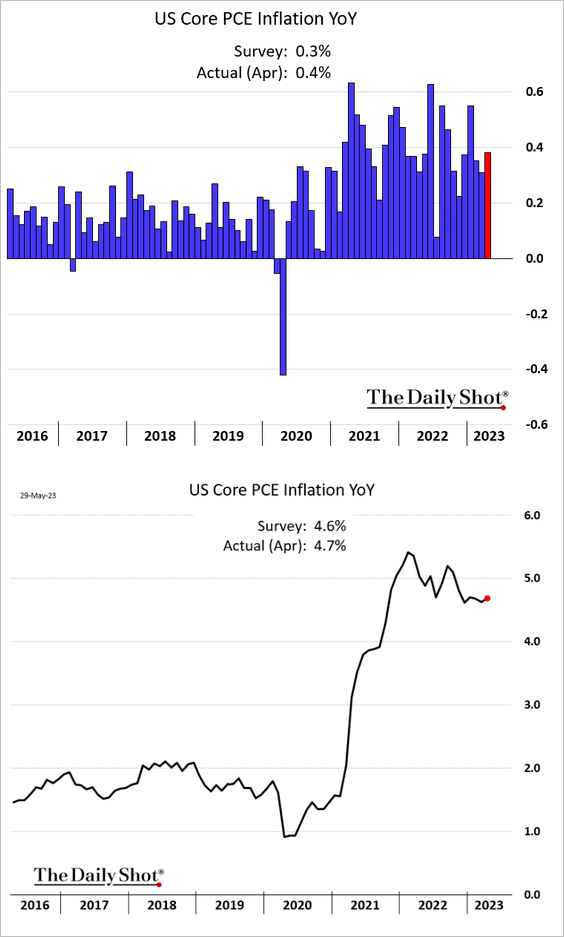
4. Inflation continues to run hot amid robust consumer demand. Here is the core PCE price index.
 Source: Barran’s Read full article
• The core PCE inflation is outpacing the FOMC’s forecasts.
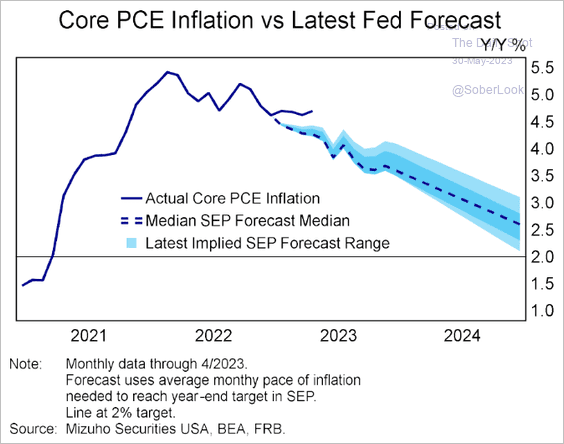 Source: Mizuho Securities USA
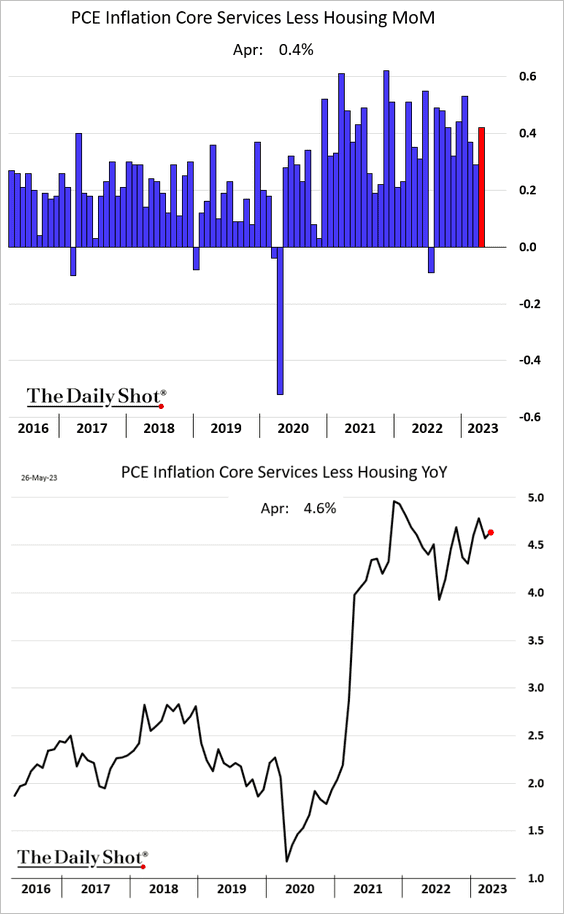
• Here is a look at the supercore PCE inflation, which is closely monitored by the Fed.
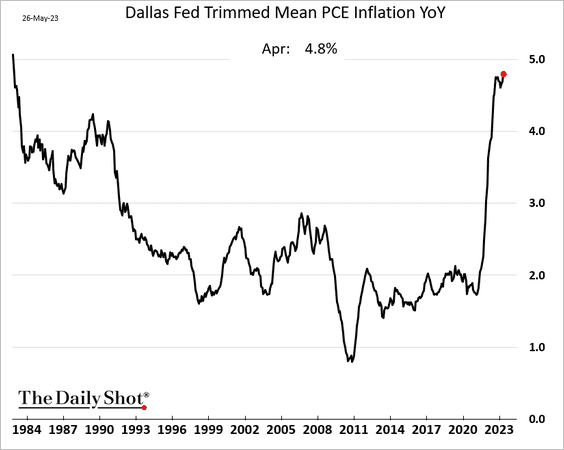
• The trimmed mean PCE inflation index hit the highest level since the 1980s (on a year-over-year basis).
• The diminishing pricing power of companies indicates an upcoming moderation in the core PCE.
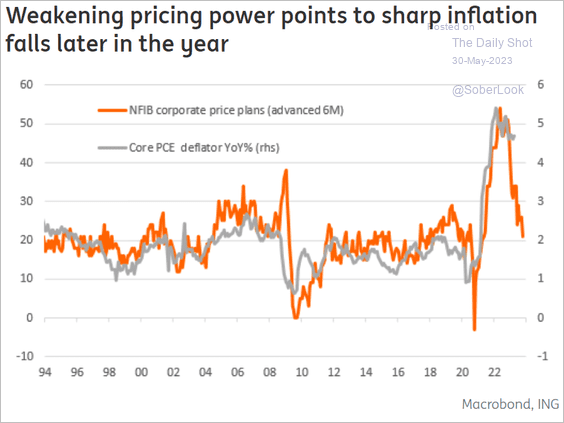 Source: ING
——————–
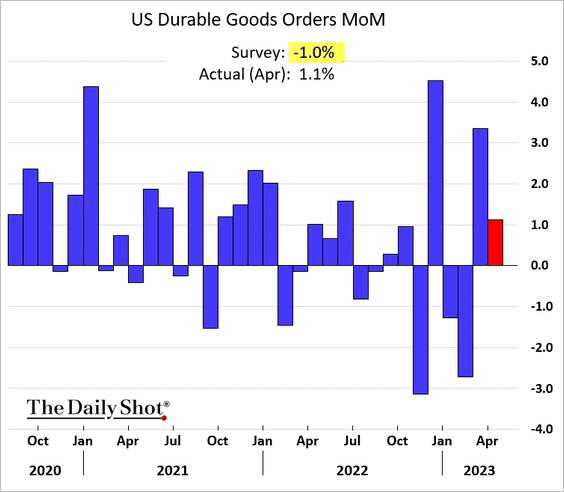
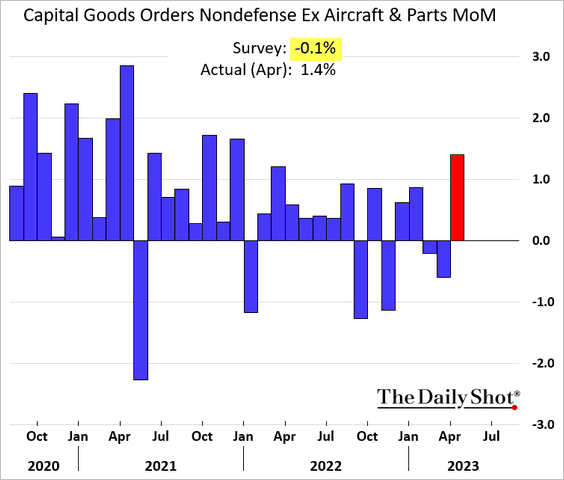
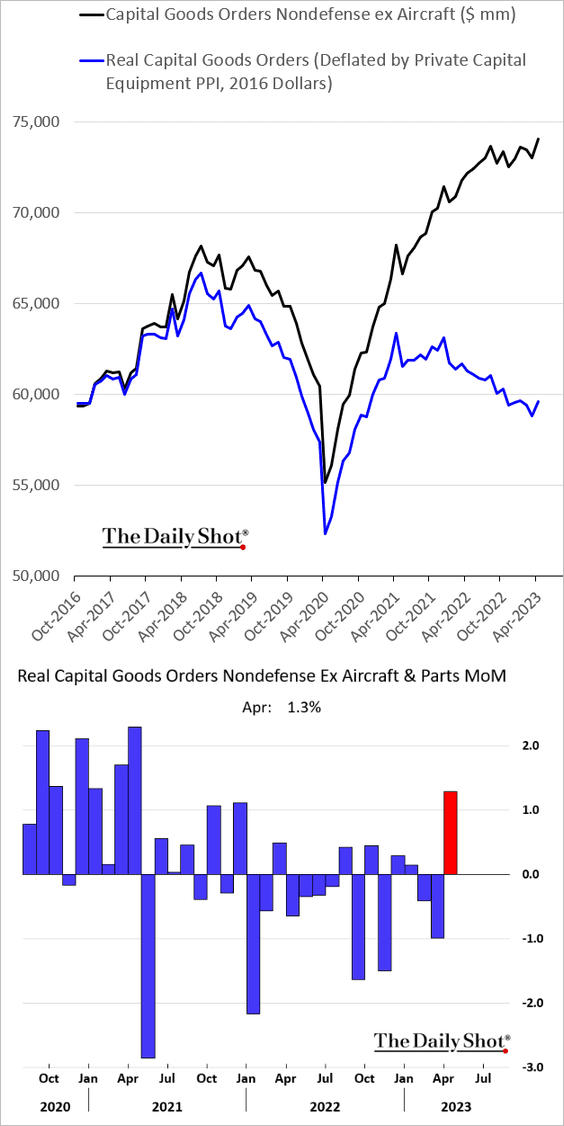
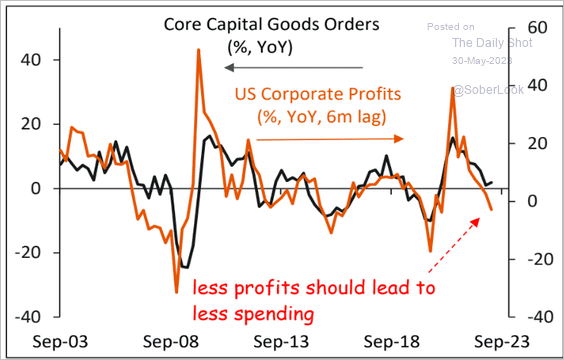
5. Durable goods orders also surprised to the upside.
• Capital goods orders jumped.
• This chart shows capital goods orders adjusted for inflation.
• Will softer corporate profits drag CapEx lower?
 Source: Piper Sandler
——————–
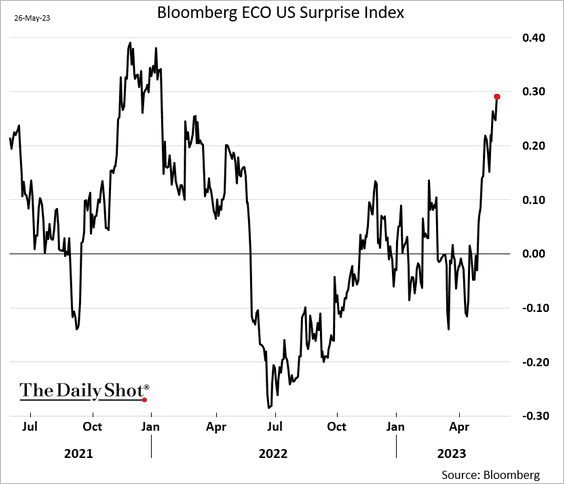
6. Bloomberg’s economic surprise index has been surging.
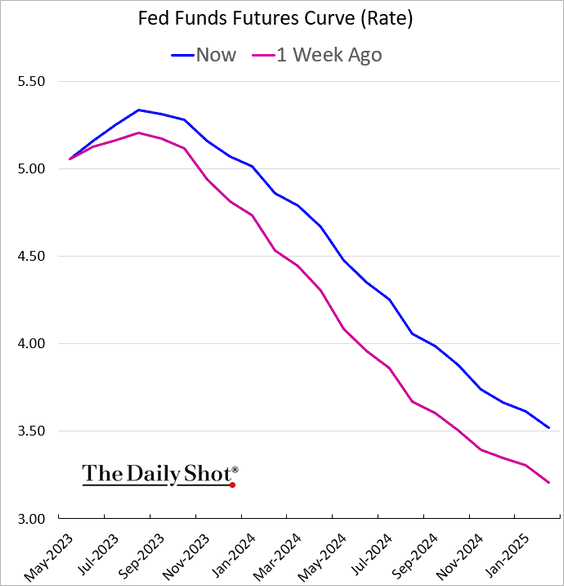
7. Robust consumption and sticky inflation boosted the probability of additional Fed rate hikes.
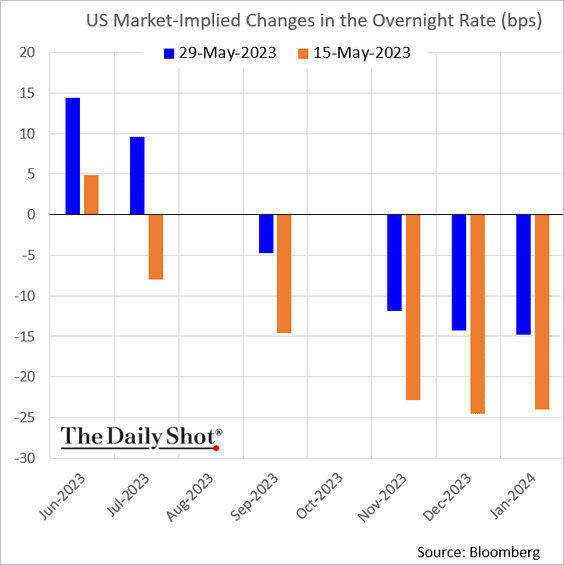
• The terminal rate has been rising. Here is the market-based fed funds rate trajectory.
• The Fed will be more patient before cutting rates as the labor market remains tight.
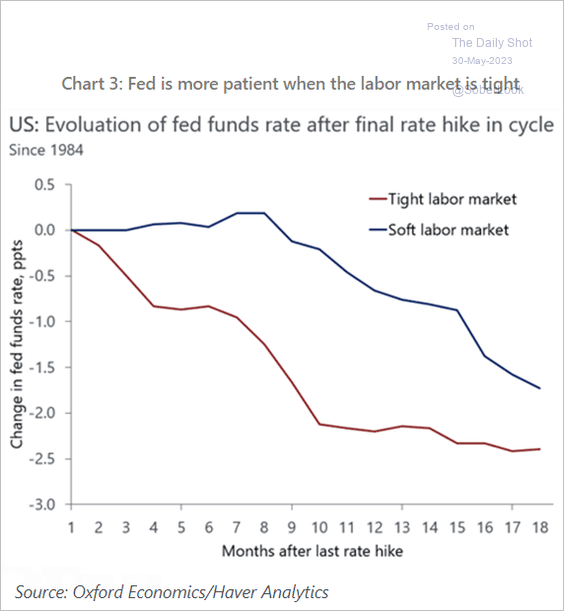 Source: Oxford Economics
——————–
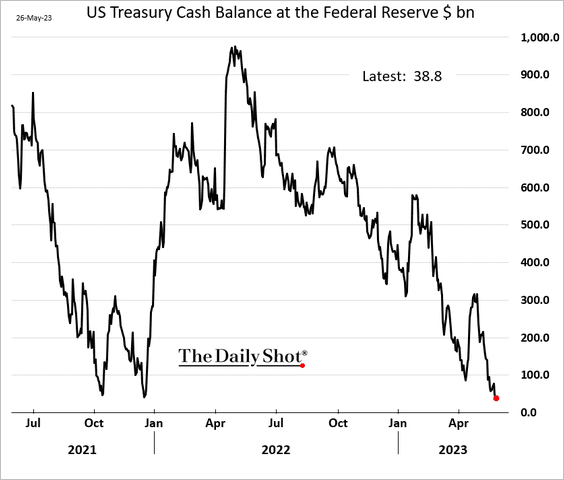
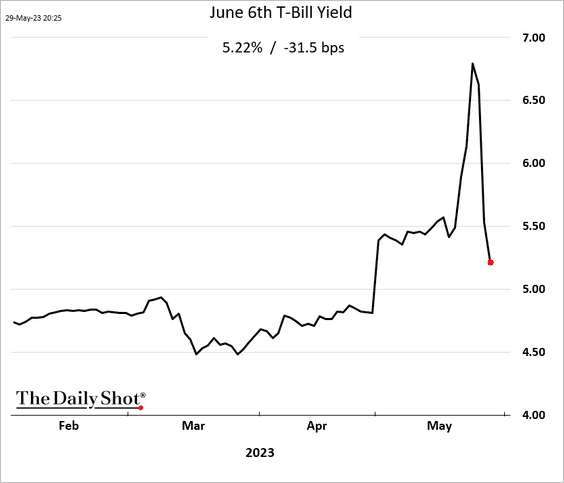
8. The debt ceiling battle moves to Congress.
 Source: CBS News Read full article
• The US Treasury’s cash balance continues to dwindle.
• The market’s confidence in the US avoiding default is growing. T-Bill yields are moving lower.
Back to Index
The United Kingdom
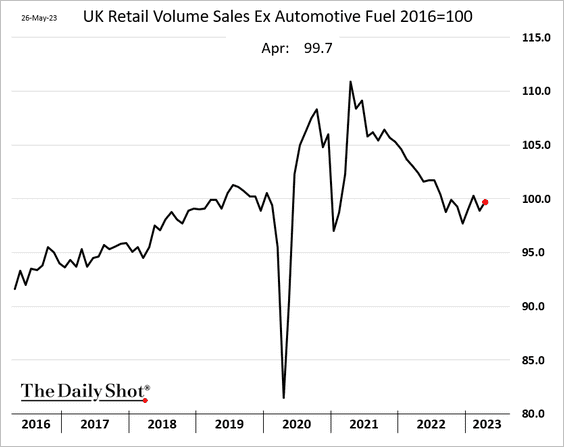
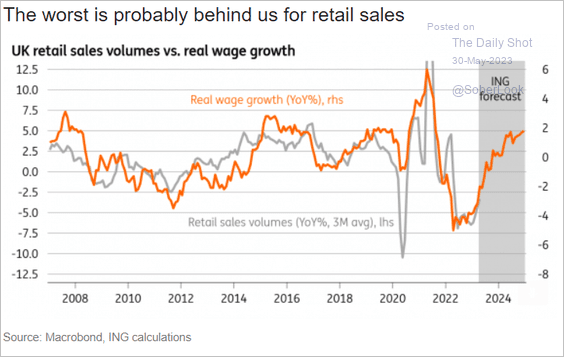
1. Retail sales appear to have bottomed.
 Source: @WSJ Read full article
Here is a forecast from ING.
 Source: ING
——————–
2. UK inflation continues to outpace price gains in the US and Eurozone.
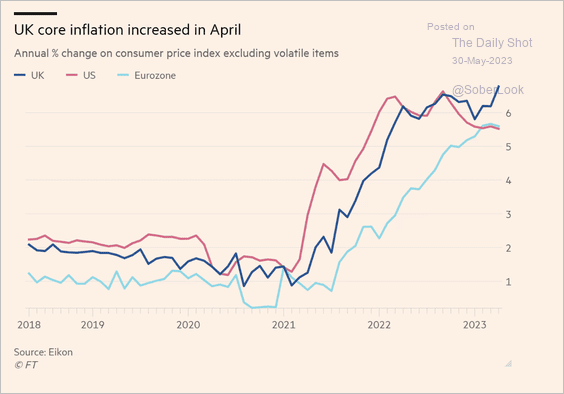 Source: @financialtimes Read full article
Back to Index
The Eurozone
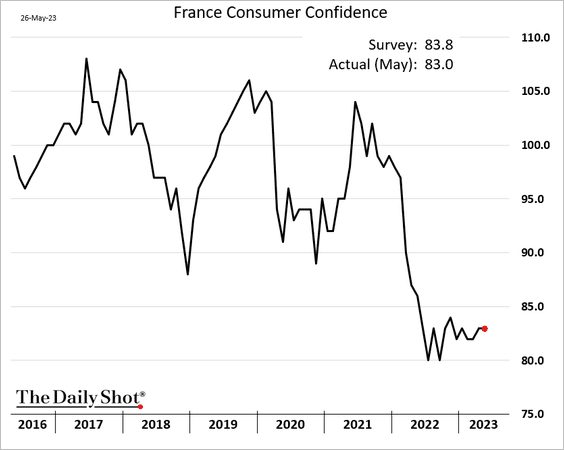
1. French consumer confidence remains depressed.
This year has witnessed immense protests in France.
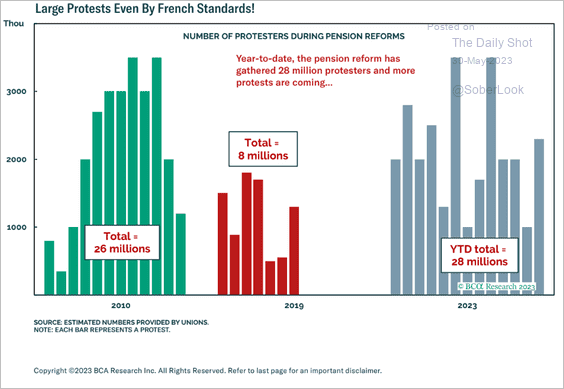 Source: BCA Research
• Deteriorating business surveys (see chart) point to downside risks for economic activity.
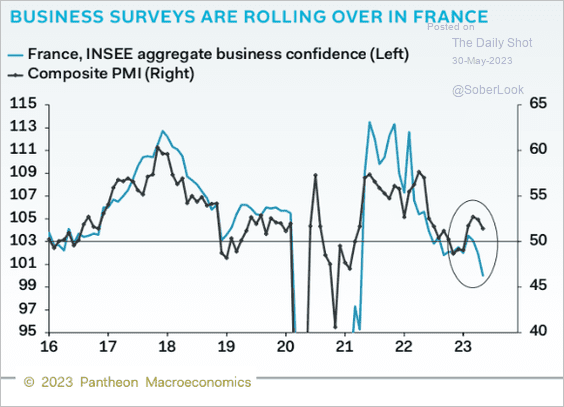 Source: Pantheon Macroeconomics
——————–
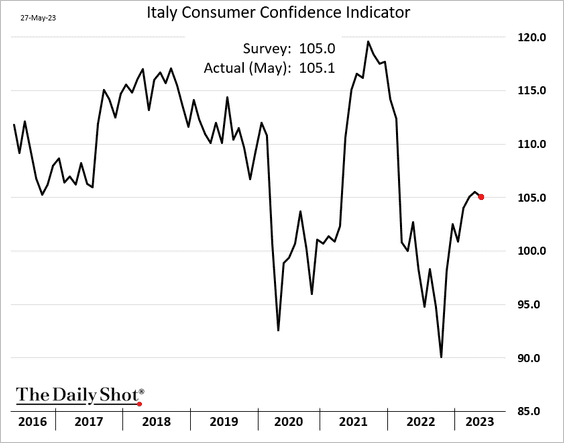
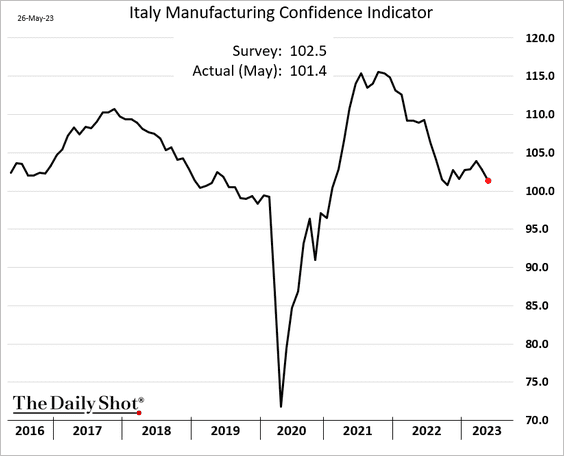
2. Italian sentiment indicators edged lower this month.
——————–
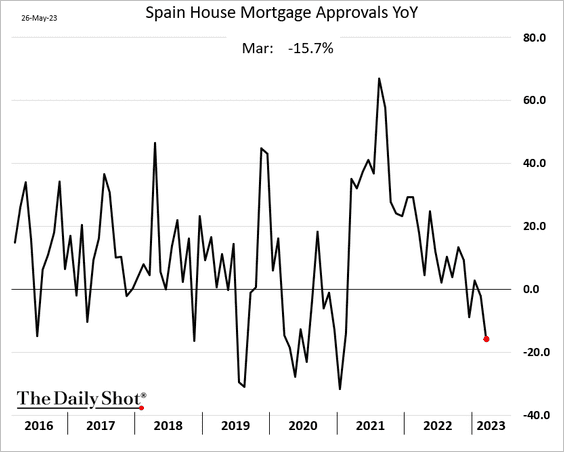
3. Spain’s mortgage applications hit the lowest level since early 2021.
Back to Index
Europe
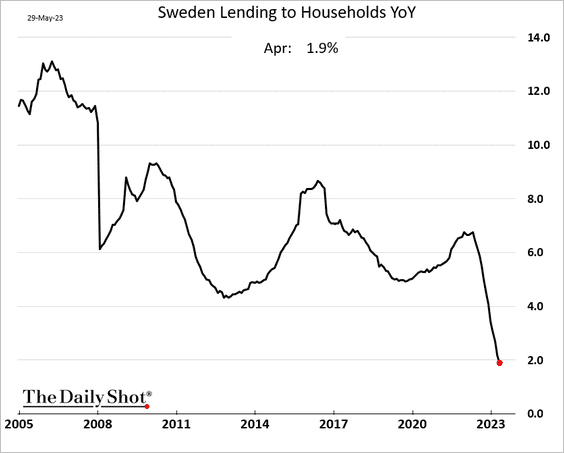
1. Swedish retail sales bounced from recent lows in April.
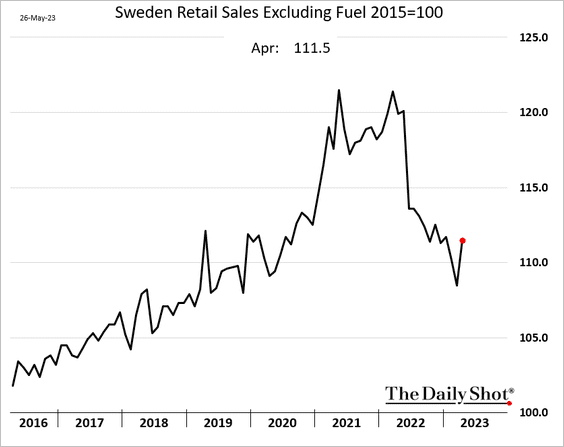
Lending to households continues to slow.
——————–
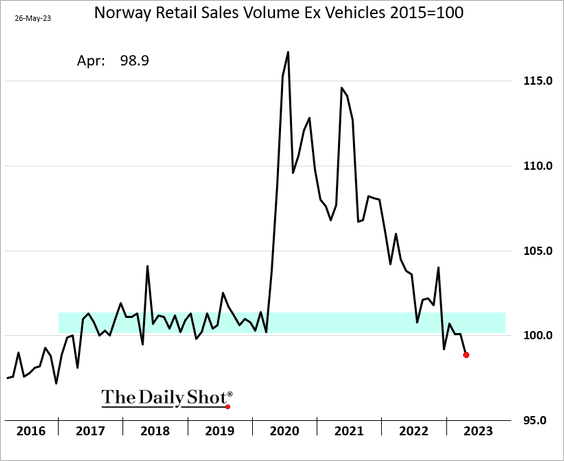
2. Norway’s retail sales dipped below pre-COVID levels.
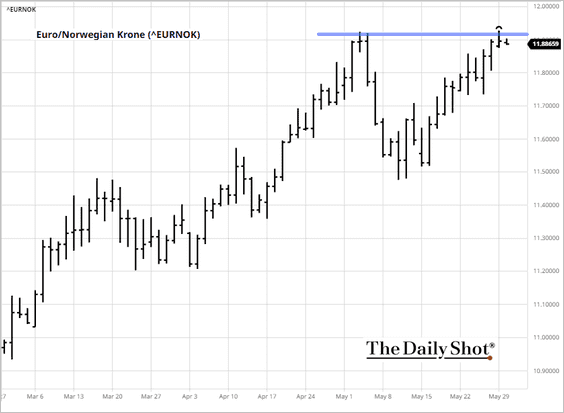
EUR/NOK is testing resistance as the krone remains under pressure.
 Source: barchart.com
——————–
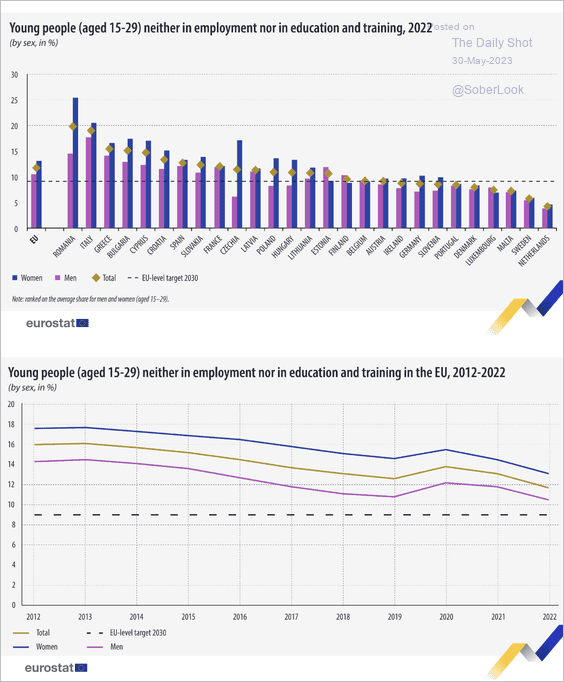
3. This chart shows the EU’s share of young people aged 15 to 29 who are “neither in employment nor education or training.”
 Source: Eurostat Read full article
Back to Index
Japan
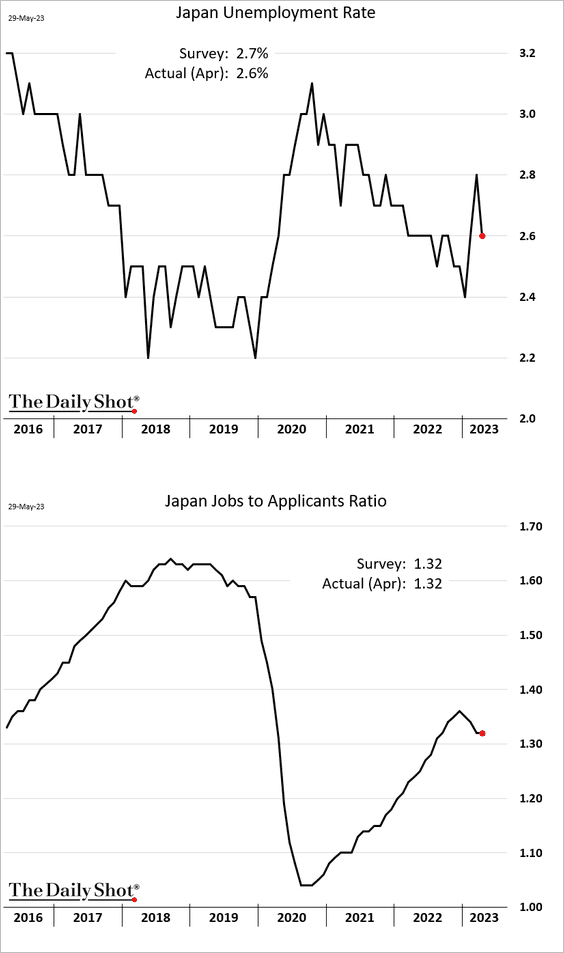
1. The unemployment rate dropped in April after surging in March.
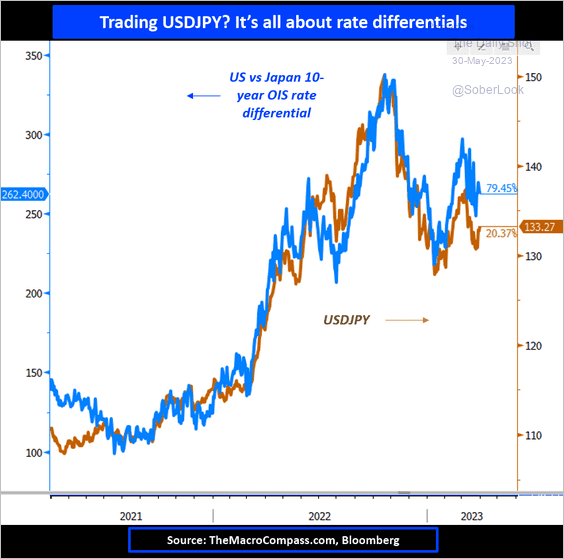
2. USD/JPY is highly correlated with the rate differential.
 Source: @MacroAlf
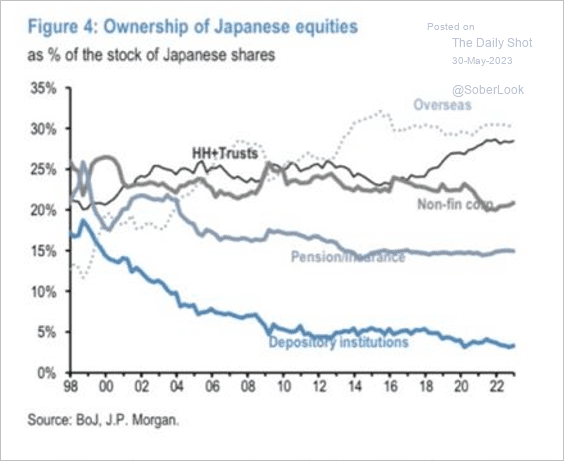
3. Who owns Japanese stocks?
 Source: JP Morgan Research
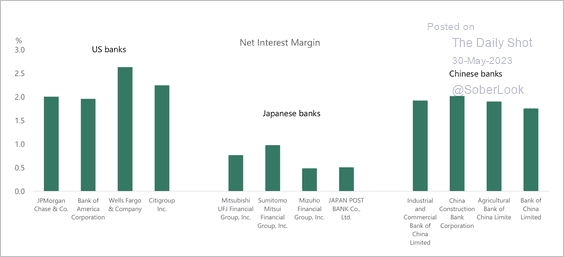
4. Banks’ net interest margins are lower compared with US and Chinese banks.
 Source: Torsten Slok, Apollo
Back to Index
Asia-Pacific
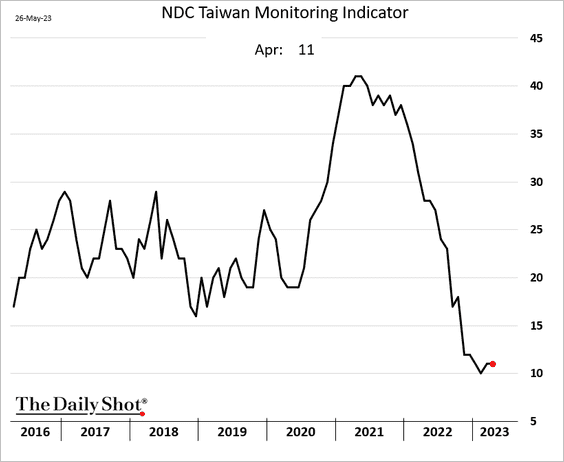
1. Taiwan’s index of economic activity remains depressed.
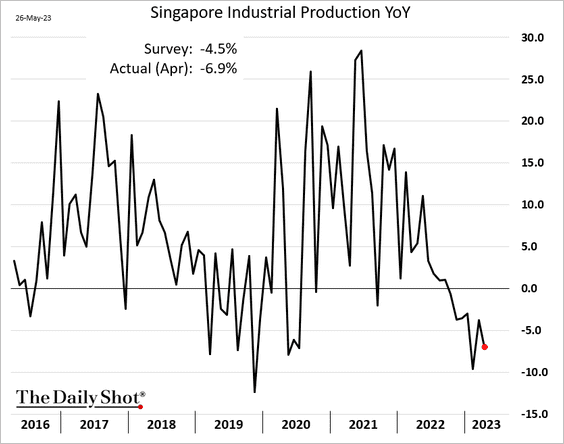
2. Singapore’s industrial production was below forecasts.
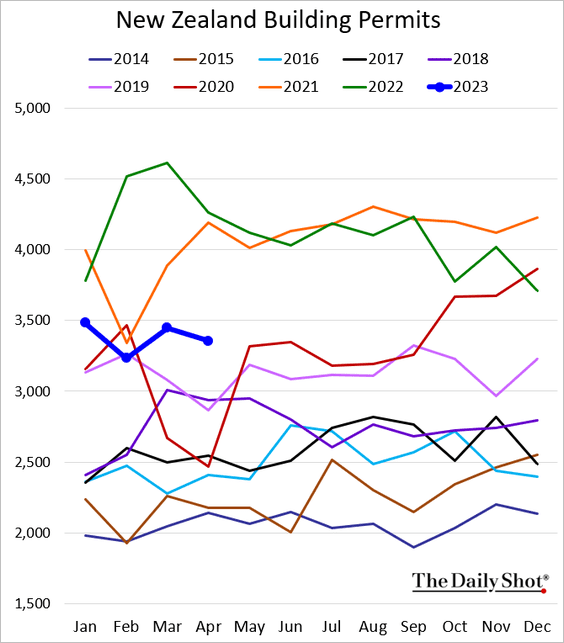
3. New Zealand’s building permits remain well below last year’s levels.
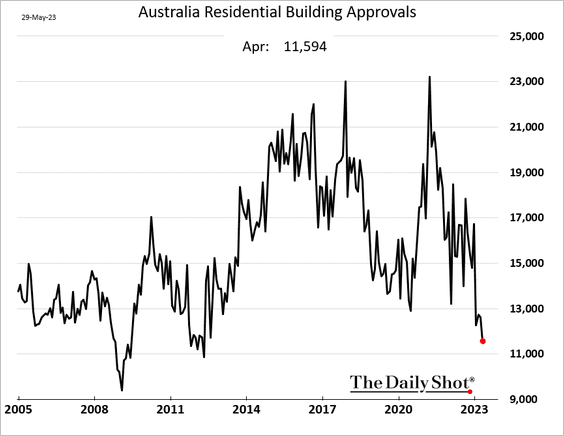
4. Australia’s building permits hit a multi-year low.
 Source: @Swatisays, @markets Read full article
Back to Index
China
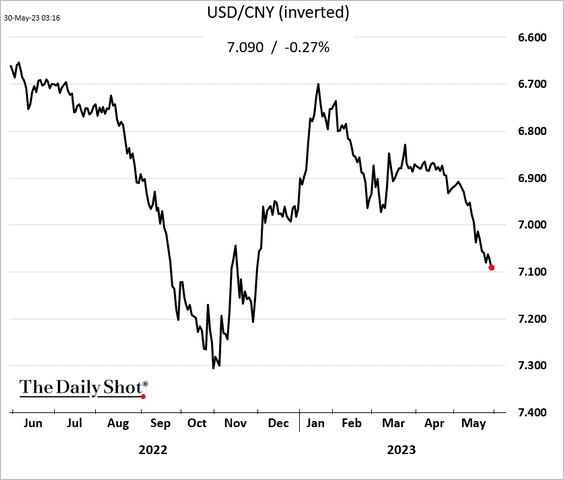
1. The renminbi continues to weaken against the dollar.
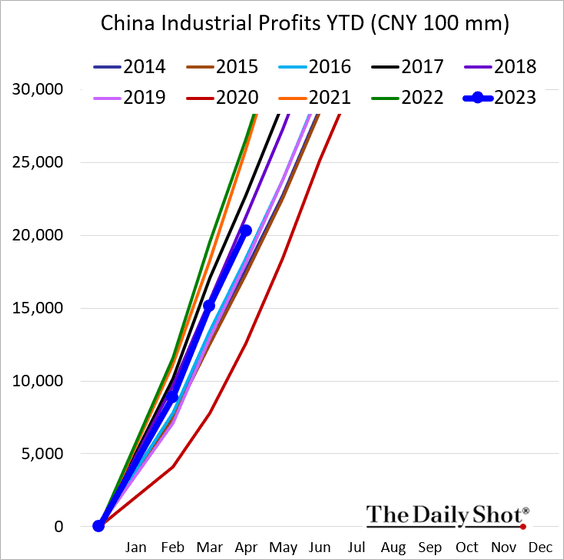
2. Industrial profits are running below 2018 levels.
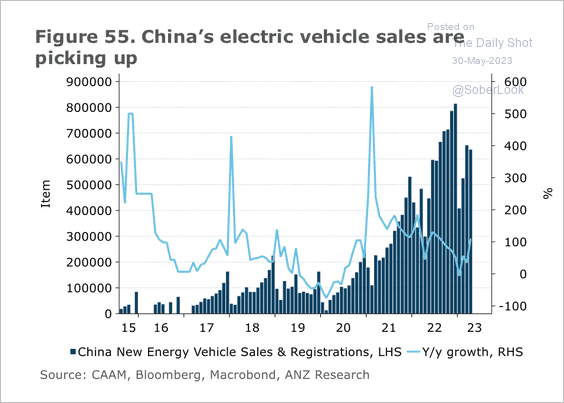
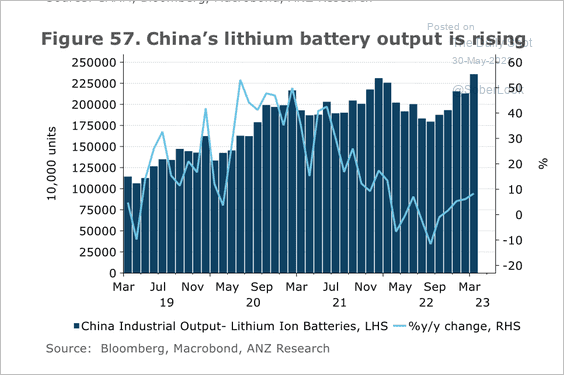
3. Electric vehicle sales and lithium battery output are rising. (2 charts)
 Source: @ANZ_Research
 Source: @ANZ_Research
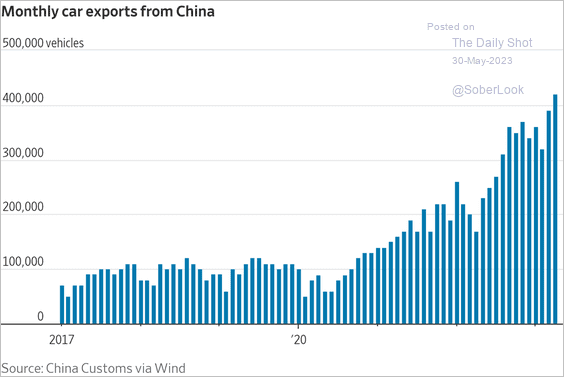
China’s car exports hit a new high.
 Source: @WSJ Read full article
——————–
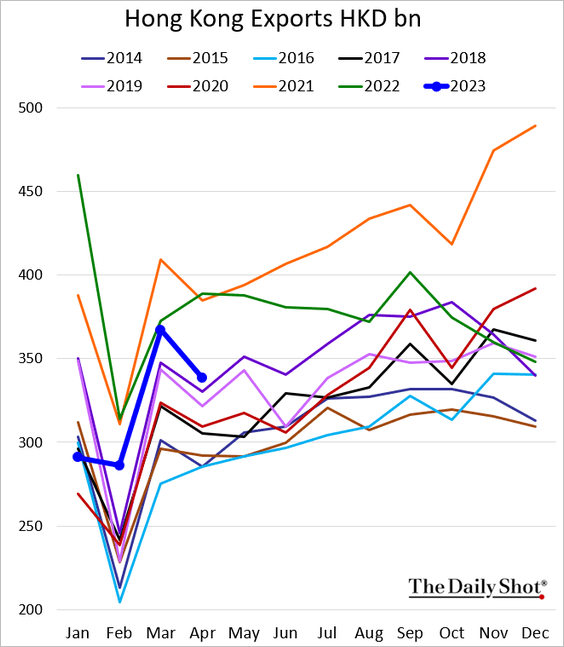
4. Hong Kong’s exports are down sharply vs. last year.
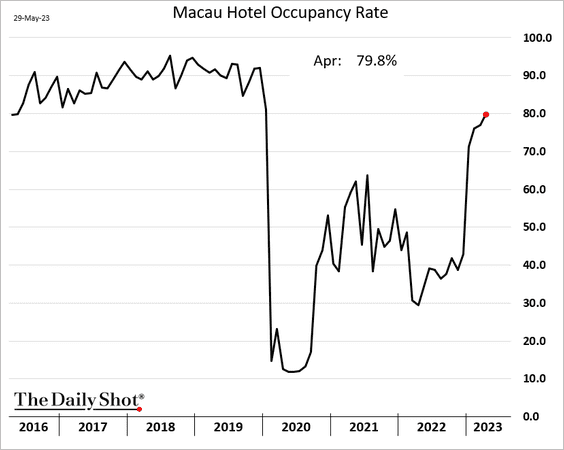
5. Macau’s hotel occupancy rate is rebounding.
Back to Index
Emerging Markets
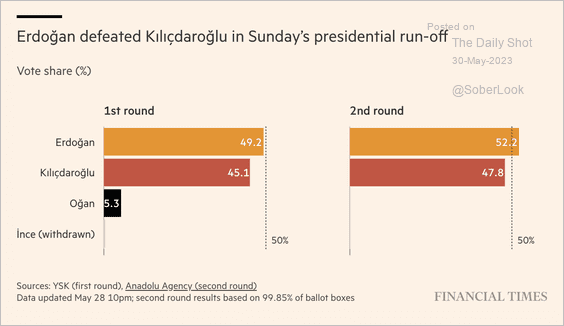
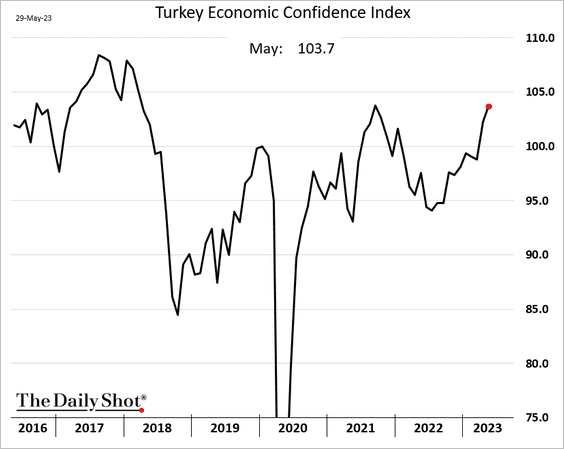
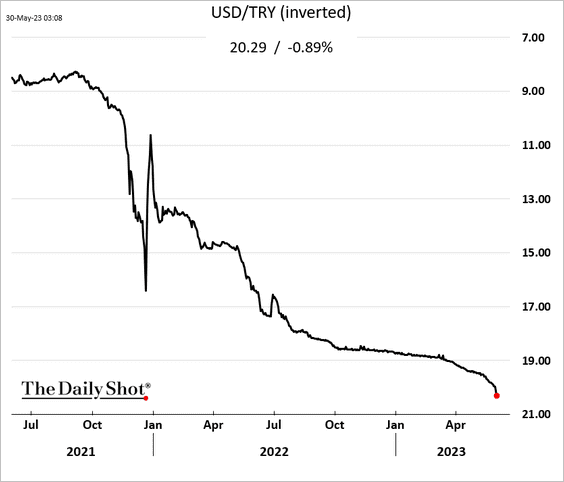
1. Let’s begin with Turkey.
• Election results:
 Source: @financialtimes Read full article
• The electoral map:
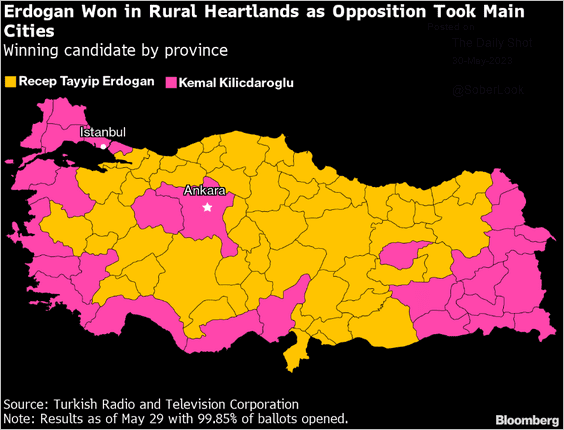 Source: @SelcanHacaoglu, @berilakman, @FiratKozok, @bpolitics Read full article
• Economic sentiment:
• FX reserves:
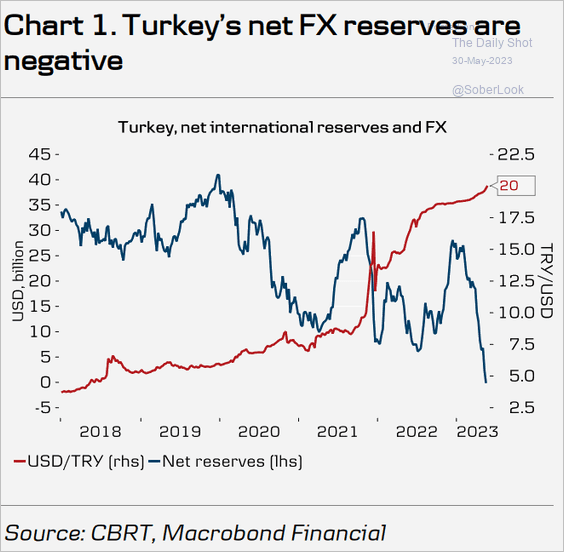 Source: Danske Bank
• The lira (record low):
——————–
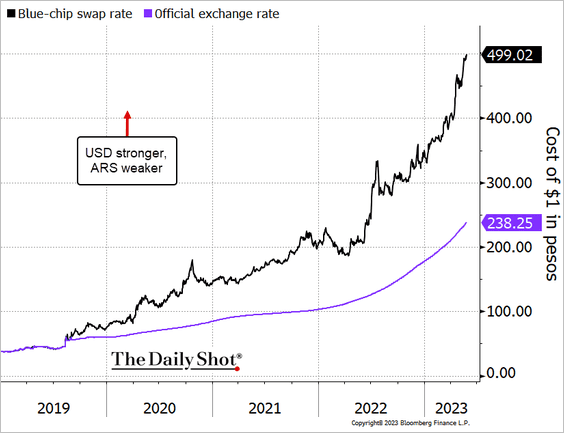
2. The gap between Arentina’s official and “blue-chip” exchange rates continues to widen.
3. CDS spreads and government bond rates have spiked in South Africa and Turkey. For other major emerging market economies, these rates have generally fallen since the beginning of the year.
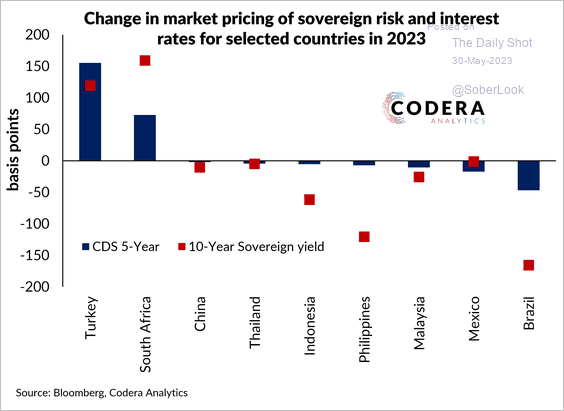 Source: Codera Analytics Read full article
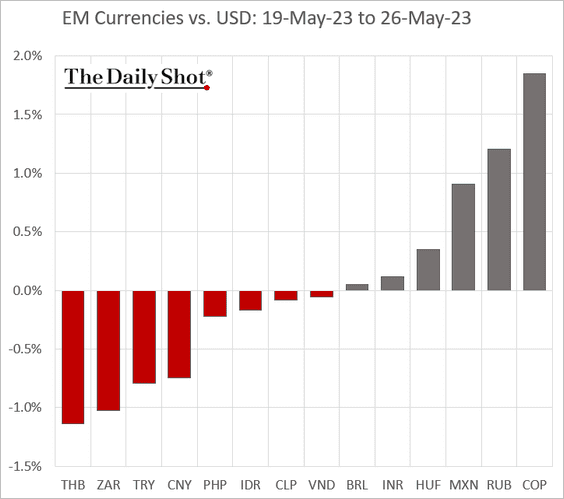
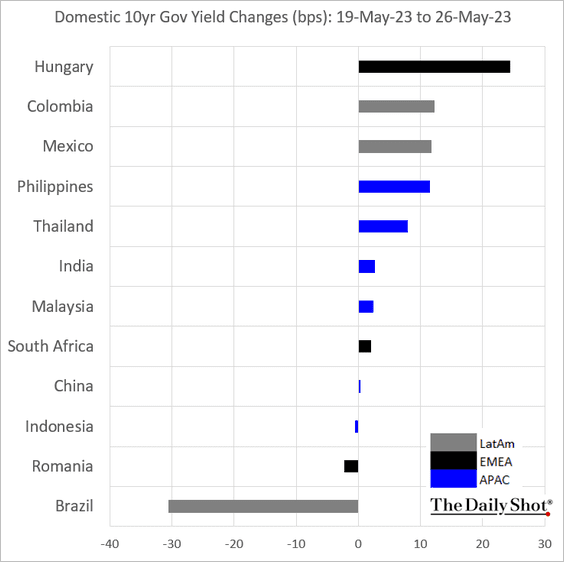
4. Next, we have last week’s performance data.
• Currencies:
• Bond yields:
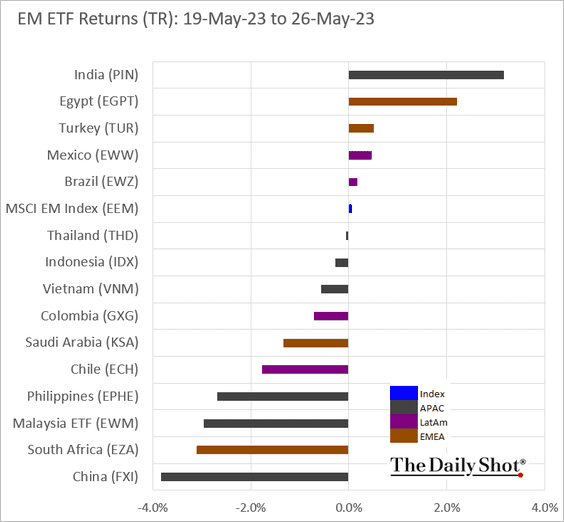
• Equity ETFs:
Back to Index
Commodities
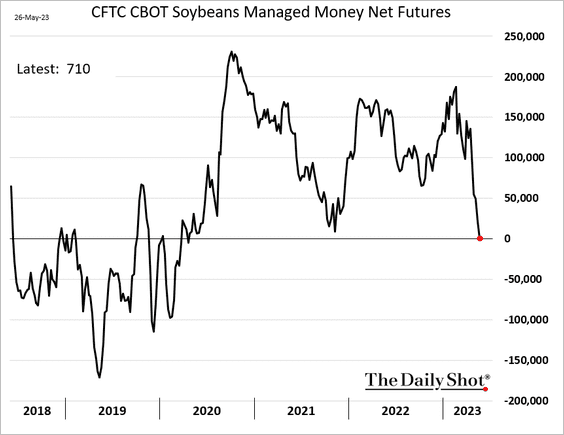
1. Funds have flattened their positioning in US soybean futures.
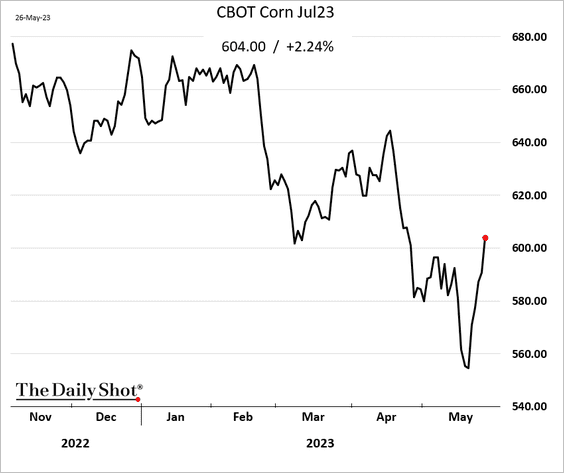
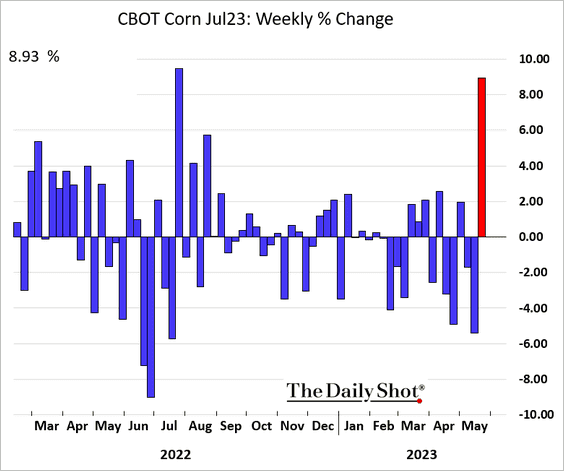
2. Dry conditions in the US pose a threat to the growth of newly planted corn crops, sending prices sharply higher.
——————–
3. Here is last week’s performance across key commodity markets.
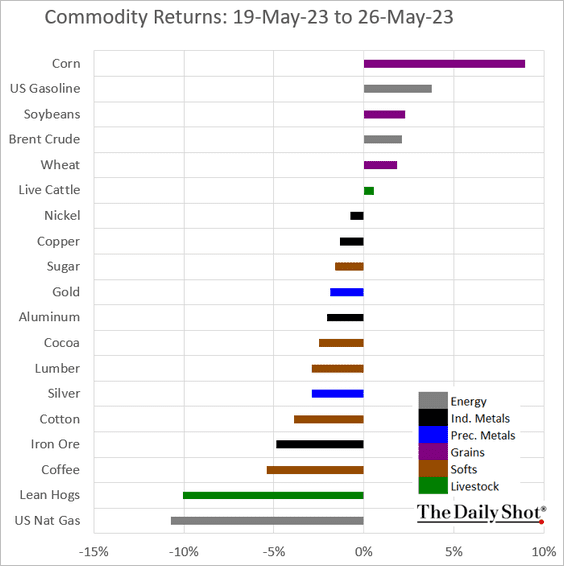
Back to Index
Energy
1. The August Brent contract is holding resistance at the 50-day moving average.
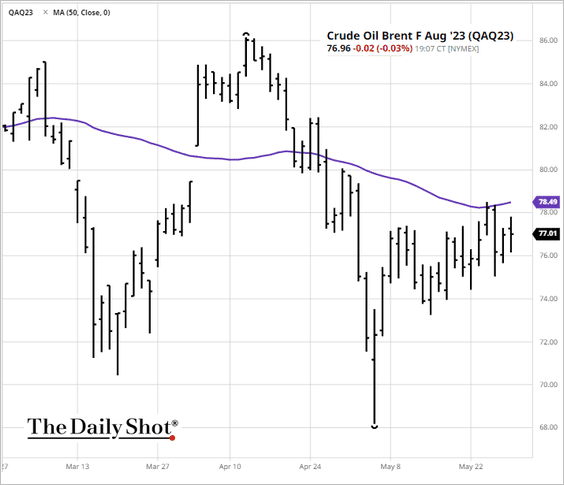 Source: barchart.com
2. Oil positioning has been bearish.
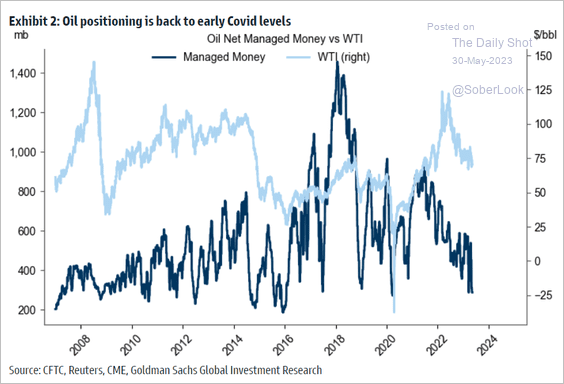 Source: Goldman Sachs
3. Crude oil prices (y-axis) are inversely correlated to short-term real rates (x-axis).
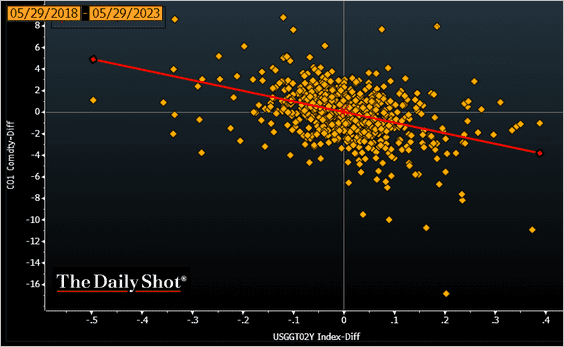 h/t @NoorAlAli, @TheTerminal, Bloomberg Finance L.P.
4. Uranium stocks are starting to outperform copper mining stocks.
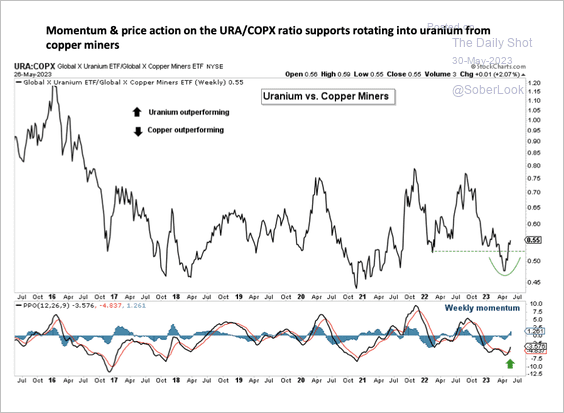 Source: Aazan Habib, Paradigm Capital
Back to Index
Equities
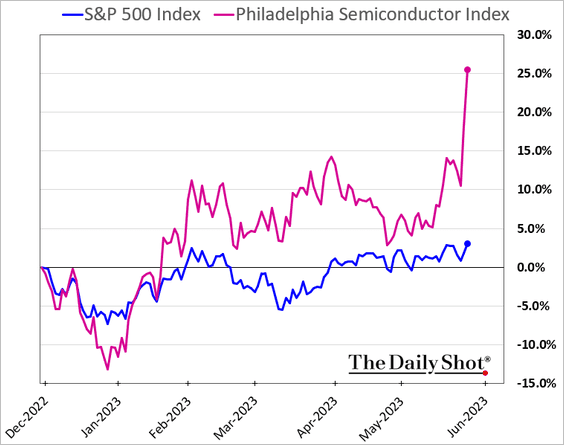
1. Semiconductor shares surged last week.
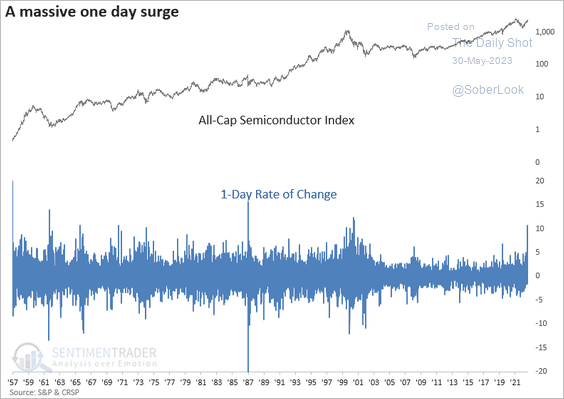 Source: SentimenTrader
Here is a look at US semiconductor stock valuations.
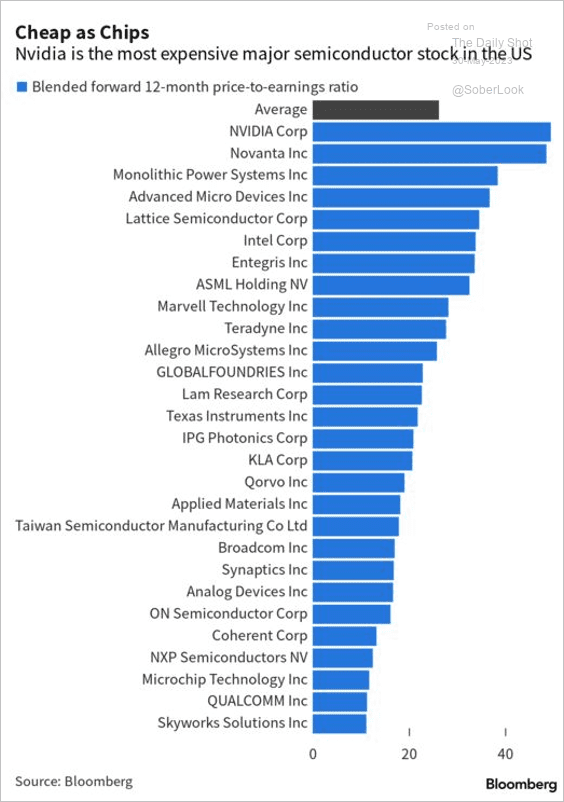 Source: @vladsavov, @debbywuintaipei, @technology Read full article
——————–
2. The Nasdaq 100 made a new 52-week high for the first time in nearly 18 months, which typically precedes further strength.
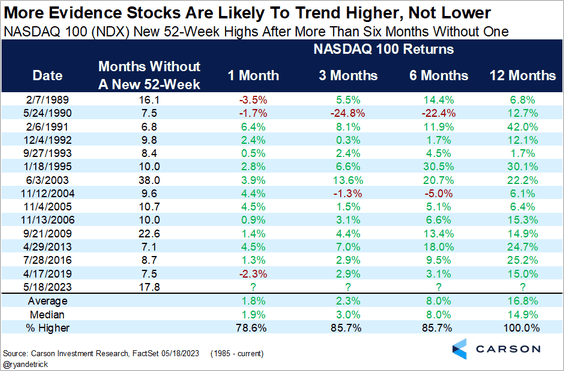 Source: @RyanDetrick
The Nasdaq 100 valuations have diverged from real rates.
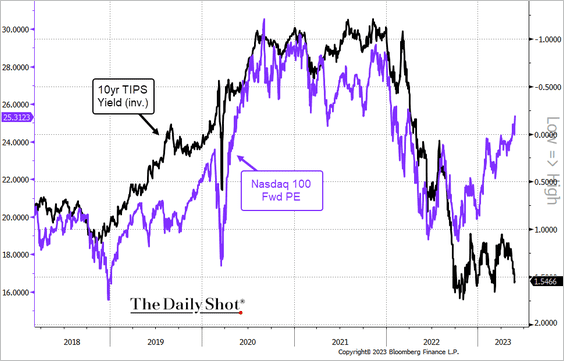 h/t @NoorAlAli, @TheTerminal, Bloomberg Finance L.P.
——————–
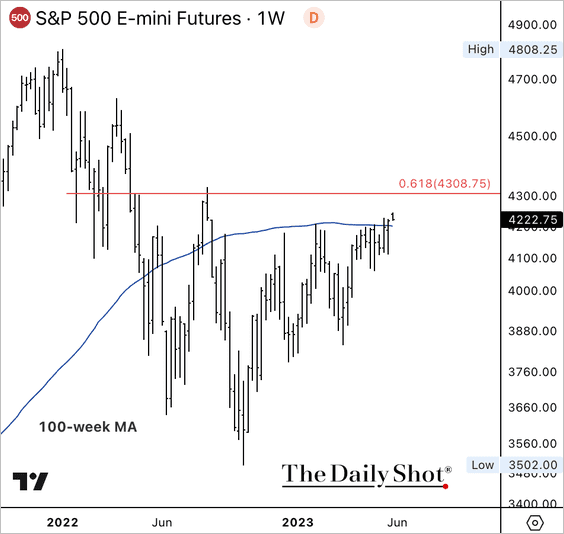
3. The S&P 500 broke above its 100-week moving average and reversed nearly half of its 2022 downtrend. Momentum is improving despite nearby resistance.
4. S&P 500 high-beta stocks are starting to outperform quality stocks.
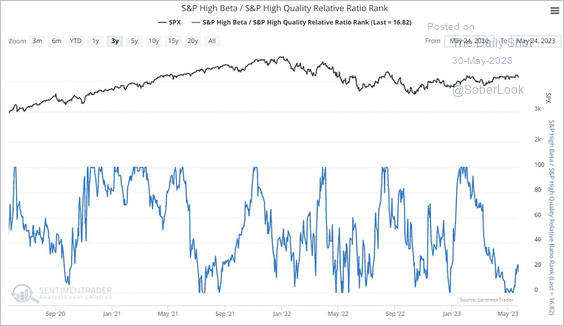 Source: SentimenTrader
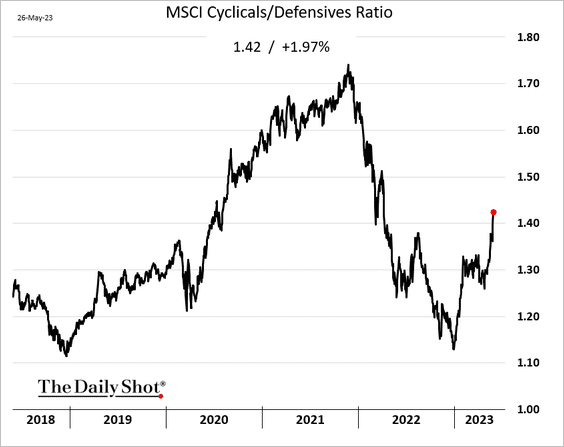
5. Cyclicals are surging relative to defensives.
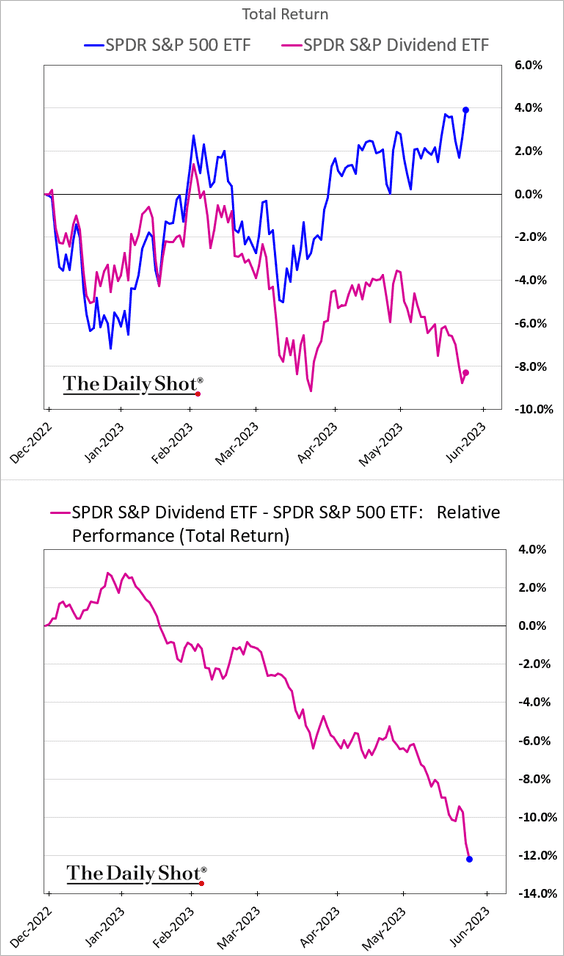
6. High-dividend stocks keep widening their underperformance.
7. So far, this is the largest annual outperformance between the S&P 500 and its equal-weight index since 1999 (2 charts).
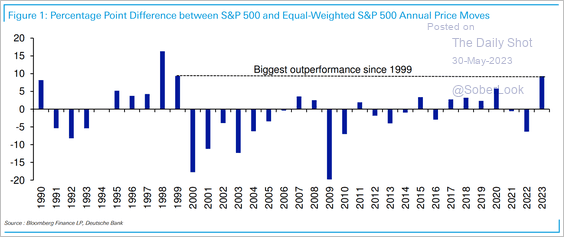 Source: Deutsche Bank Research
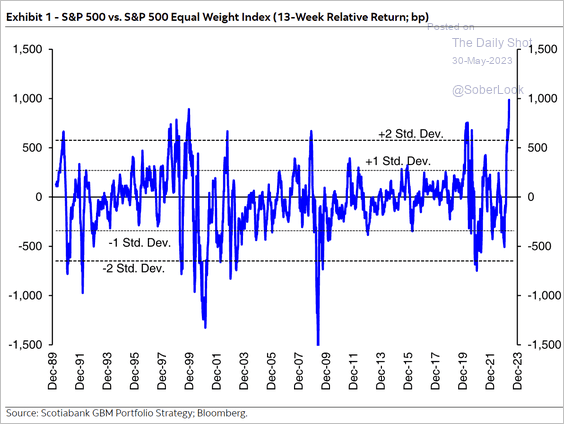 Source: Hugo Ste-Marie, Portfolio & Quantitative Strategy Global Equity Research, Scotia Capital
——————–
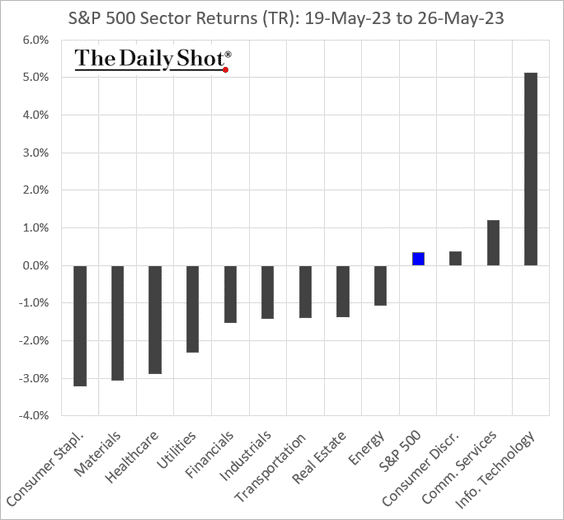
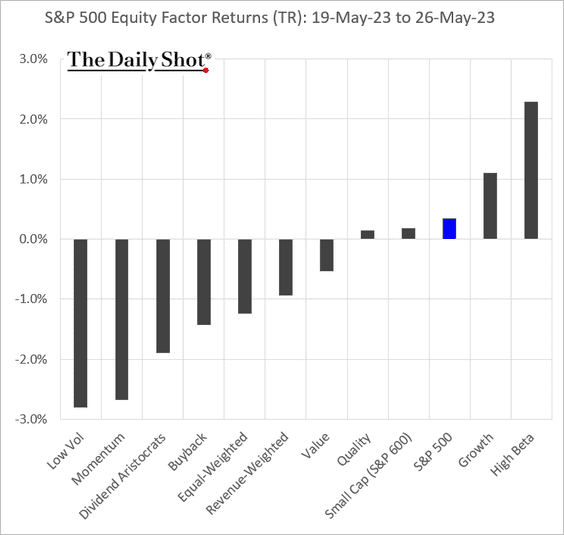
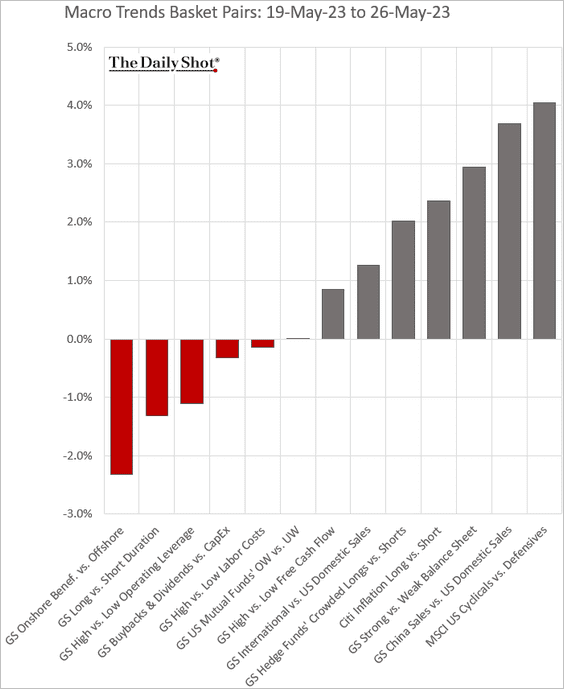
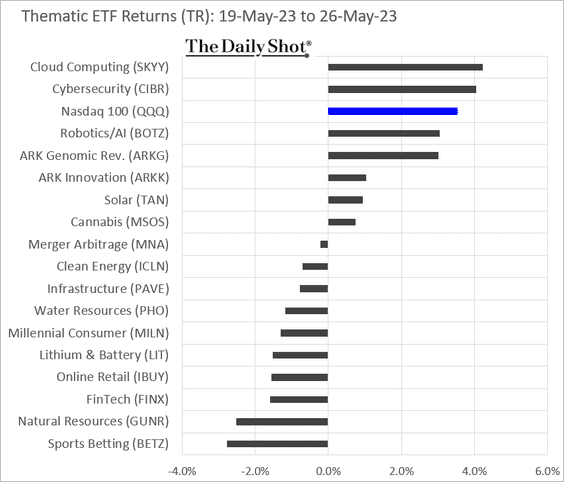
8. Next, we have some performance data from last week.
• Sectors:
• Equity factors:
• Macro basket pairs’ relative performance:
• Thematic ETFs:
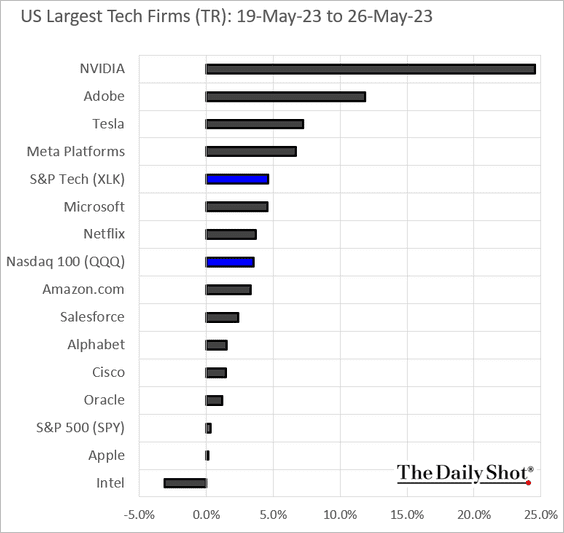
• Largest US tech firms:
Back to Index
Credit
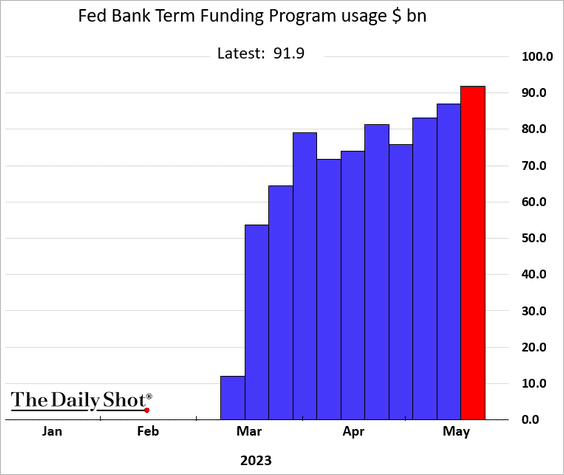
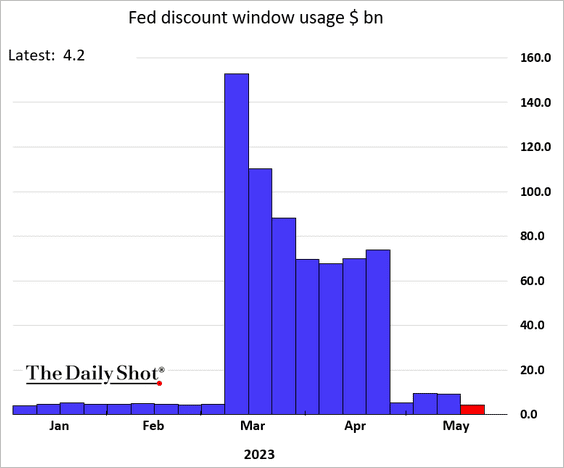
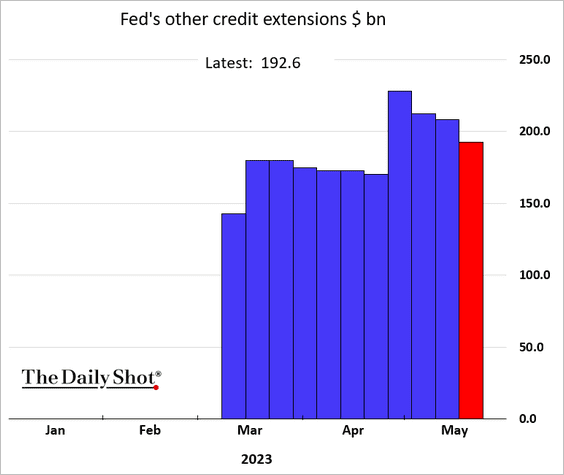
1. Let’s start with some data on the Fed’s emergency facilities for banks.
• BTFP:
• The discount window:
• “Other” credit extensions:
• Total credit support for banks:
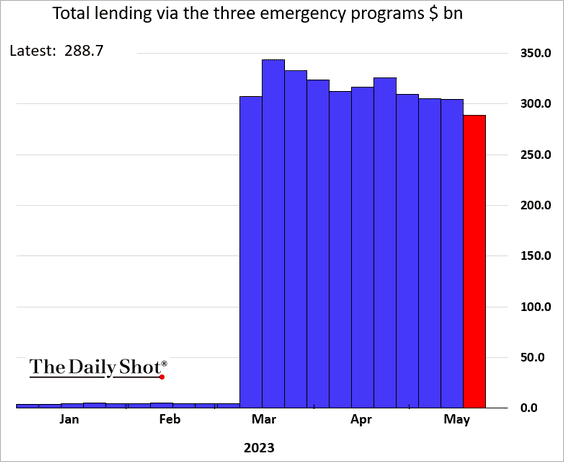
 Source: Reuters Read full article
——————–
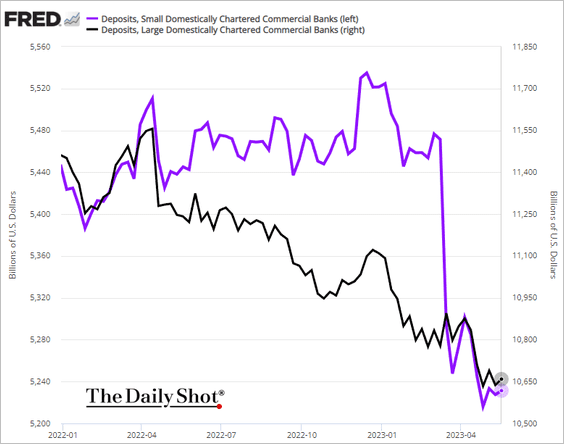
2. Bank deposits edged higher.
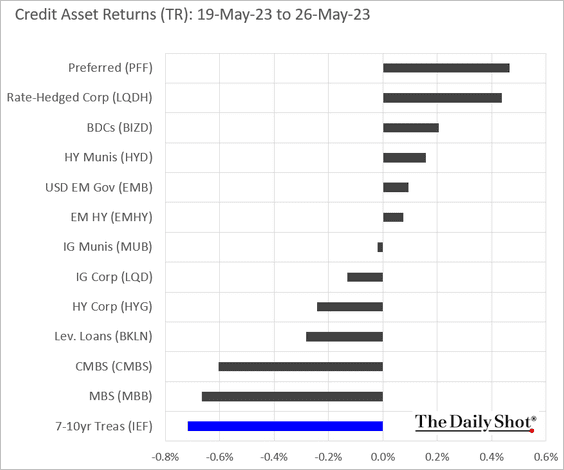
3. Here is last week’s performance by asset class.
Back to Index
Rates
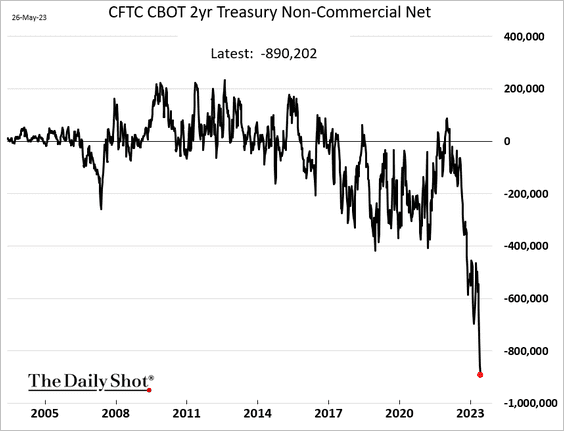
1. Speculative accounts continue to boost their bets against the 2-year Treasury note futures (betting on higher short-term yields).
2. Long-dated Treasury futures jumped as the debt ceiling deal is viewed as more fiscally restrictive.
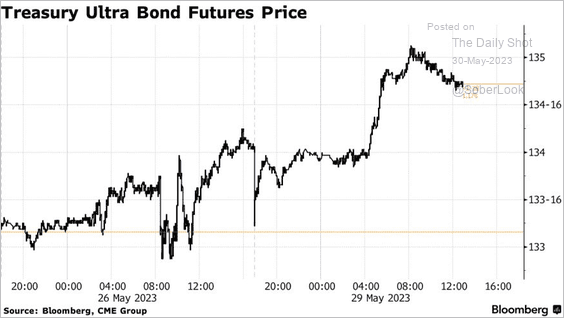 Source: @beth_stanton, @markets Read full article
Back to Index
Global Developments
1. Here is a look at last week’s currency futures positioning.
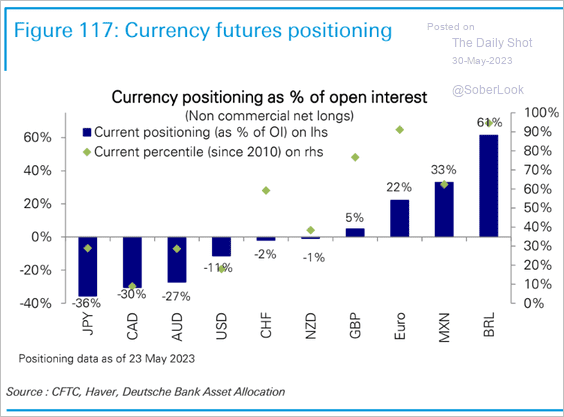 Source: Deutsche Bank Research
2. Globalization is facing mounting challenges.
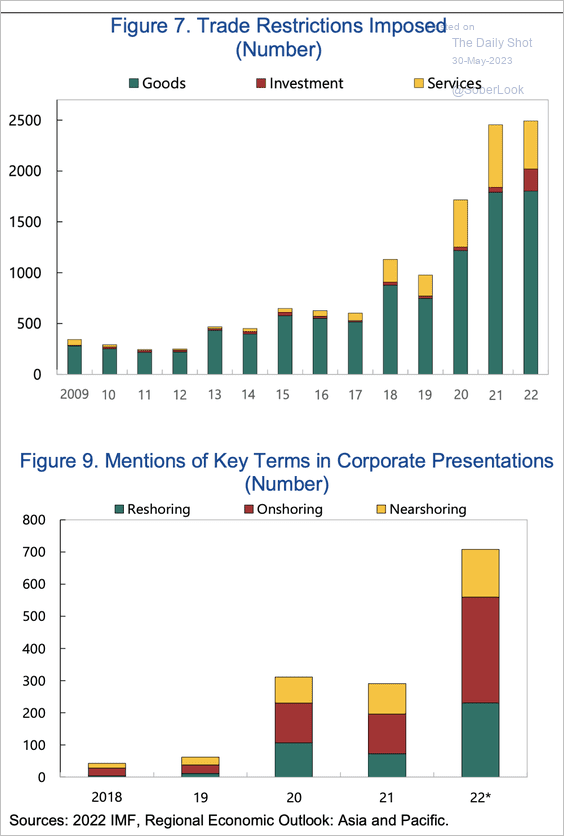 Source: IMF Read full article
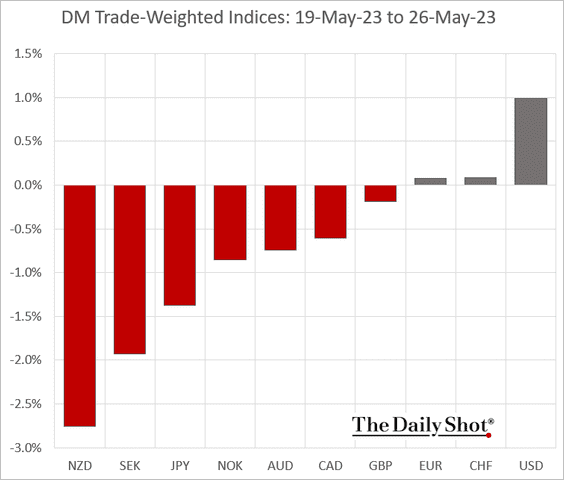
3. Next, we have some DM performance data from last week.
• Trade-weighted currency indices:
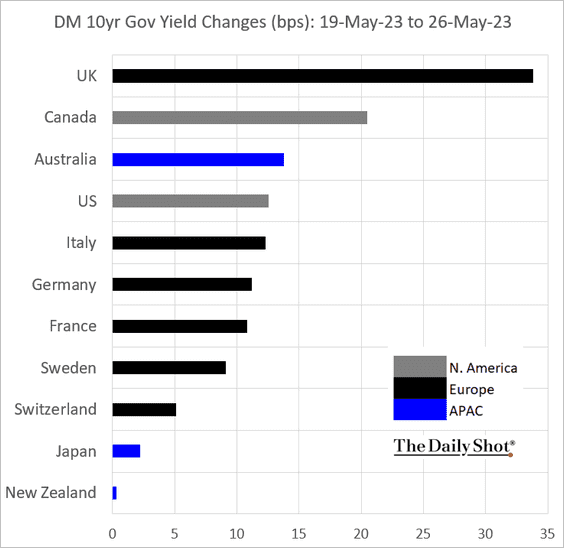
• Bond yields:
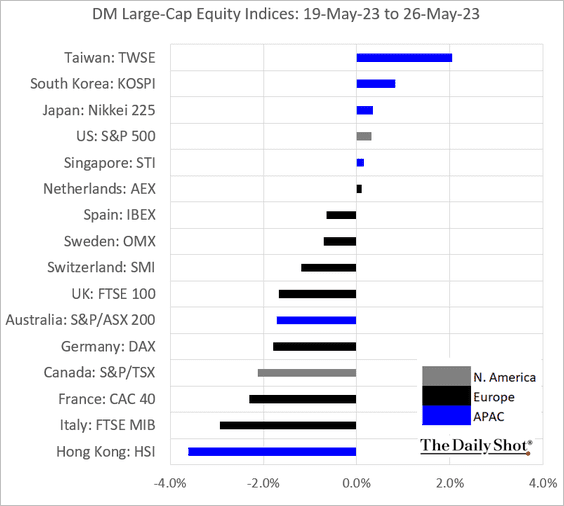
• Large-cap equity indices:
——————–
Food for Thought
1. Ten-year performance of select US stocks:
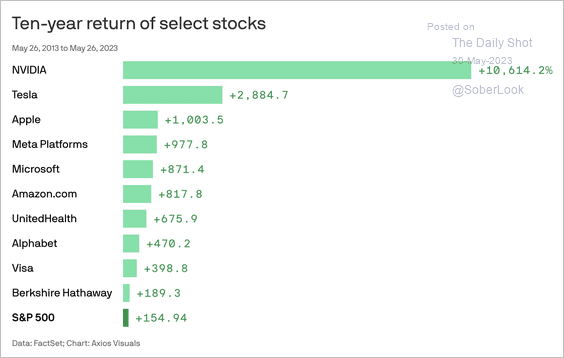 Source: @axios Read full article
2. Companies citing “AI” on earnings calls:
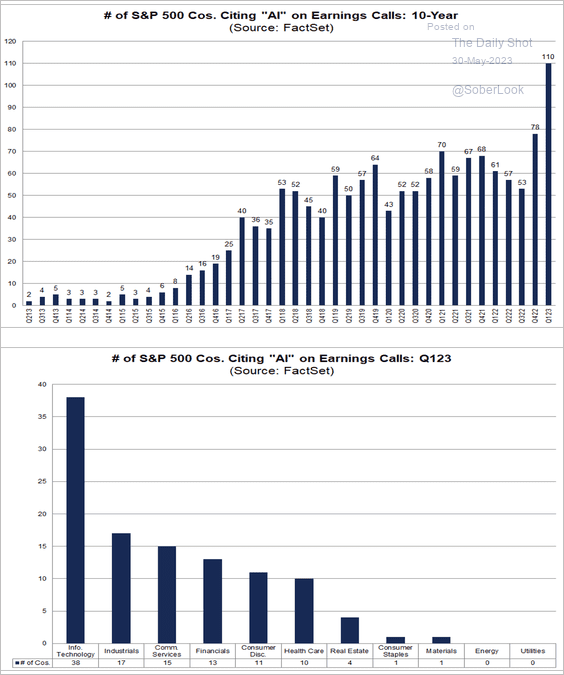 Source: @FactSet Read full article
3. Athletic brand preferences:
 Source: @CivicScience Read full article
4. Car dealers contributing to inflation:
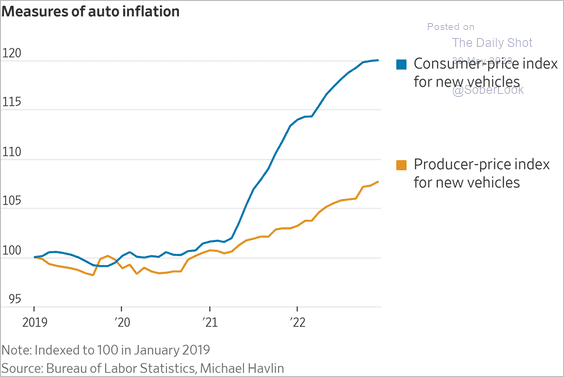 Source: @WSJ Read full article
5. Dell shifting production to Vietnam:
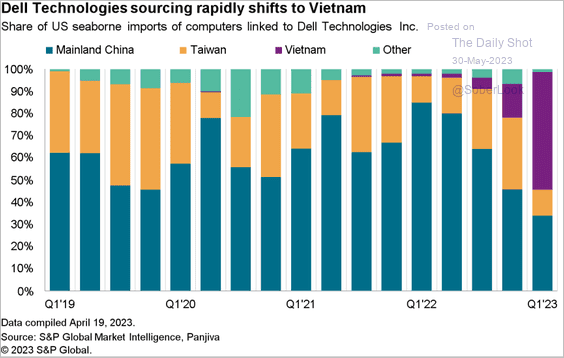 Source: S&P Global Market Intelligence
6. Global commercial flights:
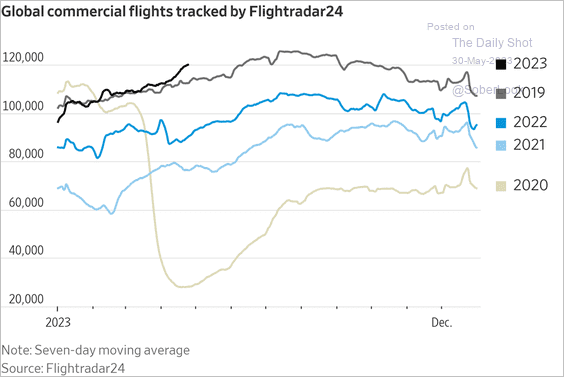 Source: @WSJ Read full article
7. Vasectomies on the rise:
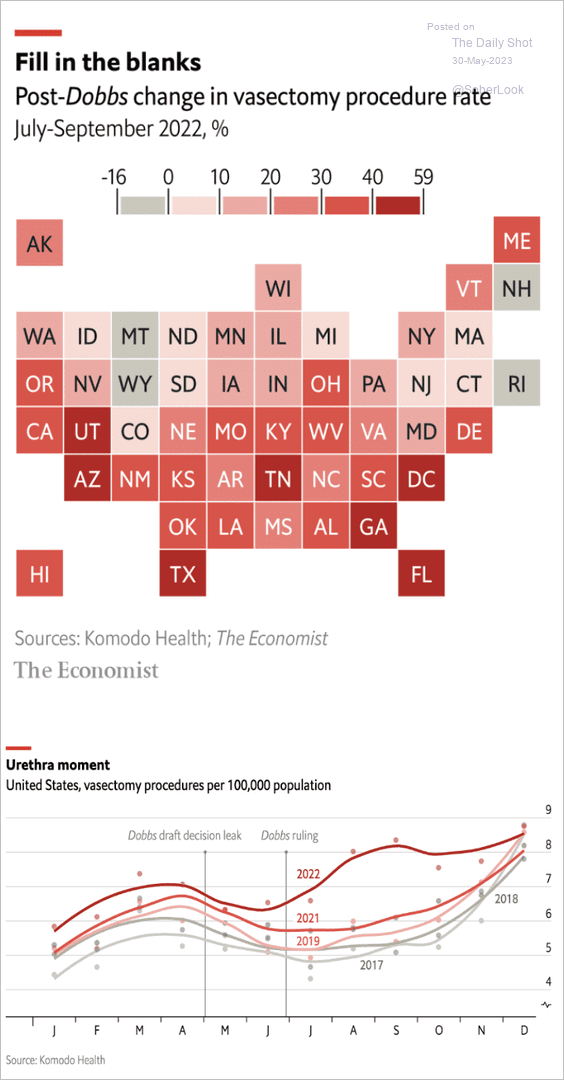 Source: The Economist Read full article
8. Attacks on media workers in Mexico:
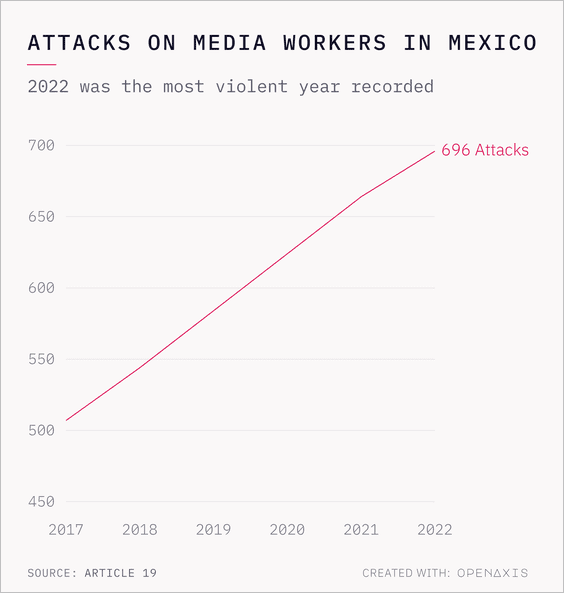 Source: @TheDailyShot
9. Tipping in restaurants:
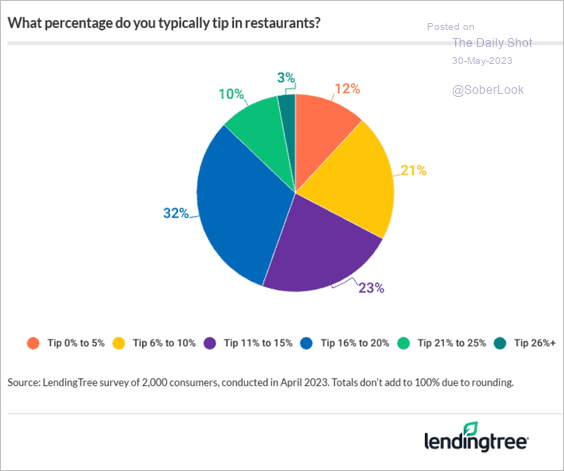 Source: LendingTree Read full article
——————–
Back to Index