
The Daily Shot: 14-Feb-24
• The United States
• Canada
• The United Kingdom
• The Eurozone
• Europe
• Japan
• Emerging Markets
• Commodities
• Energy
• Equities
• Credit
• Rates
• Global Developments
• Food for Thought
The United States
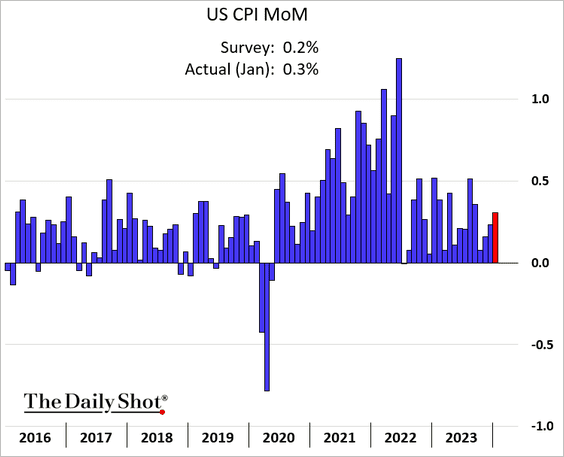
1. The January CPI report exceeded forecasts, indicating a bumpy path toward the Fed’s 2% target.
• Food price gains intensified.
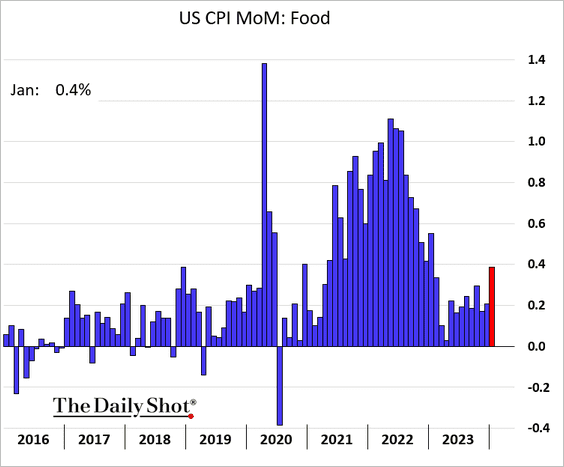
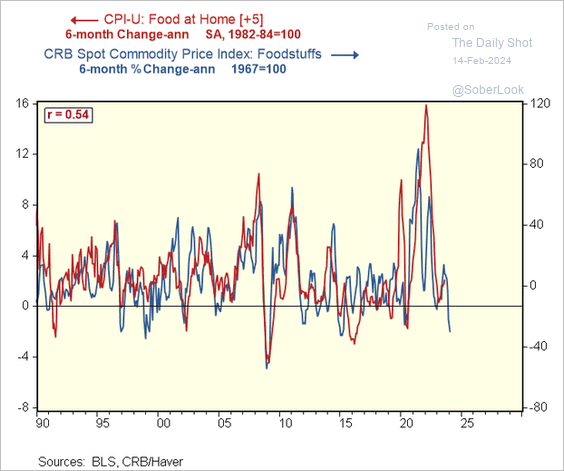
– Given softer agricultural commodity prices, will we see moderating food inflation later this year?
 Source: @RenMacLLC
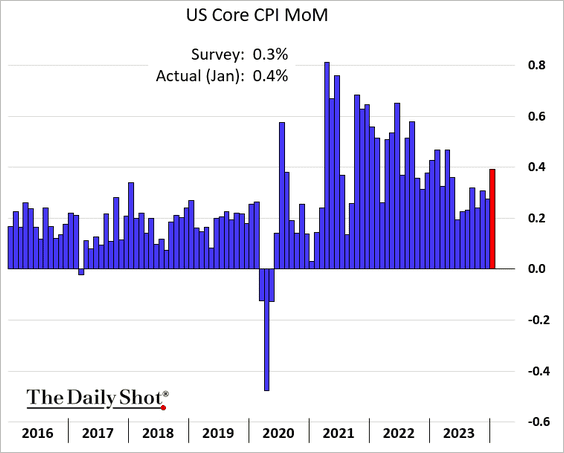
• Core inflation accelerated (2 charts).
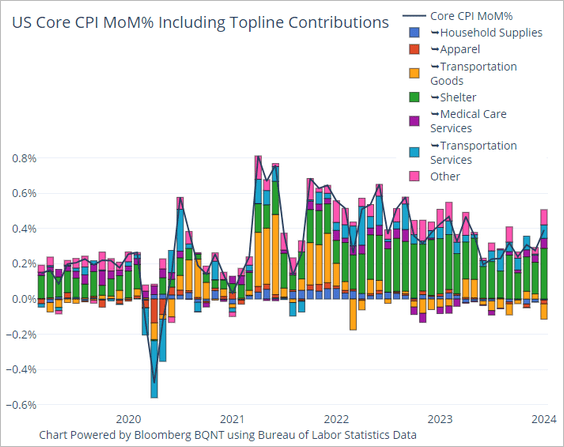 Source: @TheTerminal, Bloomberg Finance L.P.
• The supercore CPI (core services ex housing) surged in January.
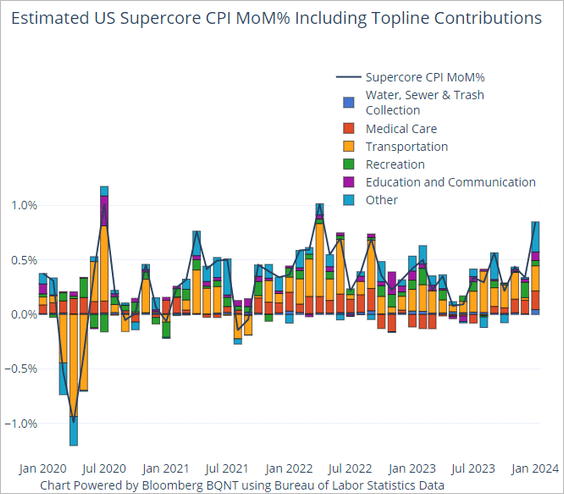 Source: @TheTerminal, Bloomberg Finance L.P.
– Will we see some mean-reversion in the supercore CPI this month?
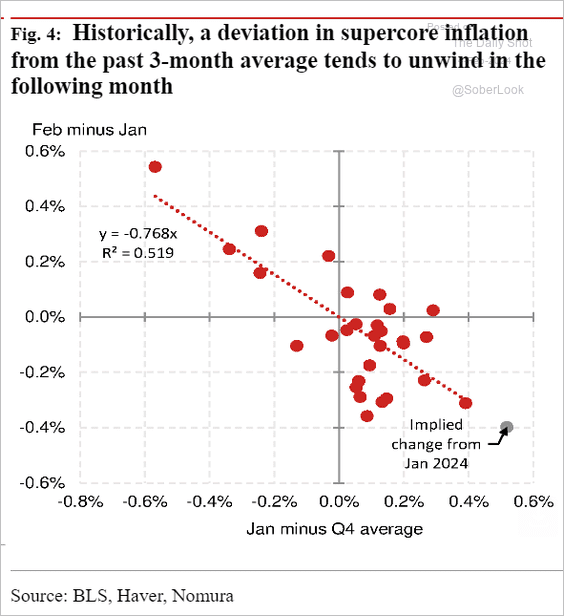 Source: Nomura Securities
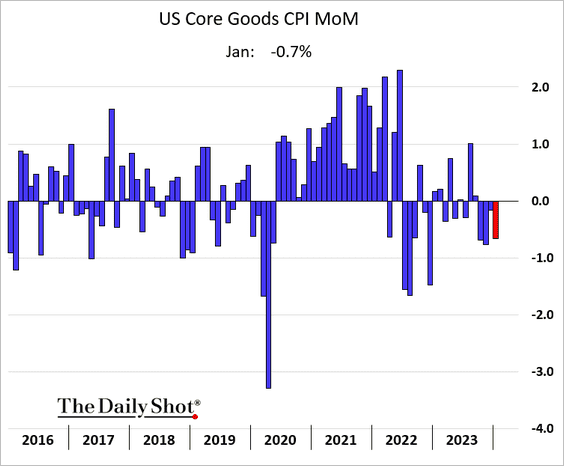
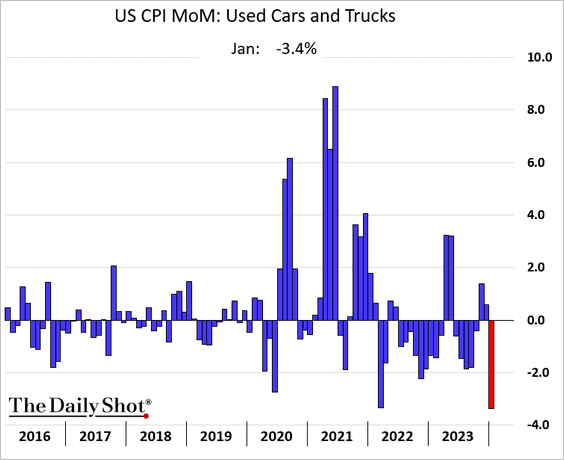
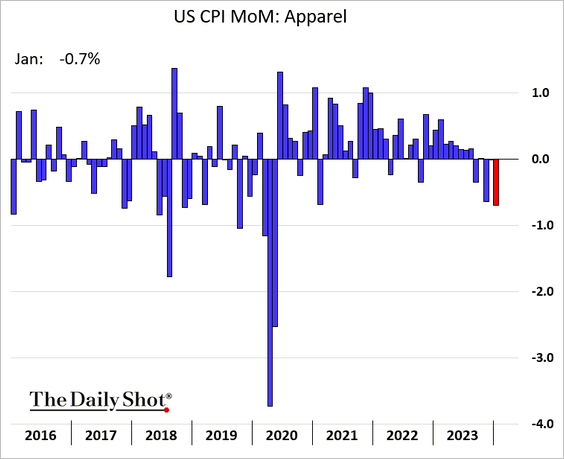
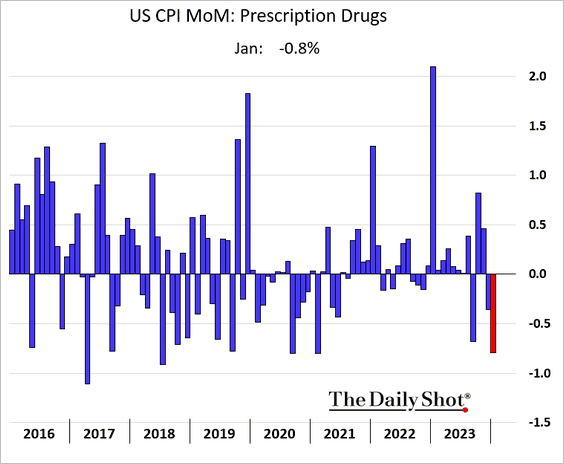
• The core goods CPI declined. Below are some examples.
– Used cars:
– Apparel:
– Medications:
• Core services CPI climbed at the fastest pace since 2022, …
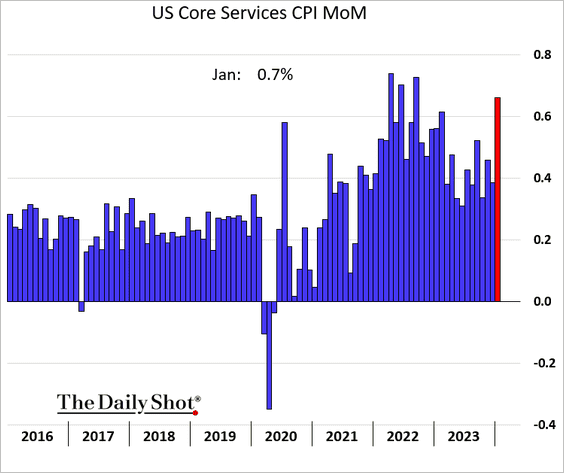
… propelled by shelter inflation, particularly owners’ equivalent rent (OER).
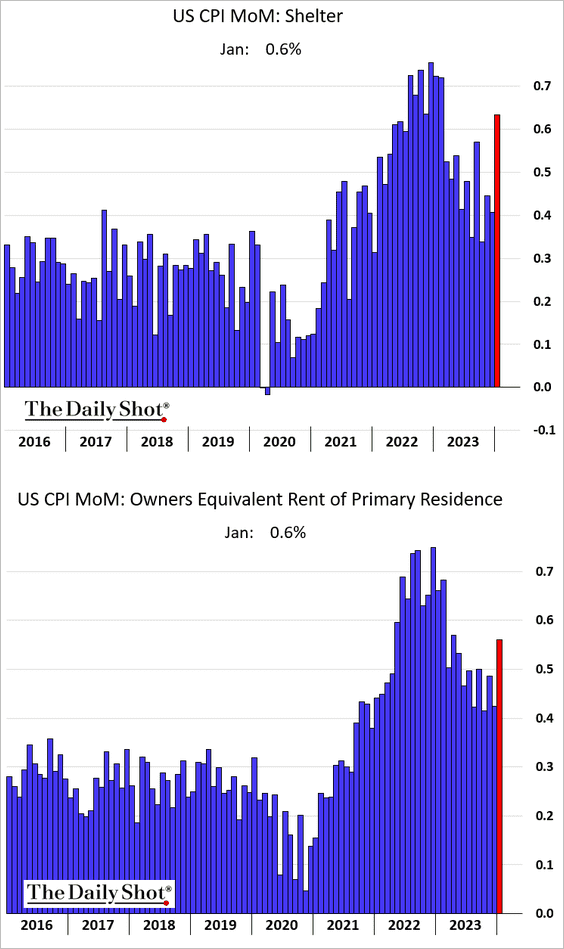
– The gap between OER and rent was unusual in January.
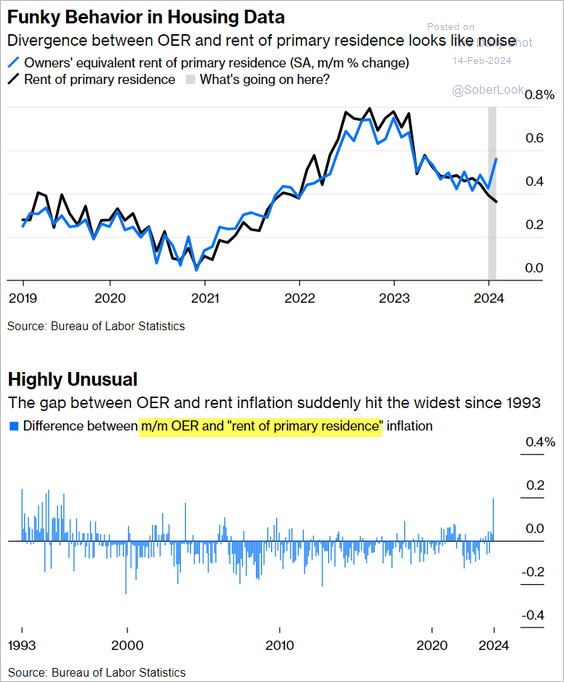 Source: @JonathanJLevin, @opinion Read full article
– Leading indicators point to further moderation in rent CPI.
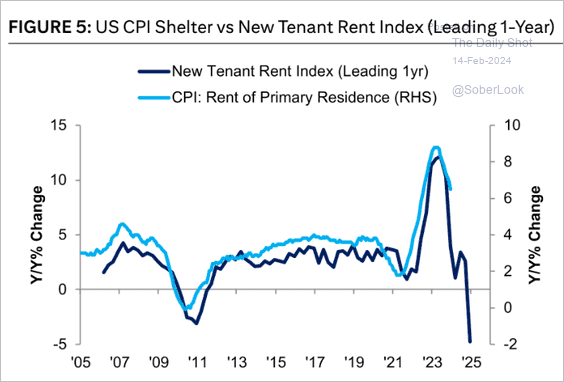 Source: Citi Private Bank
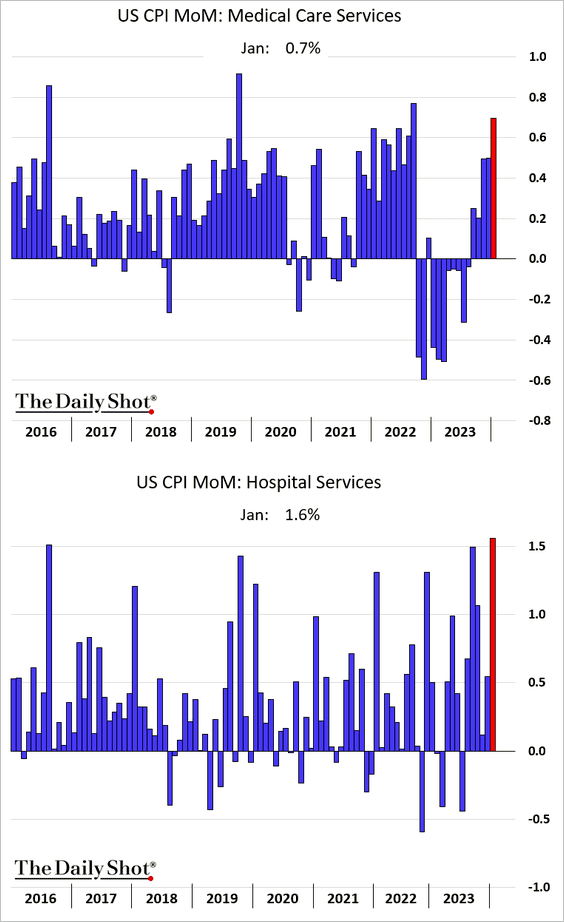
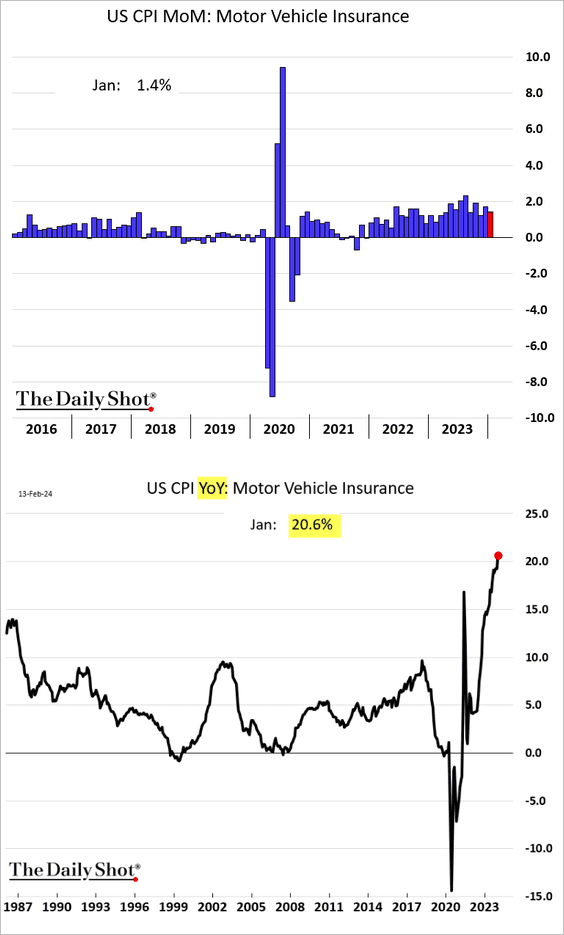
• Medical care services CPI accelerated.
• Auto insurance costs were up almost 21% year-over-year.
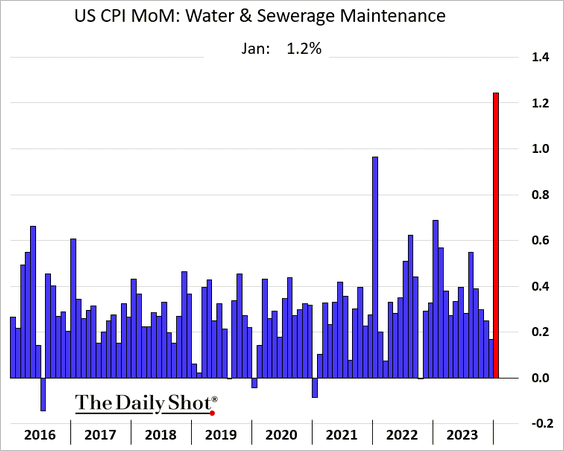
• Water and sewerage maintenance CPI soared.
• Here is a look at the CPI by state.
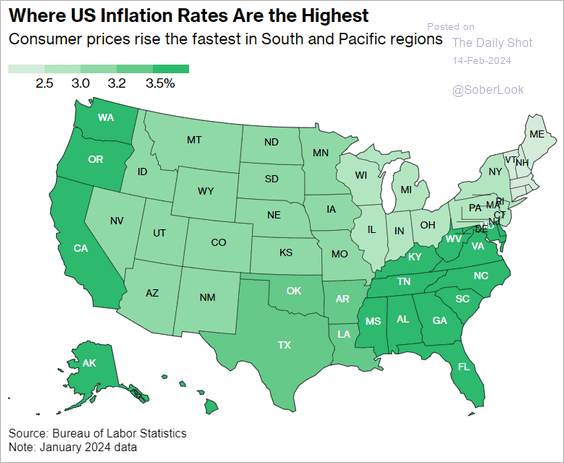 Source: @economics Read full article
——————–
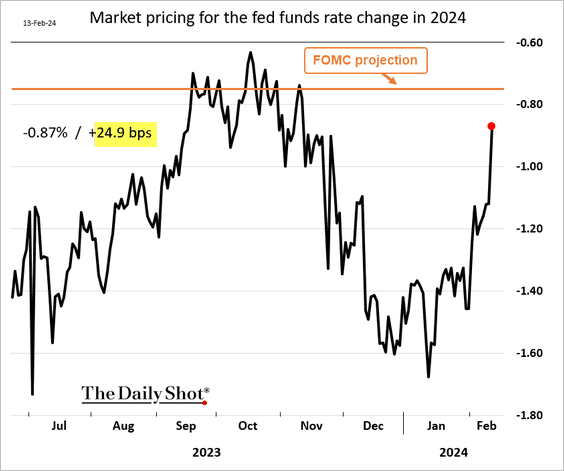
2. Expectations for Fed rate cuts were scaled back substantially after the CPI report.
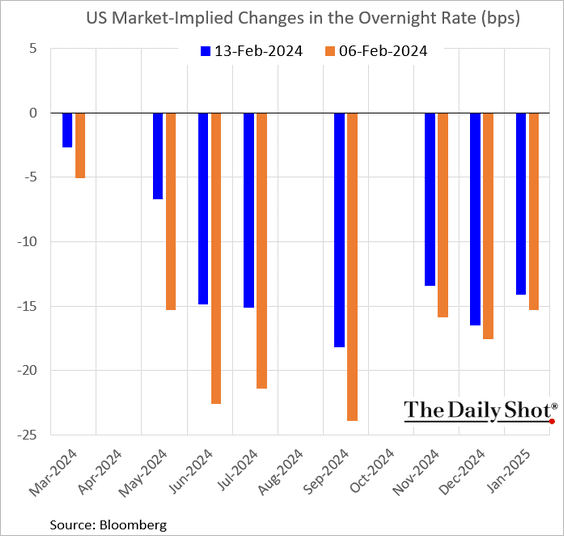
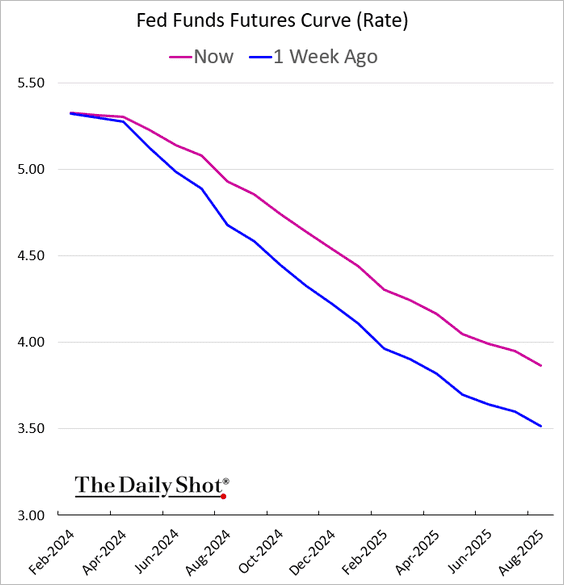
• A full rate cut was removed from market expectations for 2024 on Tuesday, aligning more closely with the FOMC’s dot-plot.
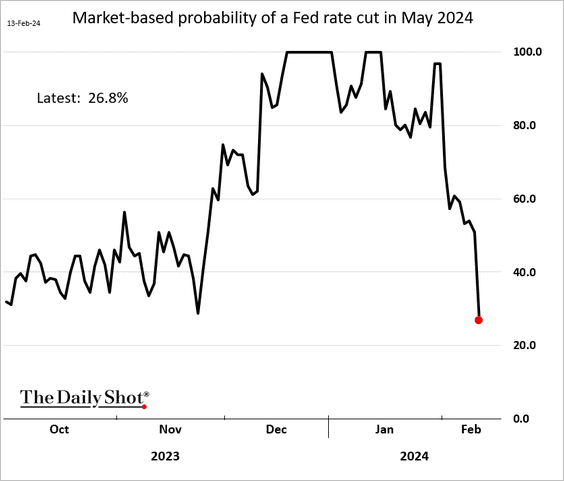
• Here is the probability of a May rate cut.
——————–
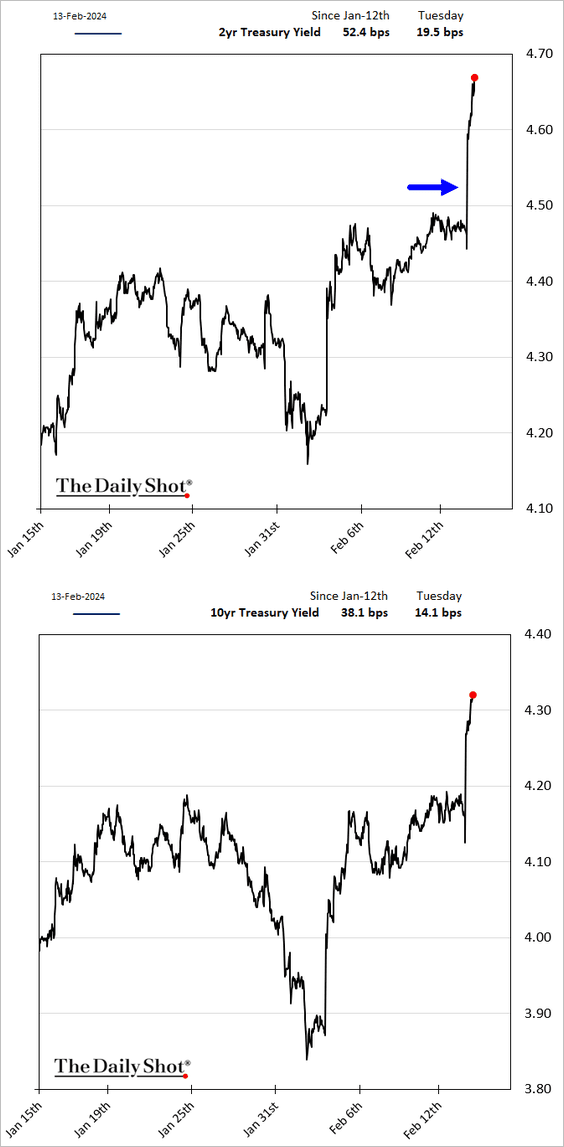
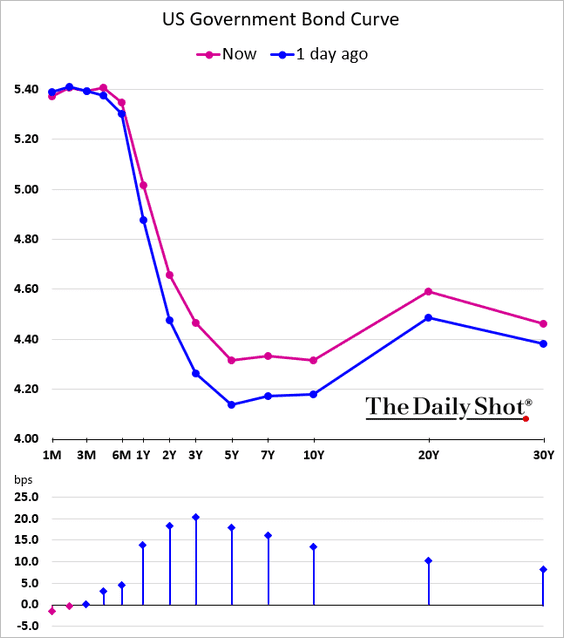
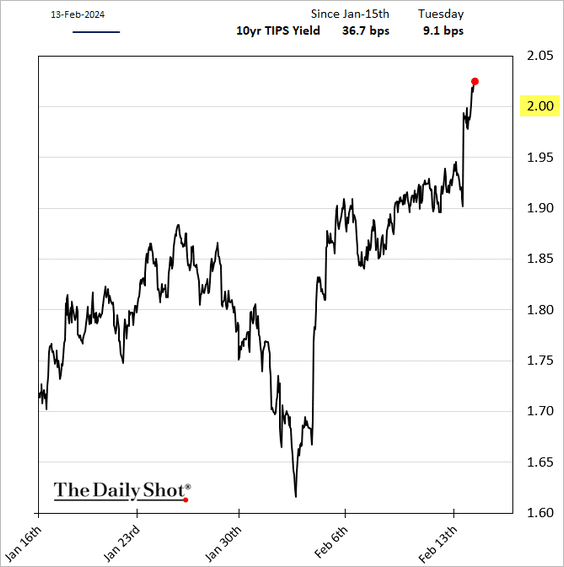
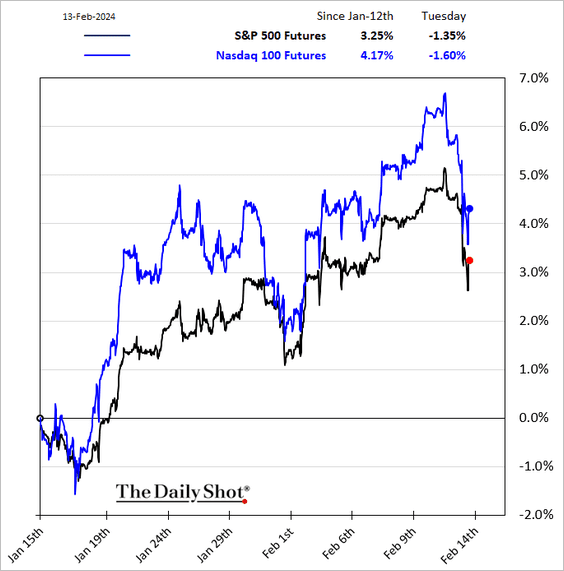
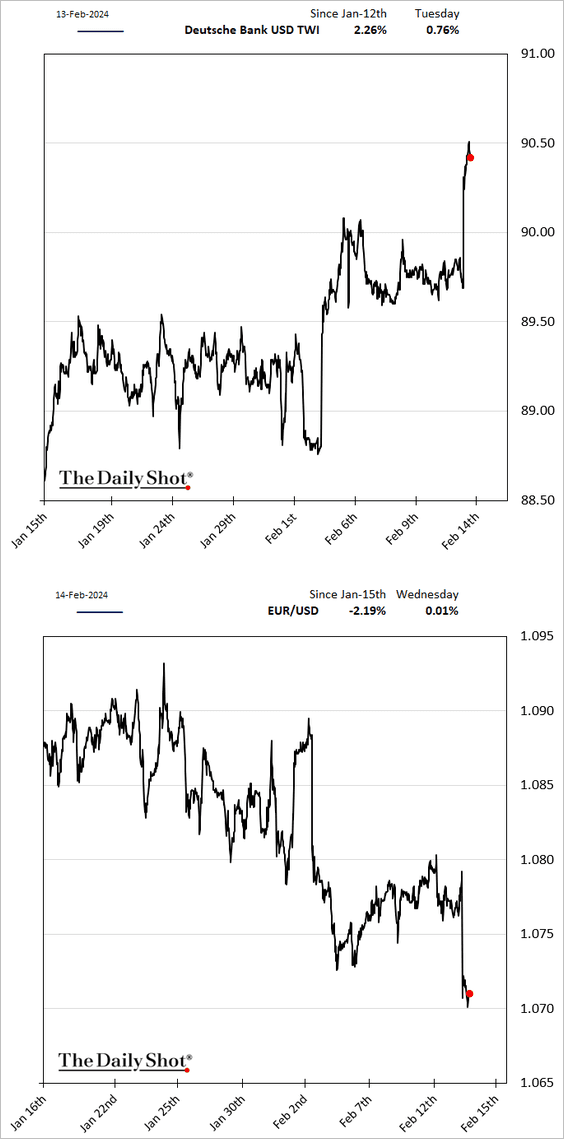
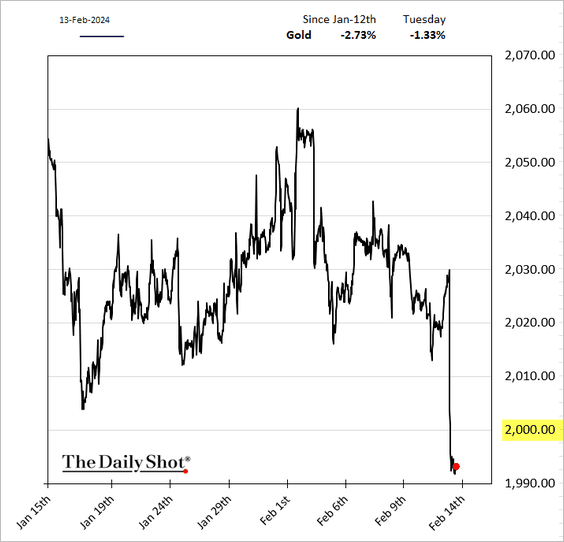
3. Below are some additional market reactions to the January inflation data.
• Treasury yields:
• Real yield (TIPS):
• Equities:
• The dollar:
• Gold:
——————–
4. Companies increasingly focus on operational efficiency amid persistently tight labor markets, …
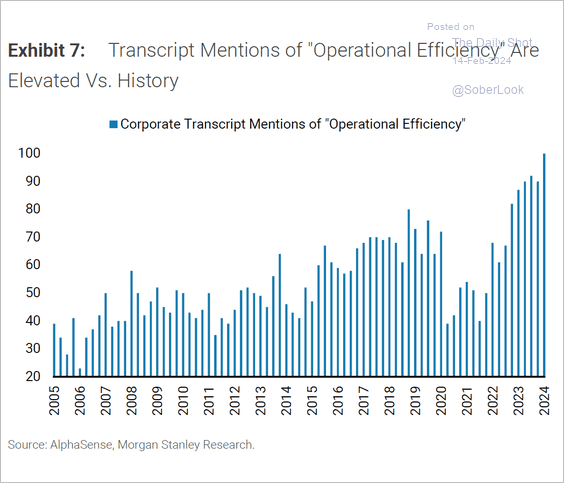 Source: Morgan Stanley Research Further reading
… which has boosted productivity.
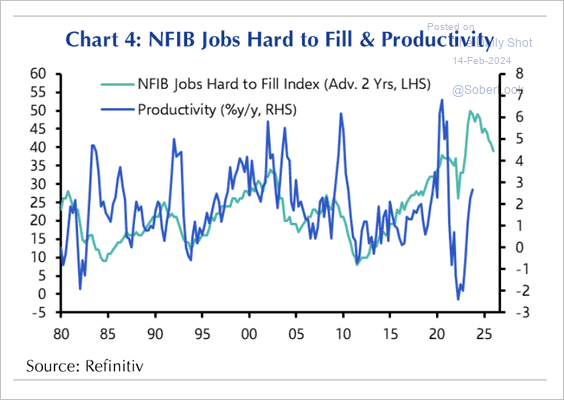 Source: Capital Economics
• There has been a rise in information technology investment, also improving productivity.
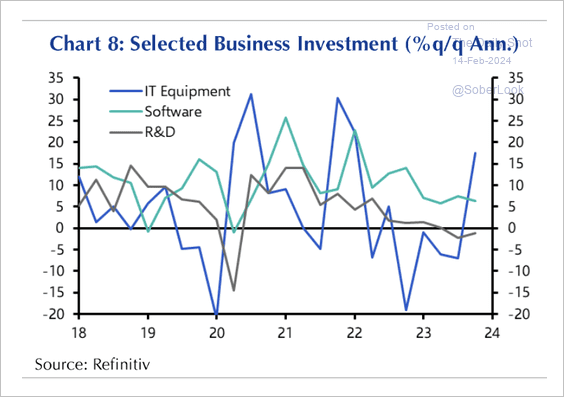 Source: Capital Economics
——————–
5. The equity market is positioned for stronger economic activity this year.
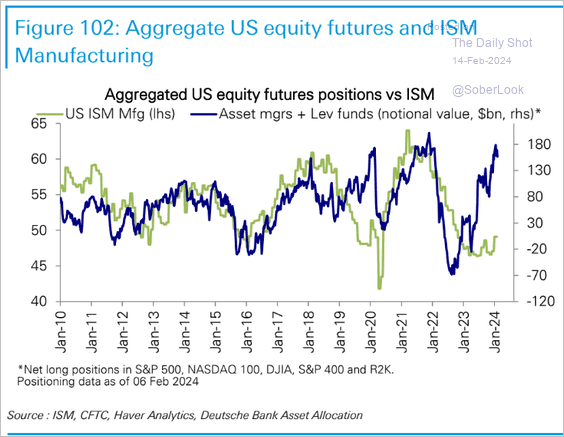 Source: Deutsche Bank Research
Back to Index
Canada
1. It was a tough day for Canadian shares, with declines caused by the US CPI report and Shopify’s weakness.
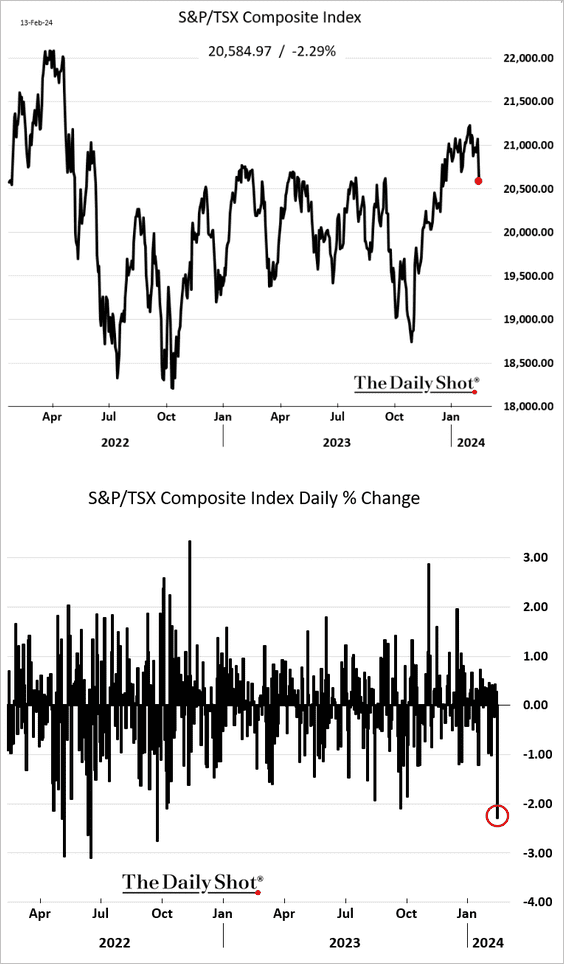
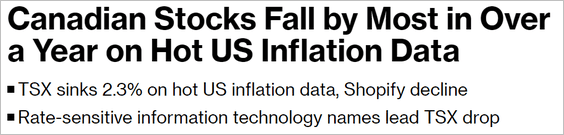 Source: @markets Read full article
——————–
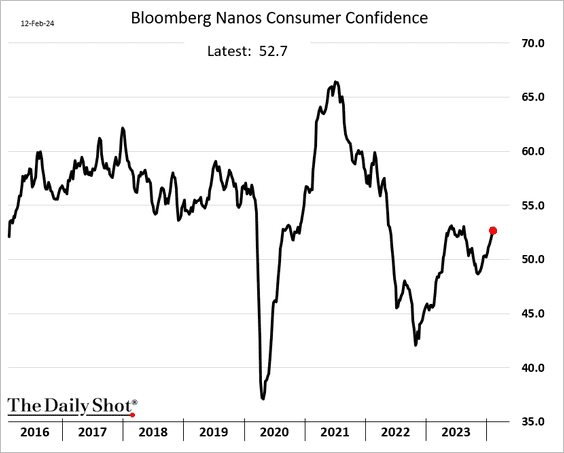
2. Consumer confidence continues to improve.
Back to Index
The United Kingdom
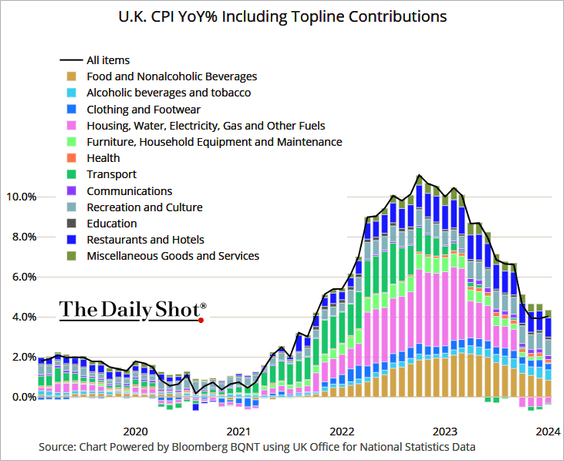
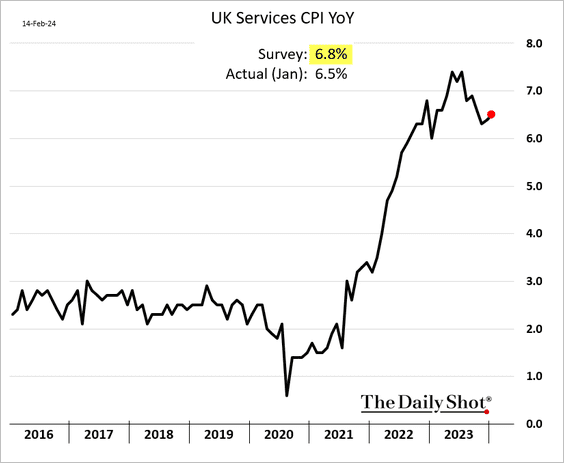
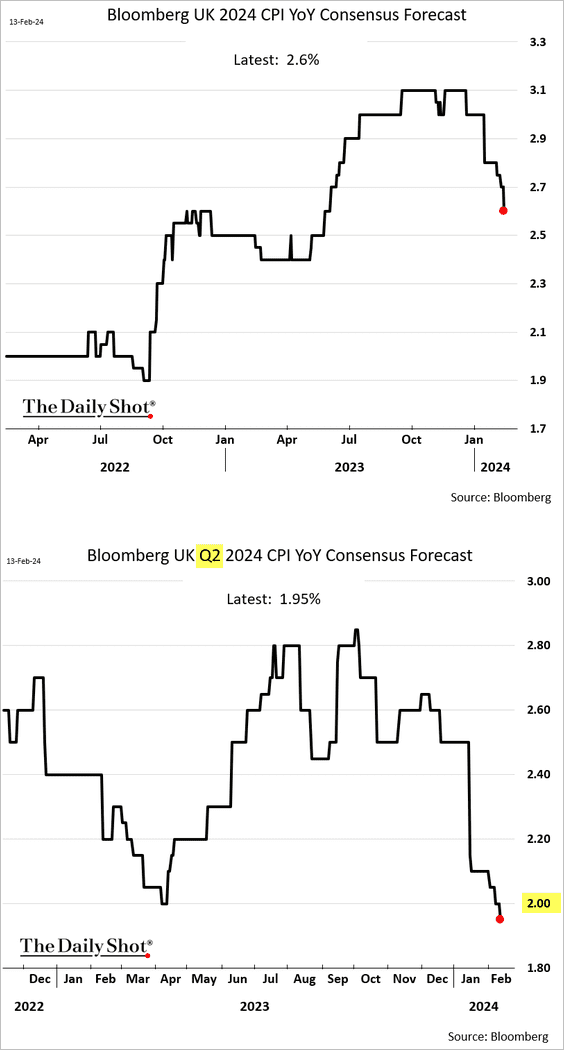
1. The January inflation report was softer than expected.
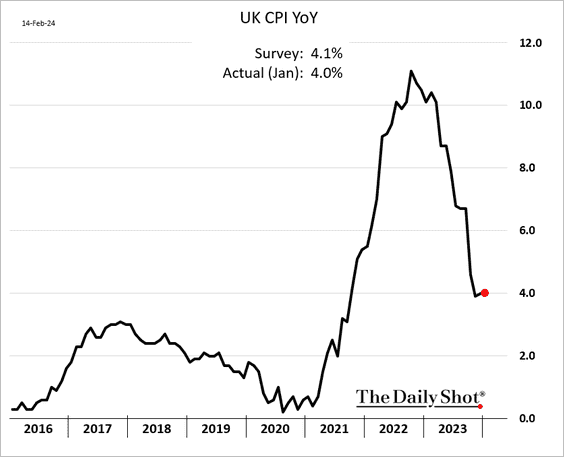
 Source: @TheTerminal, Bloomberg Finance L.P.
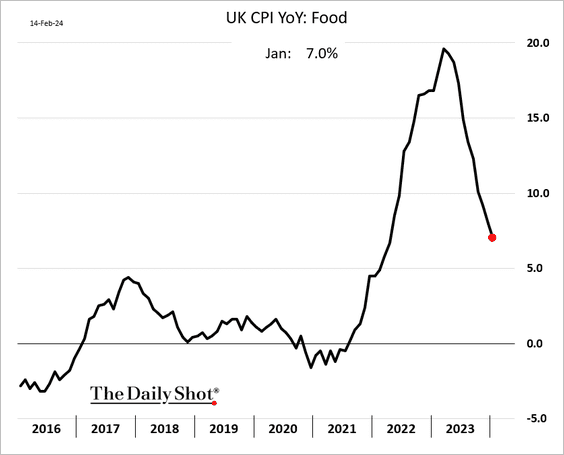
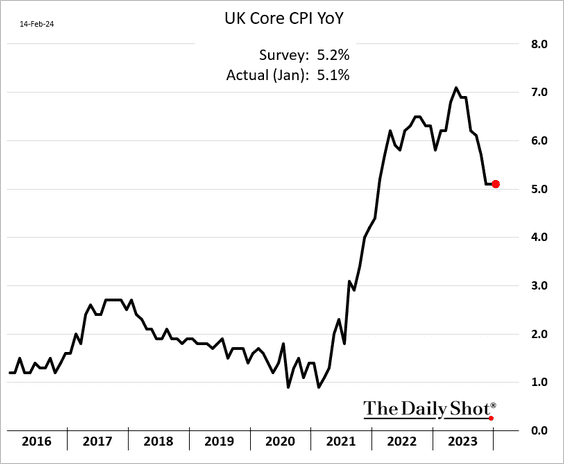
Here are some underlying trends.
– Food:
– Core CPI:
– Services CPI (well below forecasts):
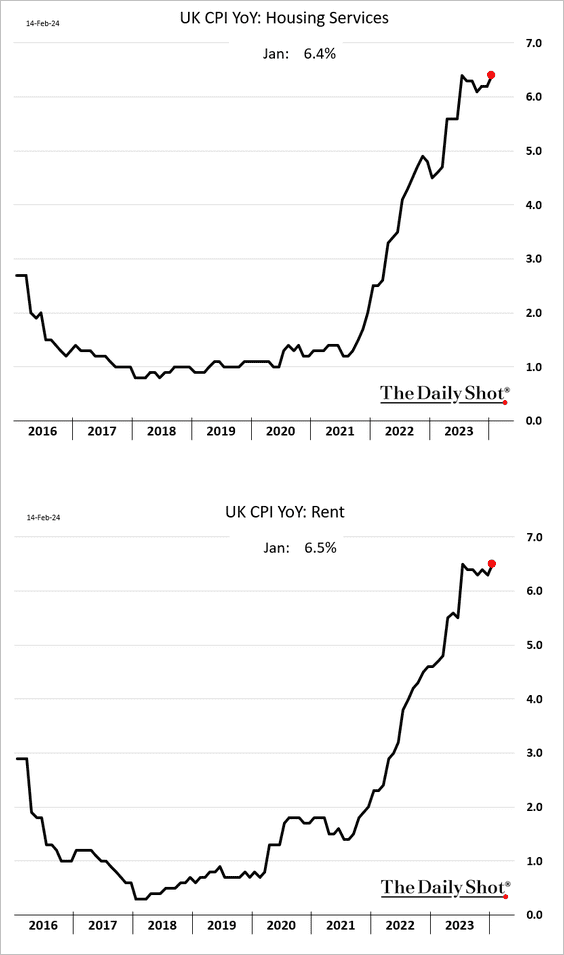
– Rent CPI (still elevated):
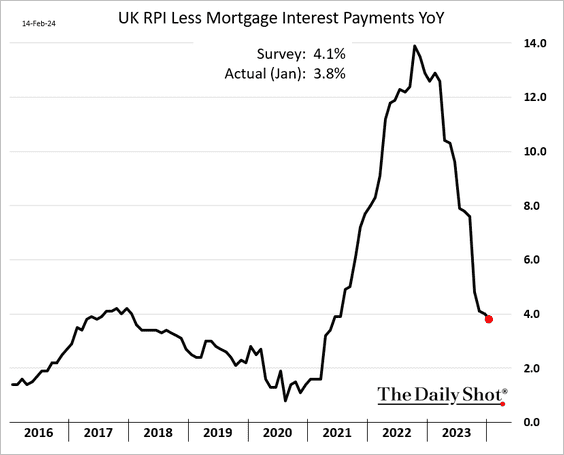
– Retail prices:
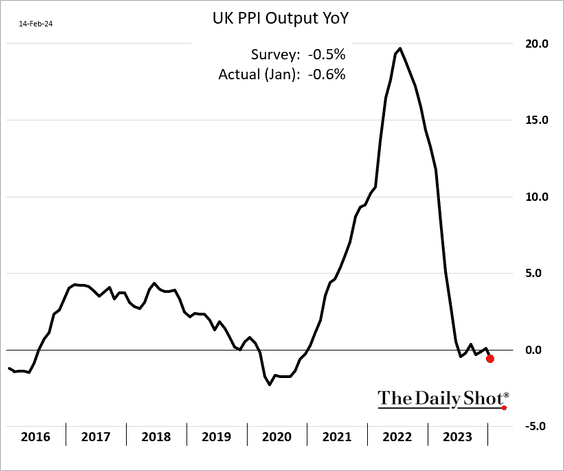
• Producer prices are down year-over-year.
• Economists expect further moderation in the UK CPI.
——————–
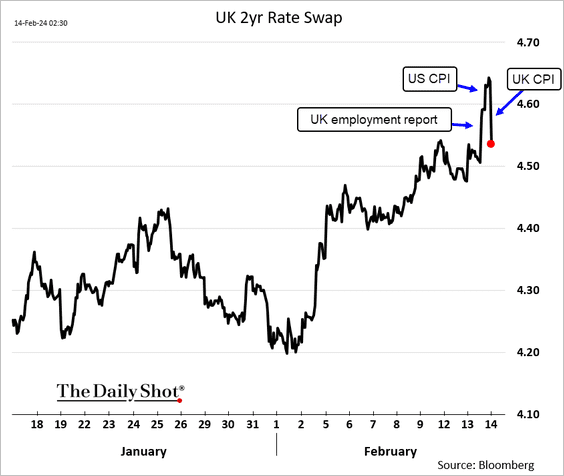
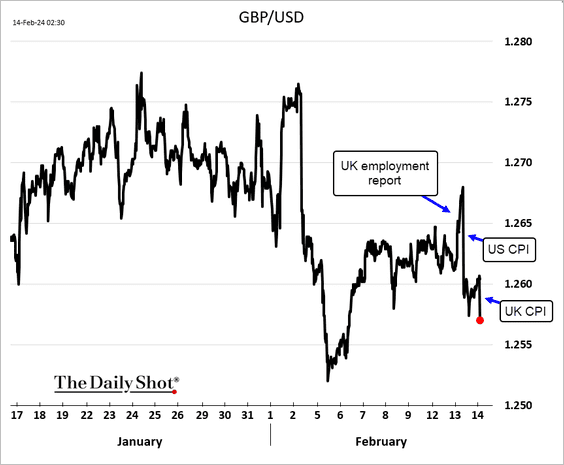
2. Short-term rates reversed some of the gains from the UK employment report and the US CPI data.
• The pound moved lower.
——————–
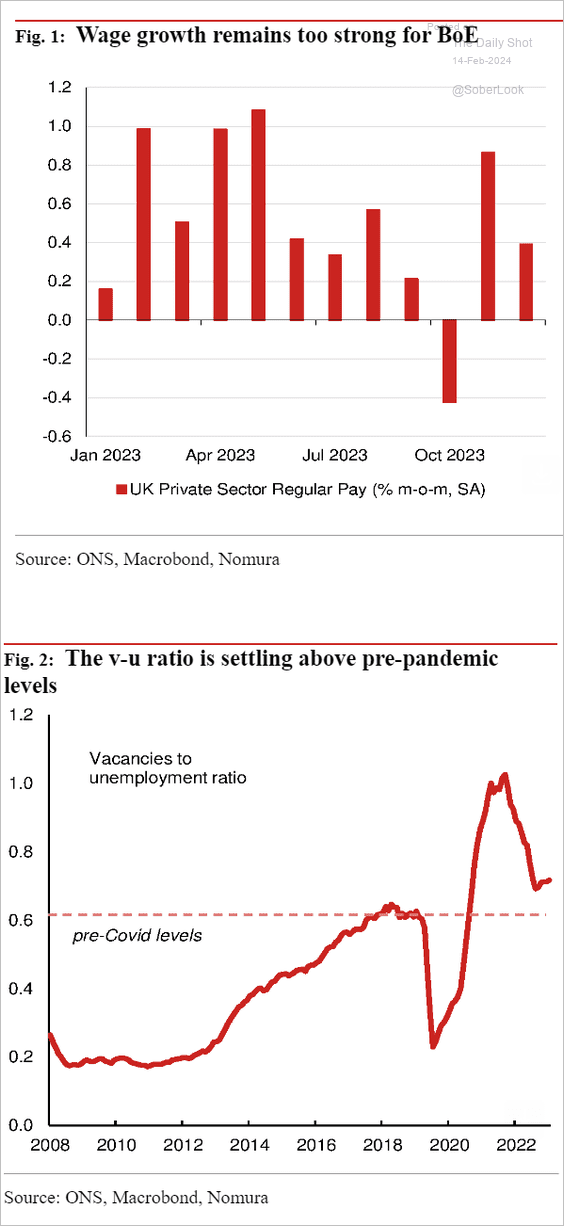
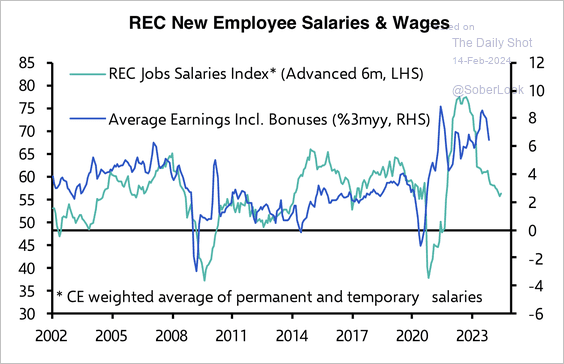
3. Is wage growth too hot for the BoE?
 Source: Nomura Securities
The decline in the REC Job Salaries Index for new employees points to a slowdown in wage growth toward 2.5% in six month’s time.
 Source: Capital Economics
Back to Index
The Eurozone
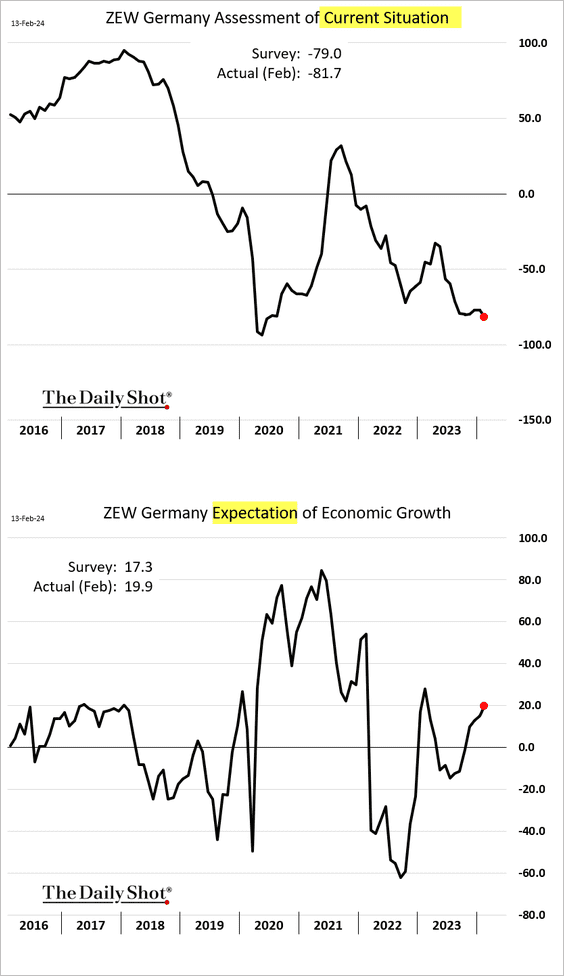
1. Germany’s ZEW economic growth expectations rose further this month despite persistently gloomy views on the current situation.
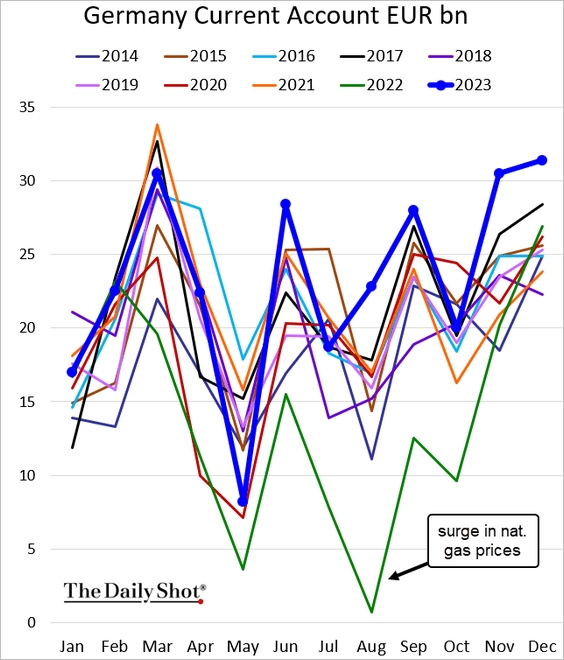
• Here is Germany’s current account balance.
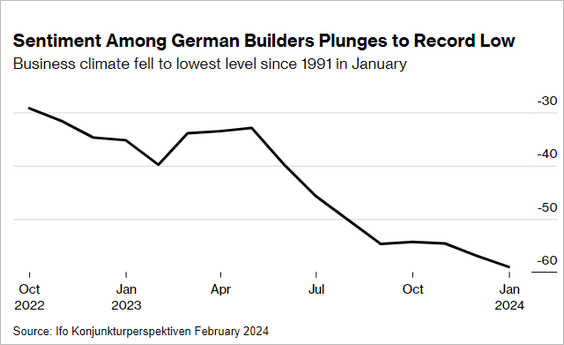
• Homebuilder sentiment continues to deteriorate.
{-] German residential real estate prices are falling.
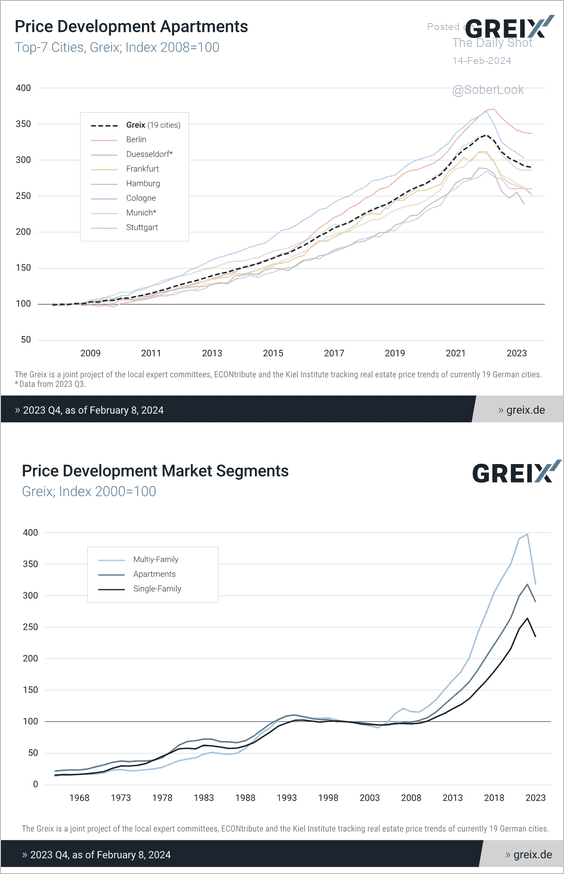 Source: Kiel Institute for the World Economy Read full article
• Why are German companies investing abroad?
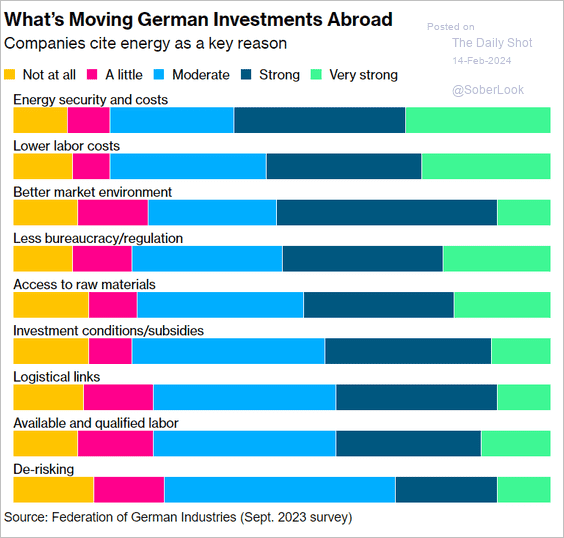 Source: @economics Read full article
——————–
2. The ECB’s outlook on economic activity is starting to improve, aided by declining inflation expectations.
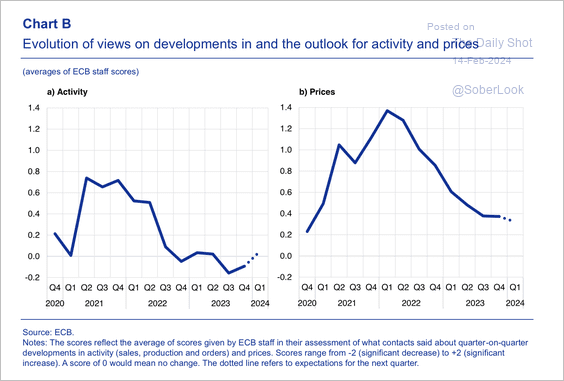 Source: ECB
3. Here is a look at commercial real estate loan exposure by country.
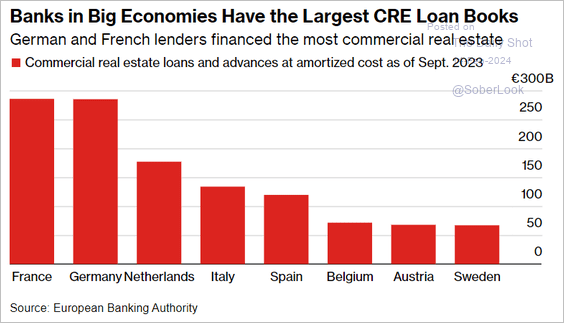 Source: @markets Read full article
4. The share of financially vulnerable firms and bankruptcies has risen in recent years.
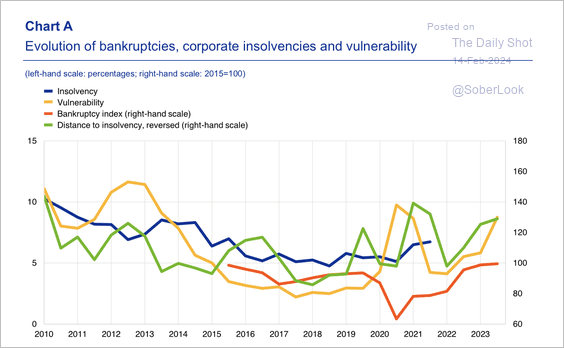 Source: ECB
Back to Index
Europe
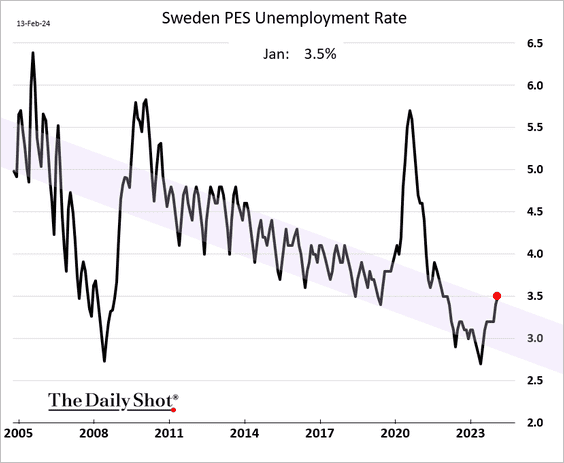
1. Sweden’s unemployment climbed last month.
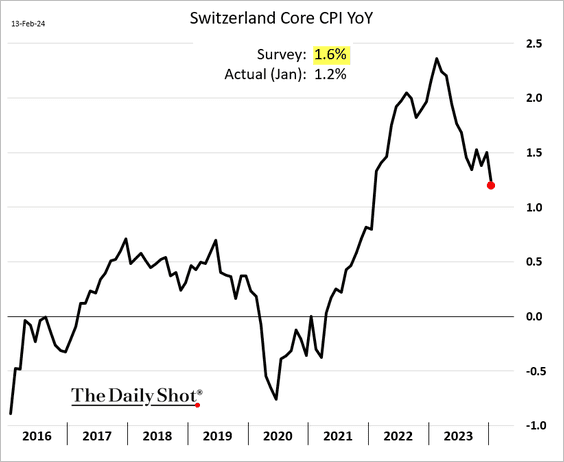
2. Swiss inflation continues to moderate.
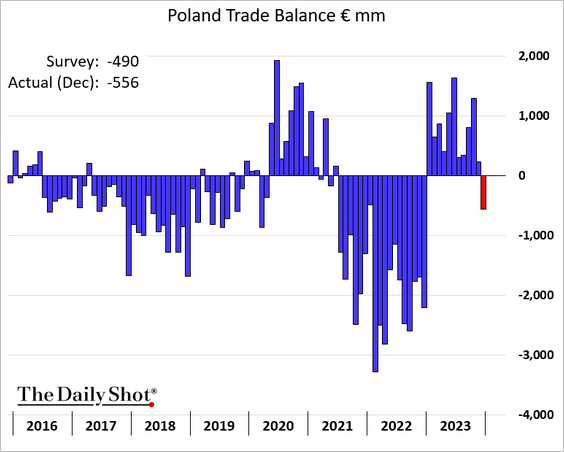
3. Poland’s trade balance swung into deficit in December.
4. Here is a look at foreign-controlled enterprises in the EU.
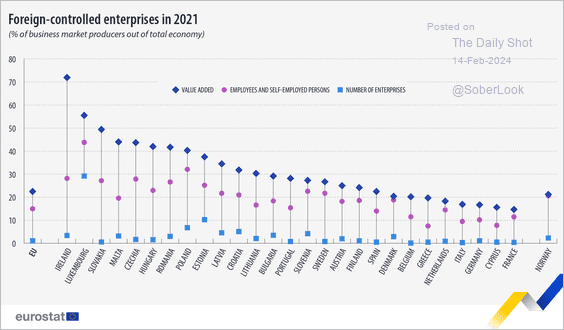 Source: Eurostat Read full article
Back to Index
Japan
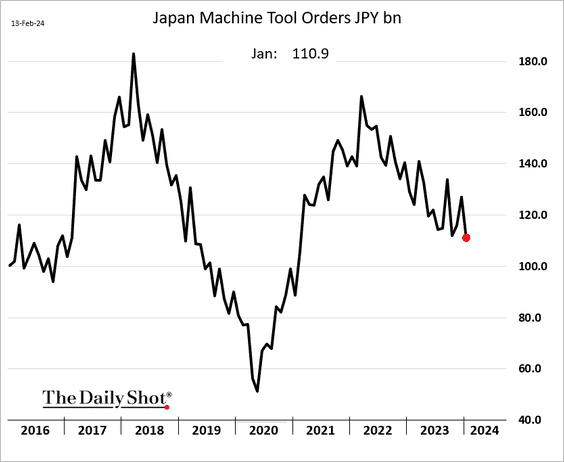
1. Machine tool orders eased further last month.
2. Wage growth is accelerating.
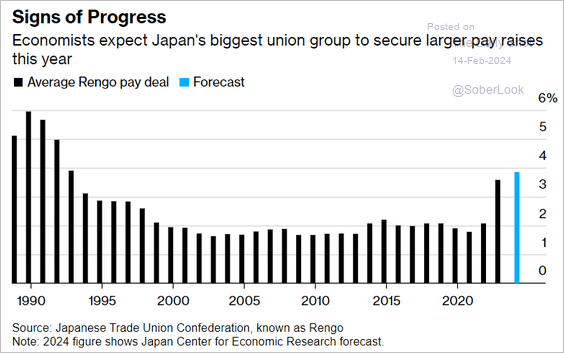 Source: @economics Read full article
Back to Index
Emerging Markets
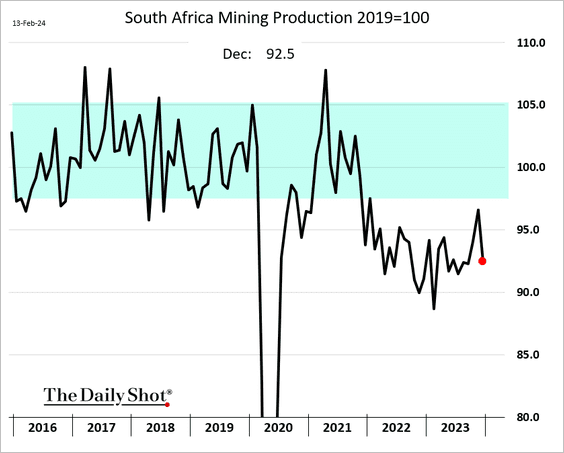
1. South Africa’s mining output declined sharply in December.
2. The Nigerian naira’s devaluation has been massive
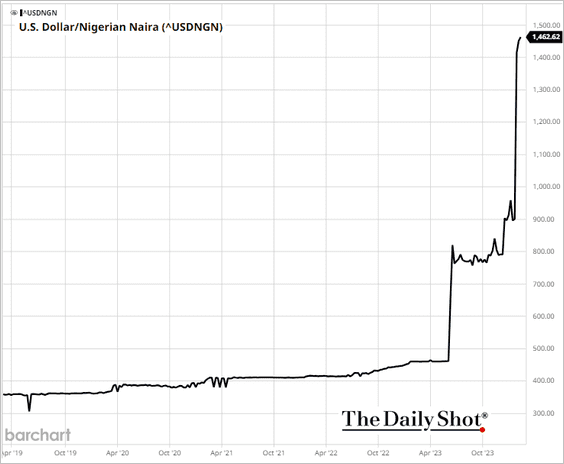
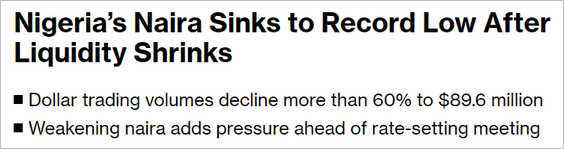 Source: @markets Read full article
——————–
3. There is a lot of equity options trading in India.
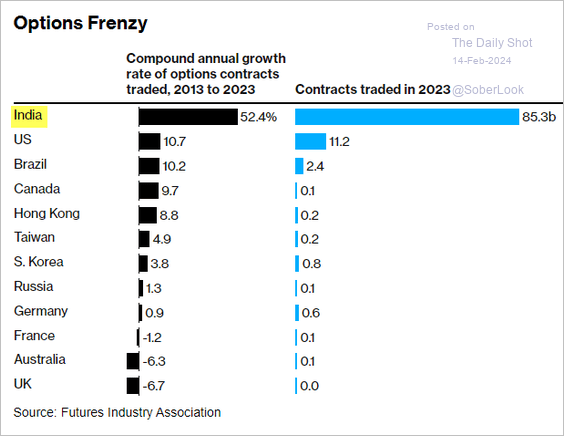 Source: @markets Read full article
4. Here is a look at foreign direct investment projects by destination.
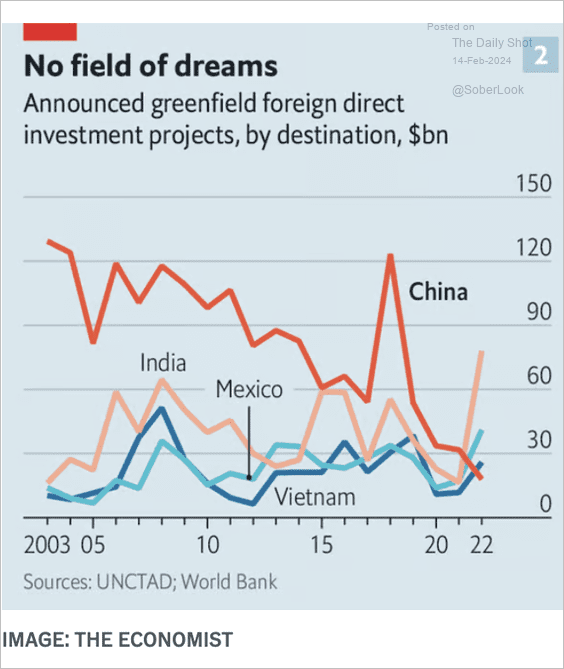 Source: The Economist Read full article
Back to Index
Commodities
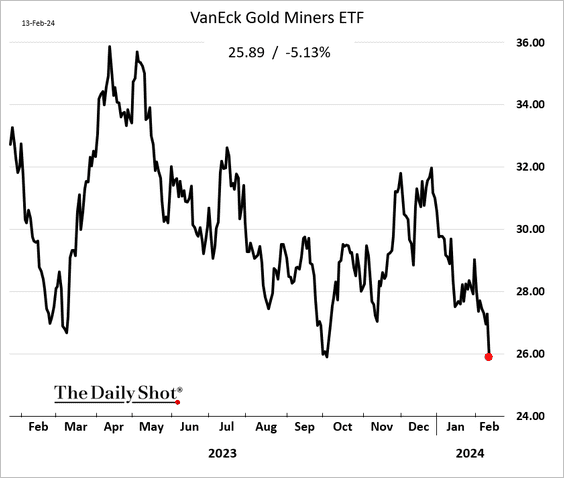
1. Shares of gold miners tumbled after the US CPI report as the dollar surged.
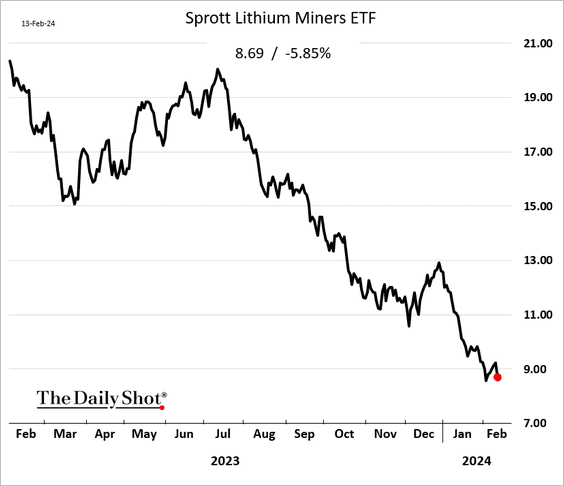
2. Shares of lithium miners continue to struggle.
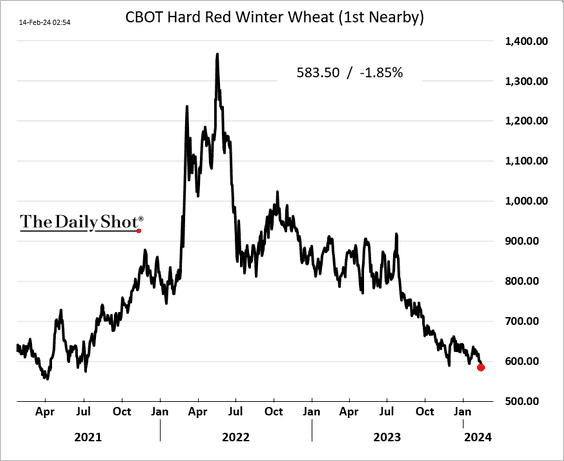
3. US HRW wheat futures hit the lowest level since 2021.
Back to Index
Energy
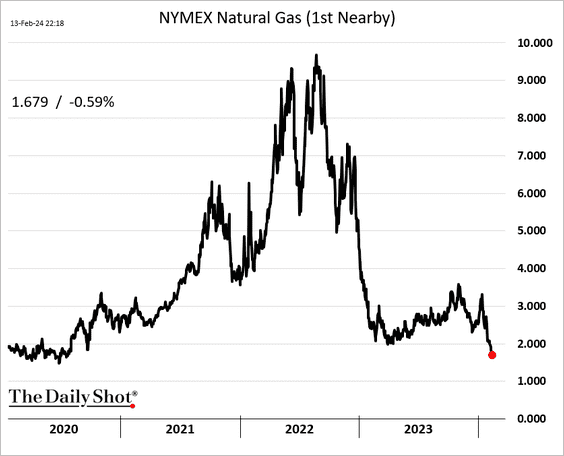
1. Natural gas futures remain under pressure.
2. US gasoline futures keep rising.
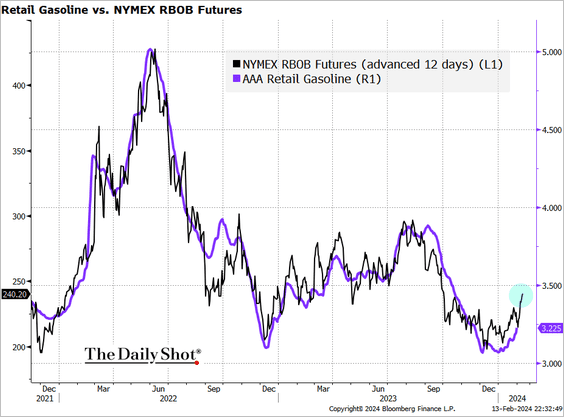 Source: @TheTerminal, Bloomberg Finance L.P.
By the way, here is a look at the components of US retail gasoline and diesel costs.
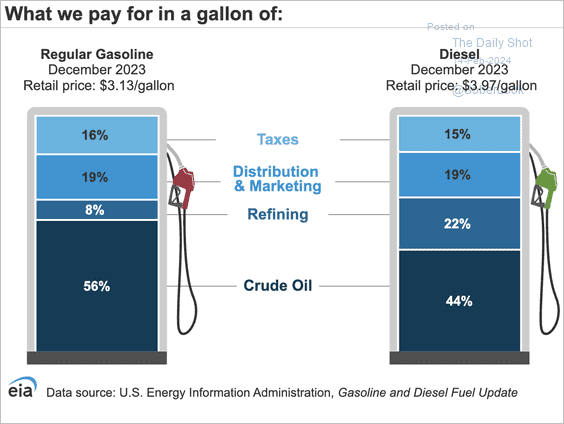 Source: @EIAgov
Back to Index
Equities
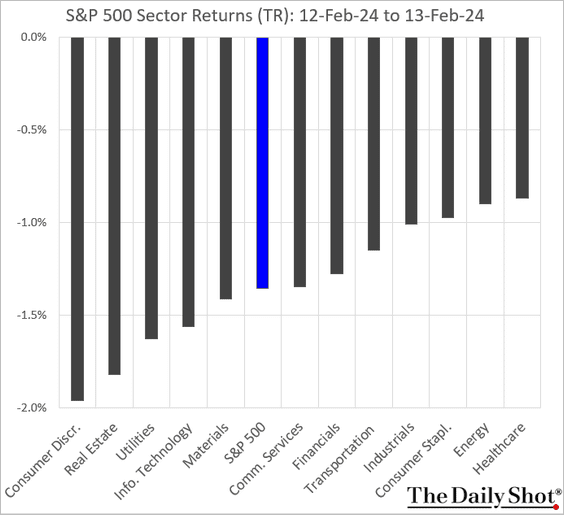
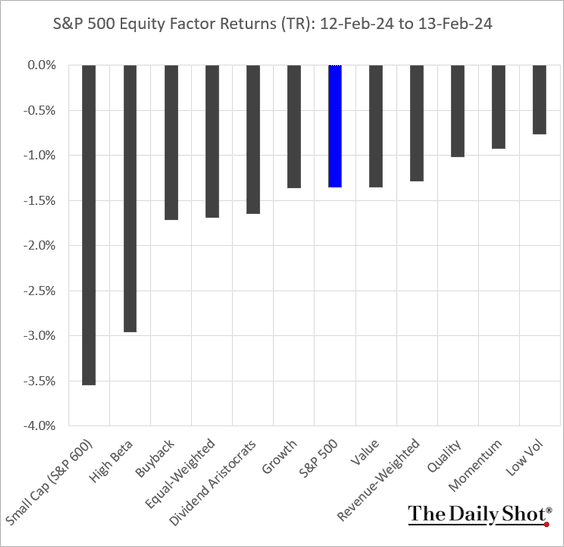
1. How did the US market respond to the hot CPI report?
• Sectors:
• Equity factors:
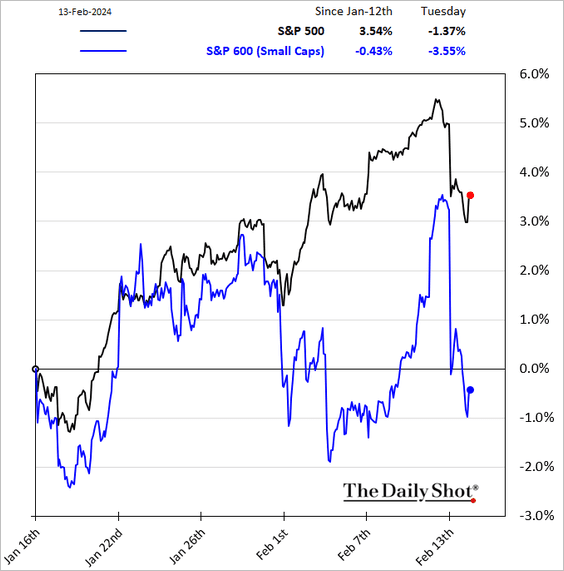
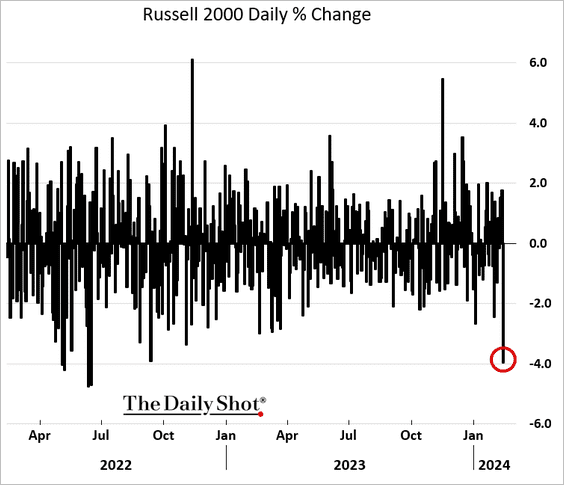
2. It was a rough day for small caps as bond yields surged.
• Here is a look at the correlation of small caps to Treasuries over the long term.
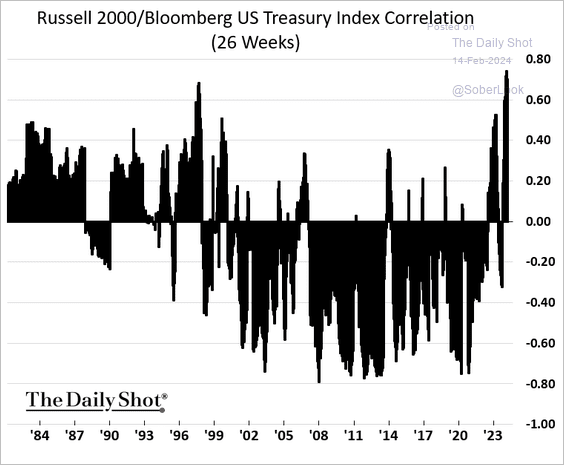 h/t @dailychartbook
——————–
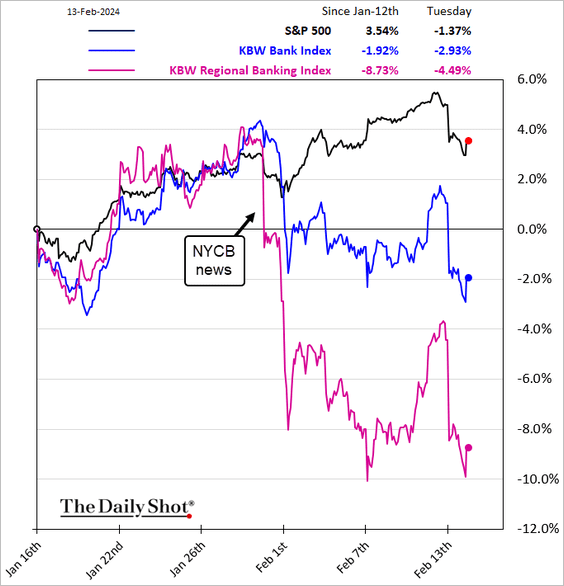
3. The bond selloff was a drag on banks, especially smaller lenders.
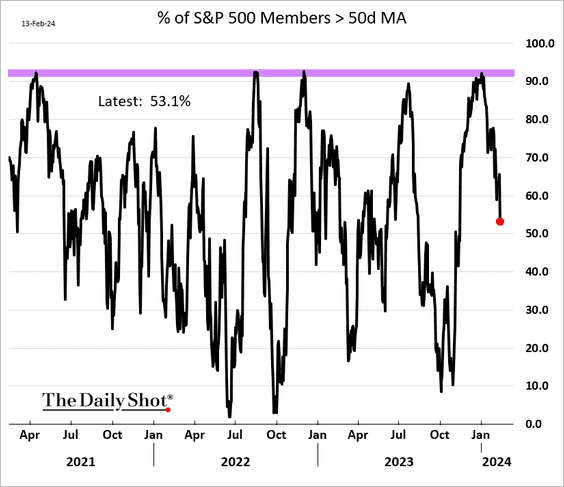
4. The S&P 500 breadth has been deteriorating.
5. Single-stock implied volatility has been unusually low.
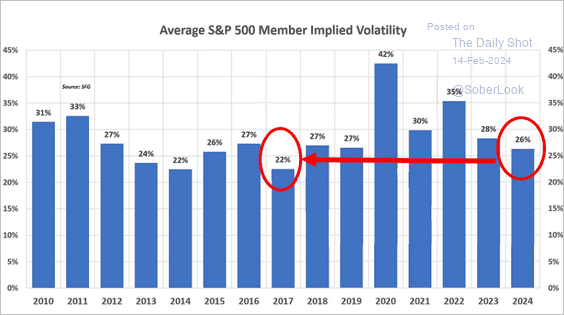 Source: Chris Murphy, Susquehanna International Group
6. Investors increasingly expect growth to outperform value.
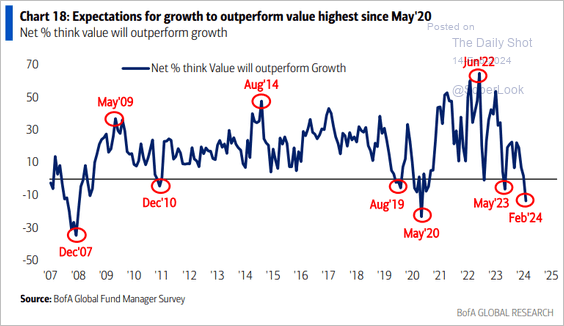 Source: BofA Global Research
7. The US stock market is close to being the most concentrated in history.
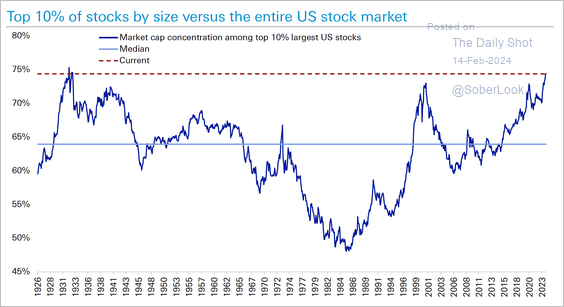 Source: Deutsche Bank Research
• This chart shows the top five stocks by market cap in the S&P 500 throughout history.
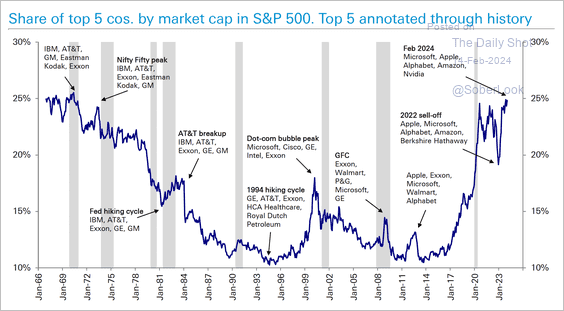 Source: Deutsche Bank Research
• High S&P 500 concentration typically occurs during periods of lower Treasury yields and vice versa.
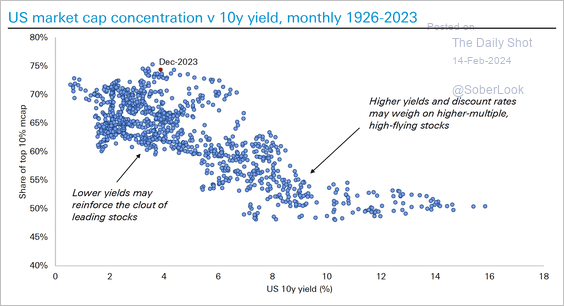 Source: Deutsche Bank Research
——————–
8. Investors see “Magnificent 7” longs as the most crowded trade.
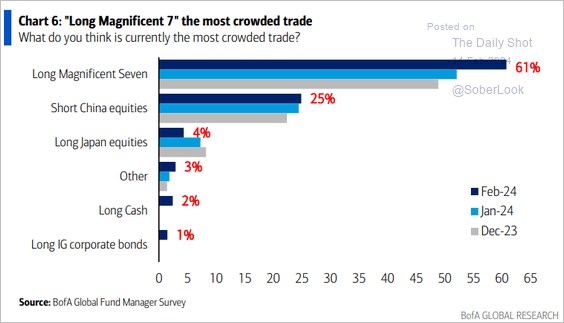 Source: BofA Global Research
9. This chart shows equity valuations globally.
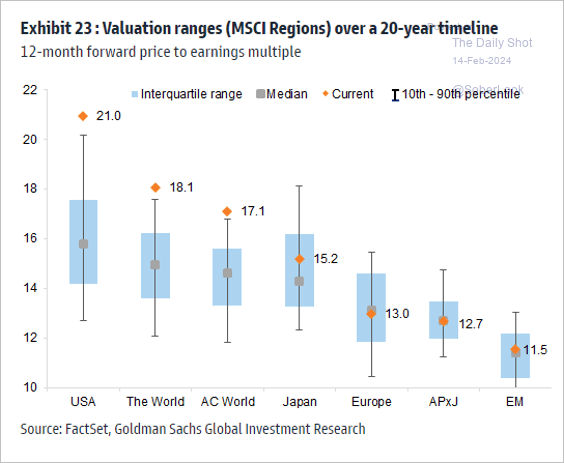 Source: Goldman Sachs; @MikeZaccardi
Back to Index
Credit
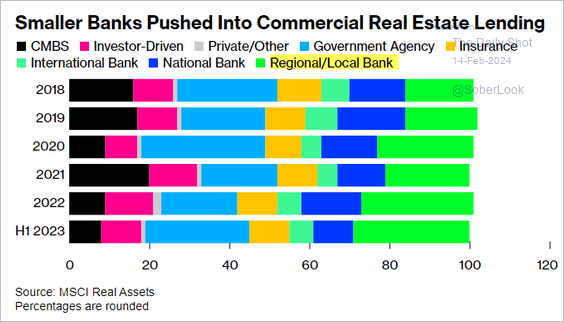
1. Here is a look at smaller banks’ CRE debt exposure (2 charts).
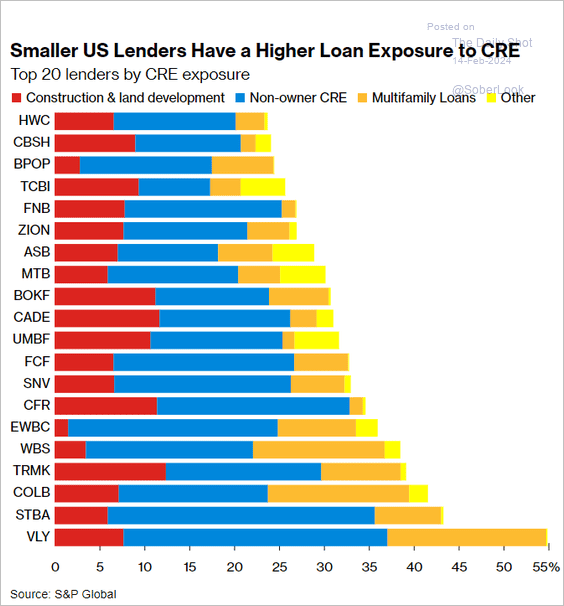 Source: @markets Read full article
 Source: @markets Read full article
• CRE exposure is viewed as the most likely source of a credit event.
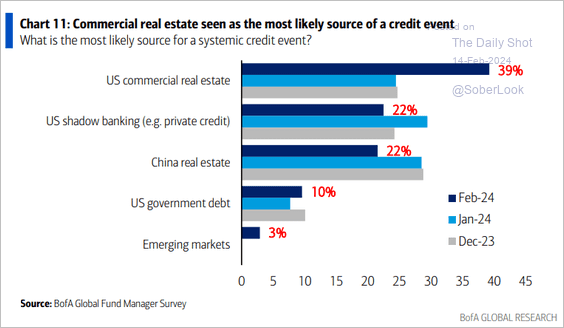 Source: BofA Global Research
• This chart shows the CRE debt maturity wall.
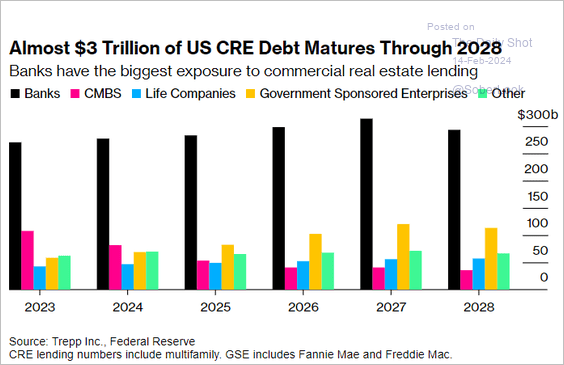 Source: @markets Read full article
——————–
2. IG spreads have been correlated to Treasury yields.
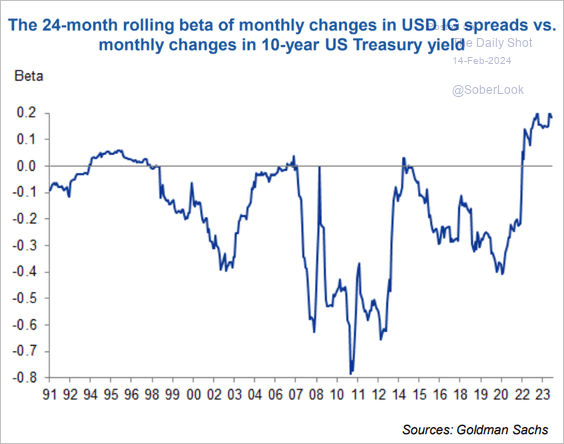 Source: Goldman Sachs; III Capital Management
3. Annuity demand remains robust, fueling demand for credit from insurance firms.
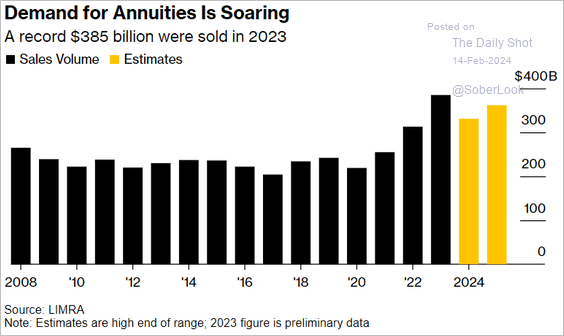 Source: @markets Read full article
Back to Index
Rates
1. Long-dated Treasuries have been more volatile than stocks.
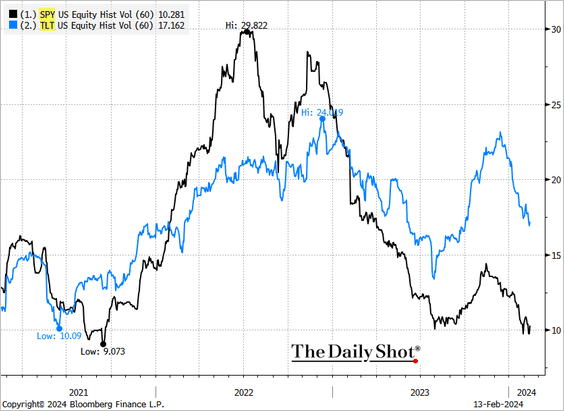 Source: @TheTerminal, Bloomberg Finance L.P.
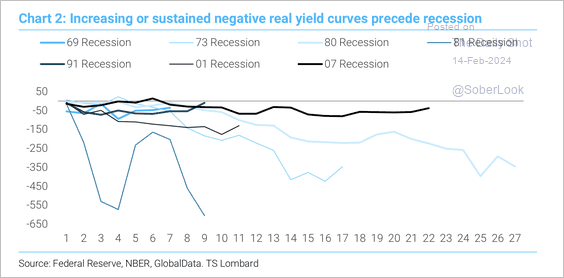
2. The real yield curve inverted in January, which typically occurs around peaks in the business cycle and the real Fed funds rate.
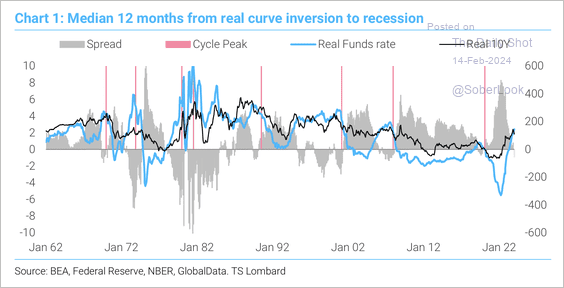 Source: TS Lombard
• The lead time from an inverted real yield curve to a recession varies widely.
 Source: TS Lombard
Back to Index
Global Developments
1. Goldman’s business survey signals DM manufacturing returning to growth this year.
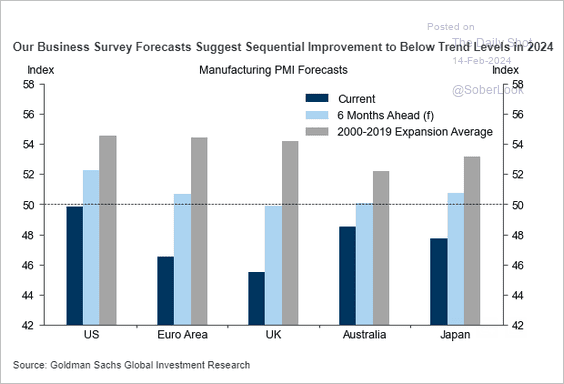 Source: Goldman Sachs; @MikeZaccardi
2. Investors no longer expect a global recession.
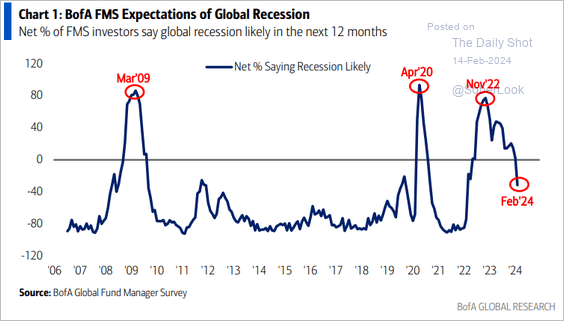 Source: BofA Global Research
——————–
Food for Thought
1. Office visits (2 charts):
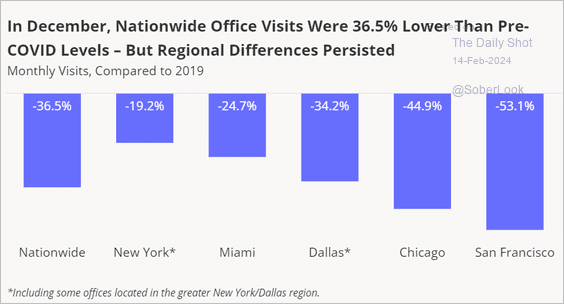 Source: Placer.ai
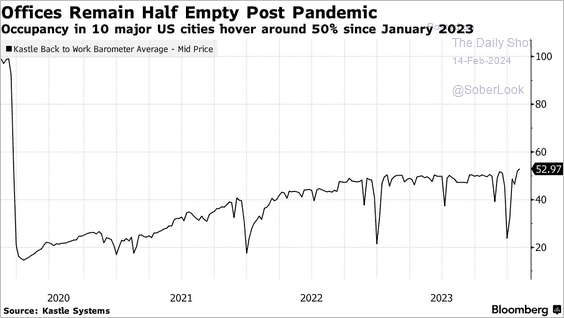 Source: @citylab Read full article
——————–
2. The share of income spent on rent:
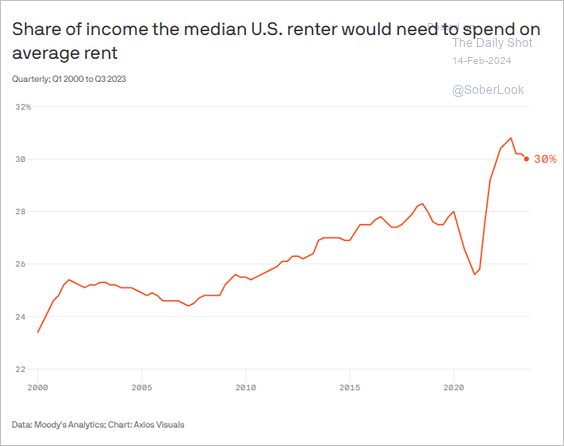 Source: @axios Read full article
3. Teen birth rates (2 charts):
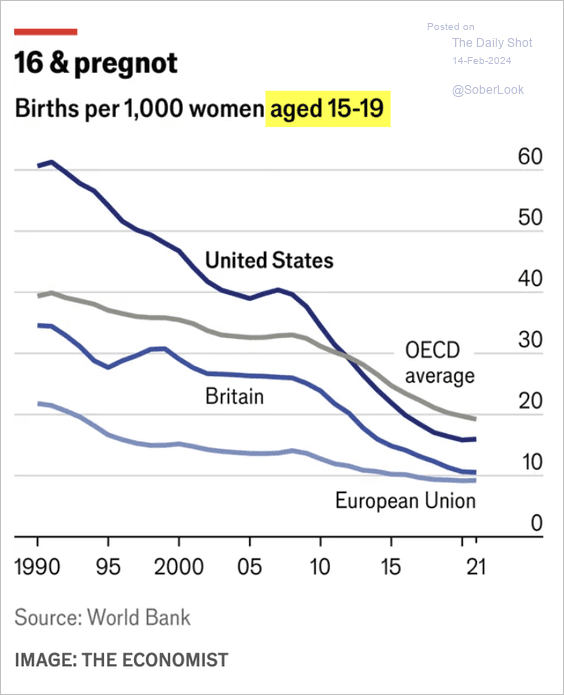 Source: The Economist Read full article
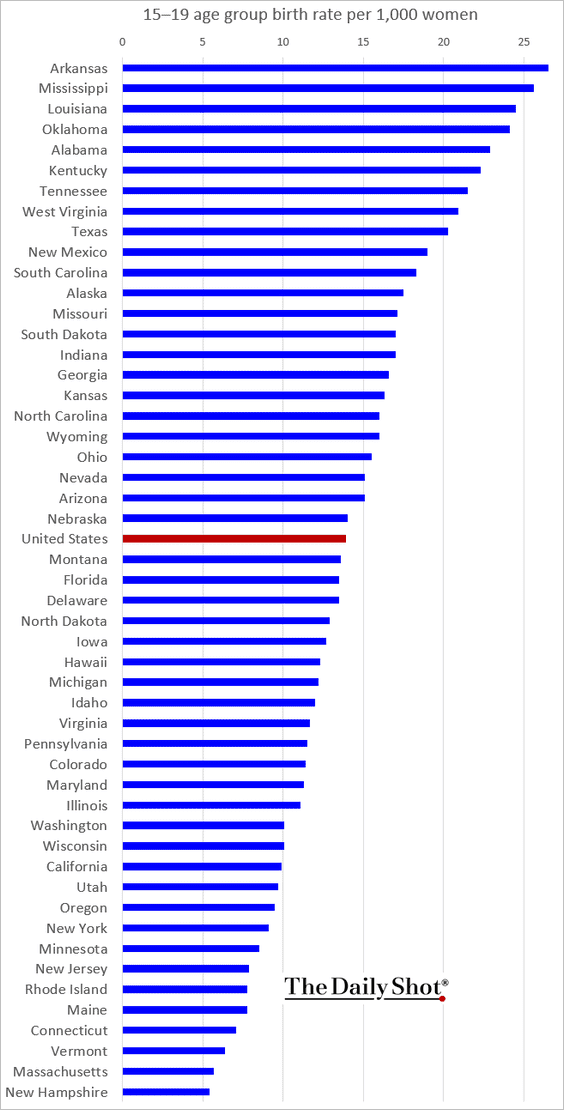 Source: CDC
——————–
4. NATO countries’ defense spending:
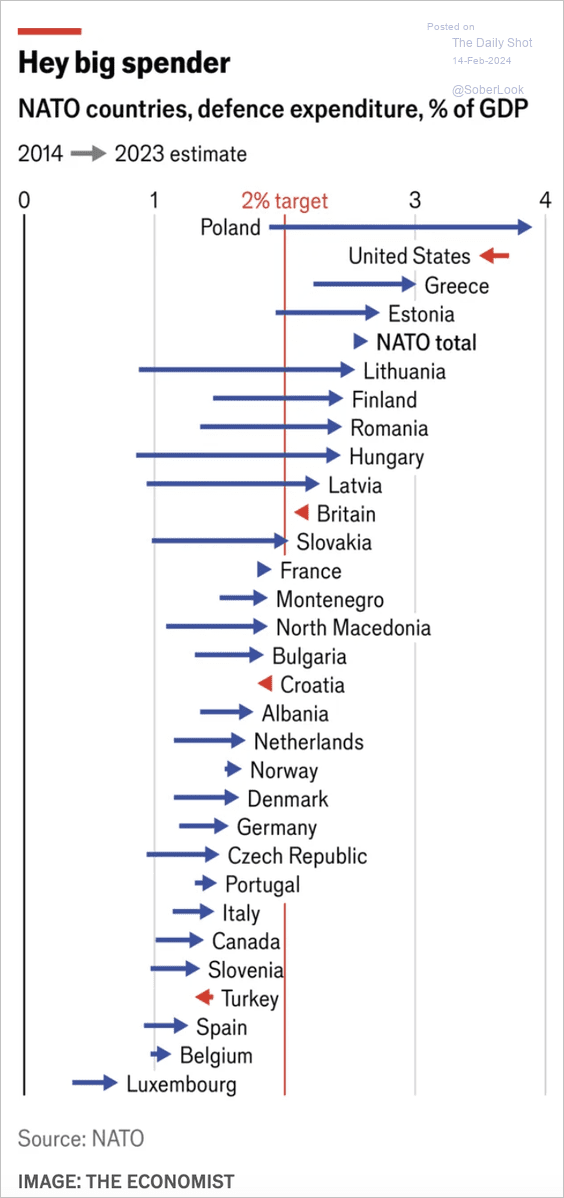 Source: The Economist Read full article
5. Homicide rates in select LatAm countries:
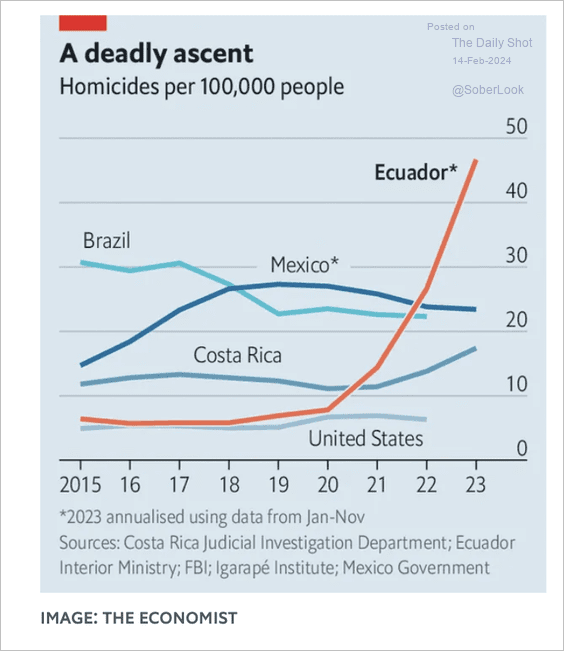 Source: The Economist Read full article
6. Credit-impaired charter schools:
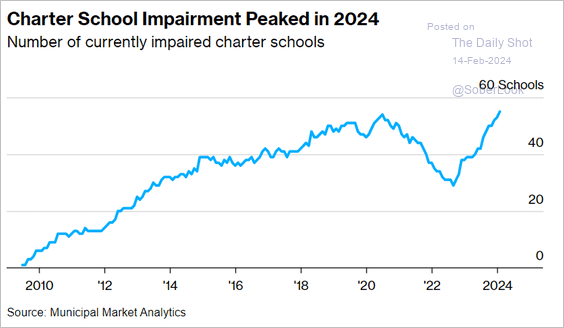 Source: @markets Read full article
7. Valentine’s Day-related gift search activity by state:
 Source: Estately Blog Read full article
——————–
Back to Index