
The Daily Shot: 16-Feb-24
• The United States
• Canada
• The United Kingdom
• The Eurozone
• Europe
• Japan
• China
• Emerging Markets
• Cryptocurrency
• Energy
• Equities
• Alternatives
• Credit
• Global Developments
• Food for Thought
The United States
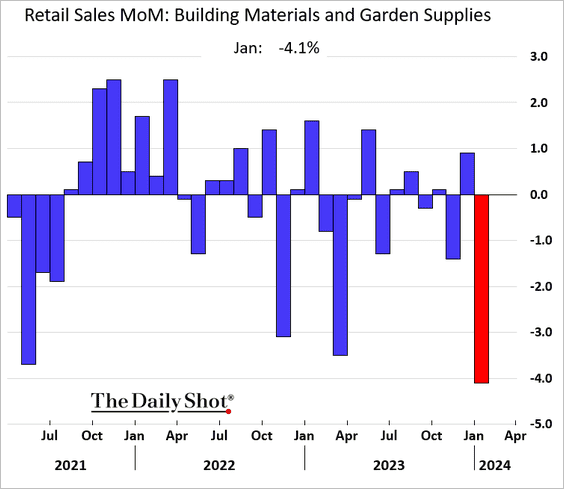
1. Retail sales declined in January, …
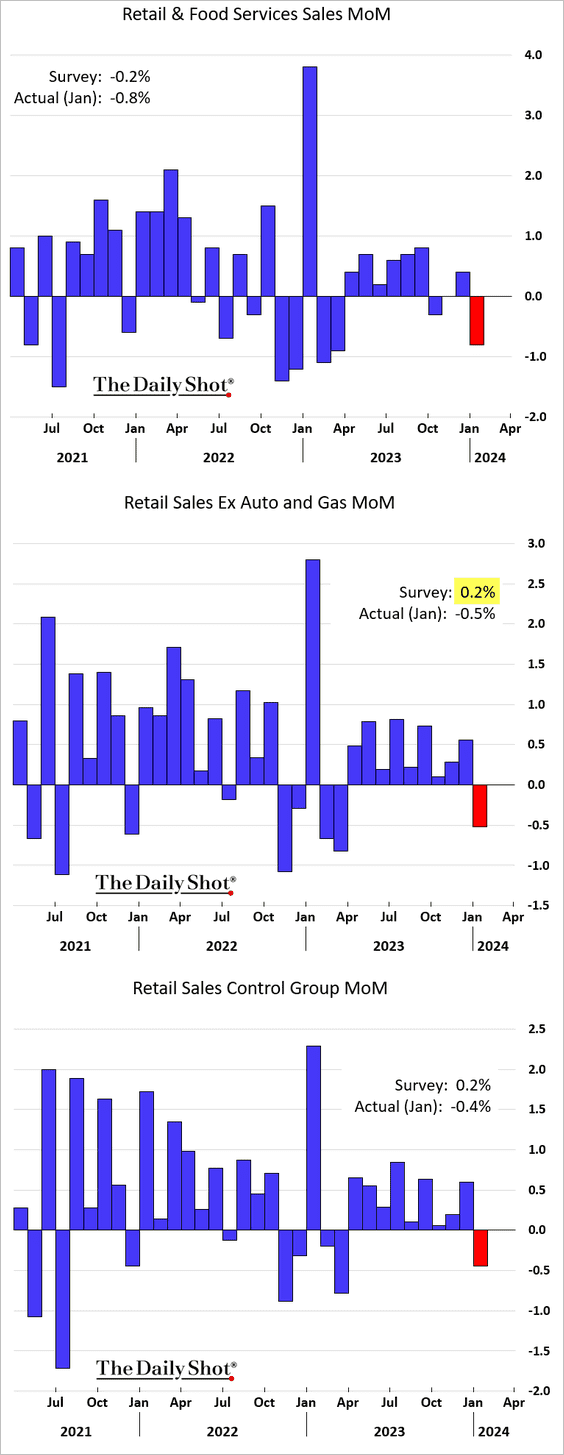
… partly driven by adverse weather conditions.
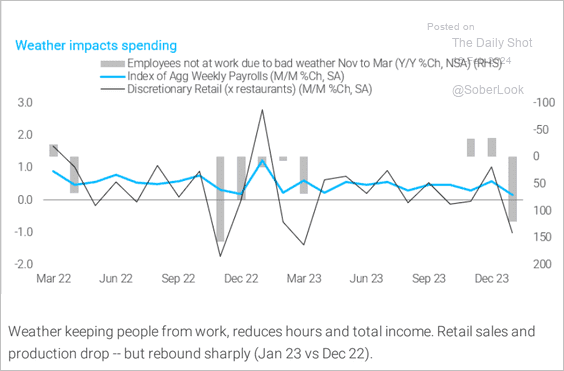 Source: TS Lombard
• Here are the contributions to changes in retail sales.
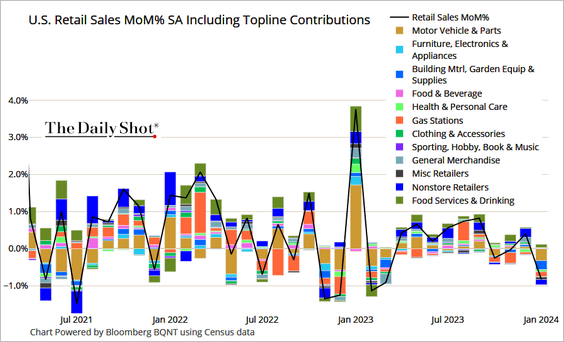 Source: @TheTerminal, Bloomberg Finance L.P.
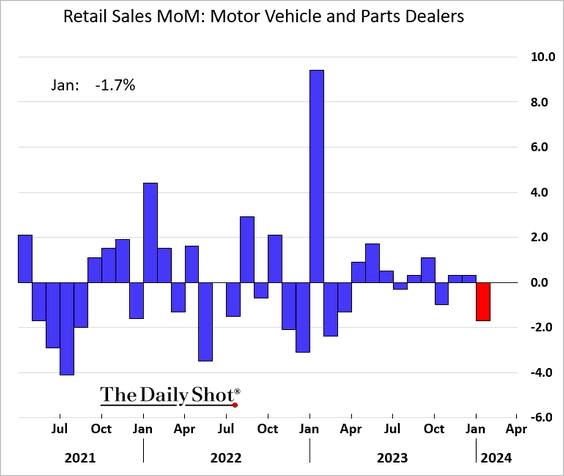
– These charts show last month’s downturn in the sales of vehicles and building materials.
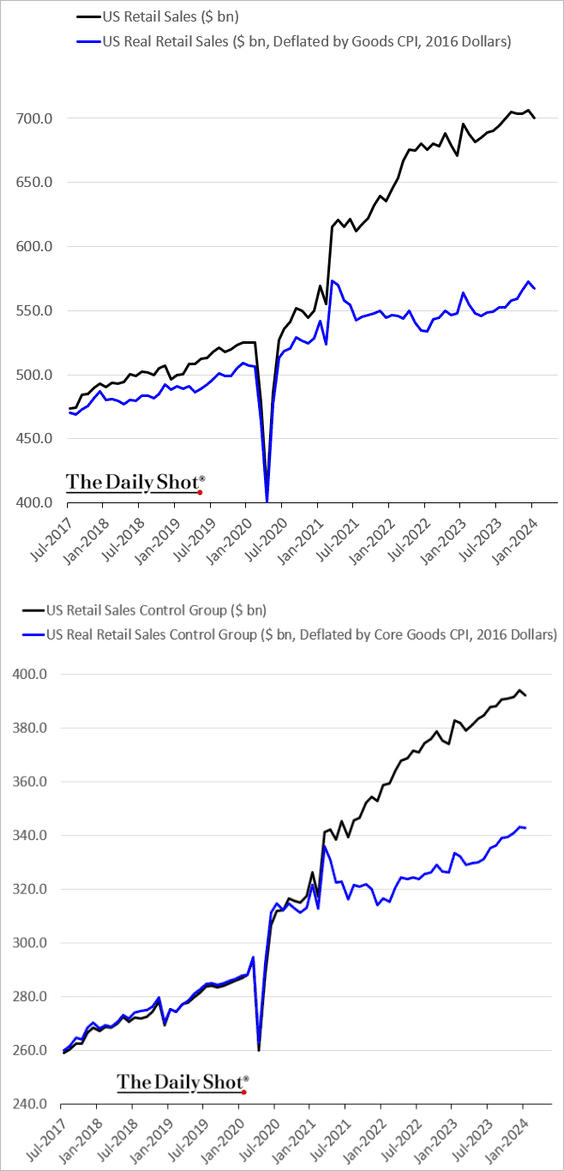
• Here is a look at the evolution of real retail sales.
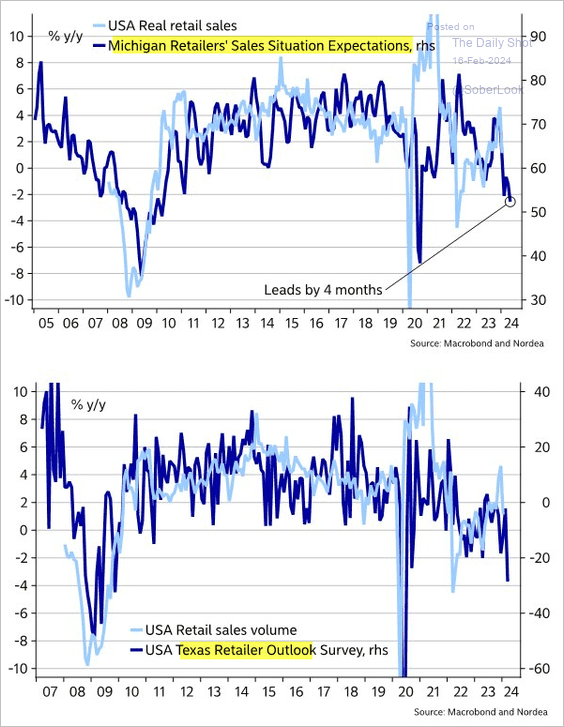
• Surveys point to downside risks for retail sales going forward.
 Source: @MikaelSarwe
——————–
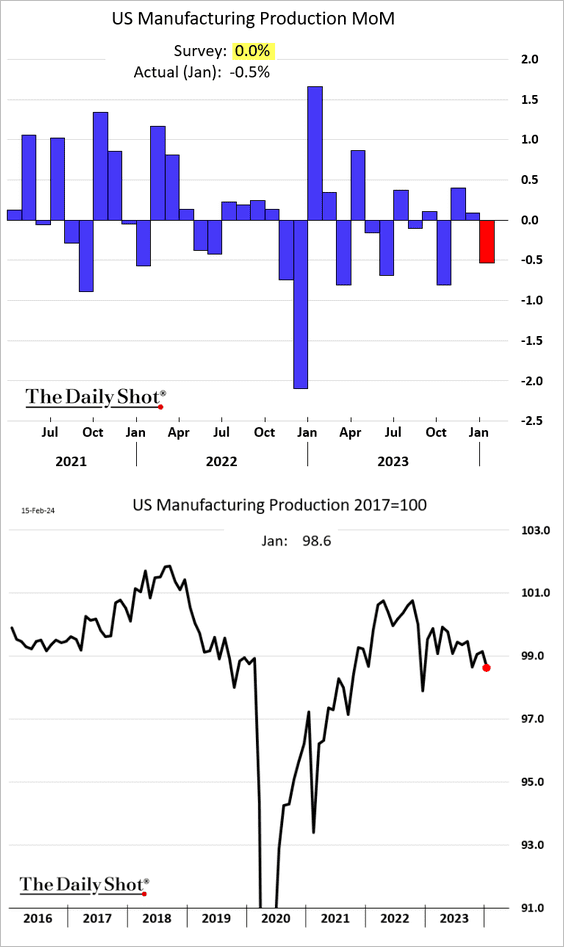
2. Manufacturing output contracted in January, also driven by frigid weather in parts of the country.
 Source: Reuters Read full article
Here are the changes excluding vehicle production.
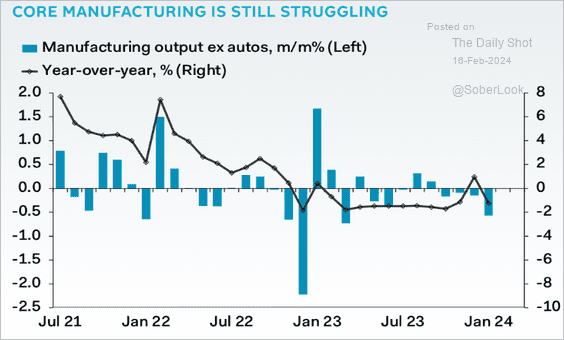 Source: Pantheon Macroeconomics
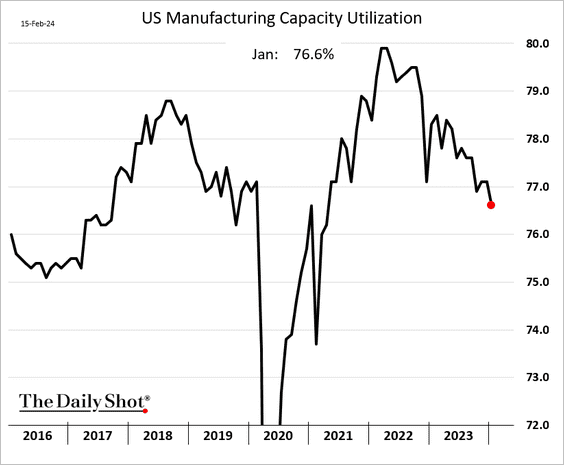
• Capacity utilization continues to slide.
——————–
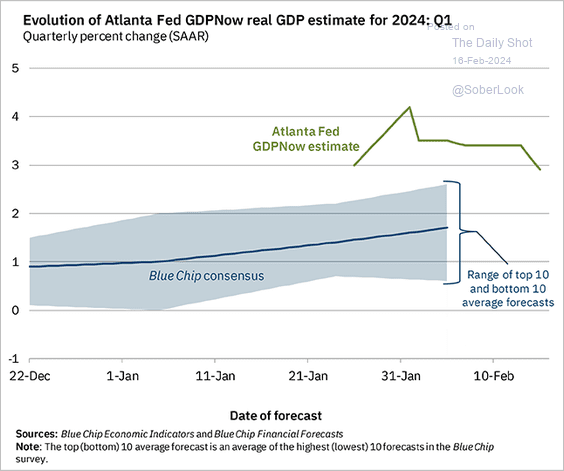
3. The Q1 growth estimate from the Atlanta Fed’s GDPNow model dropped below 3% (annualized) after the retail sales and industrial production reports.
 Source: Federal Reserve Bank of Atlanta
The GDPNow measure is currently consistent with Goldman’s GDP tracker.
![]() Source: Goldman Sachs; @MikeZaccardi
Source: Goldman Sachs; @MikeZaccardi
——————–
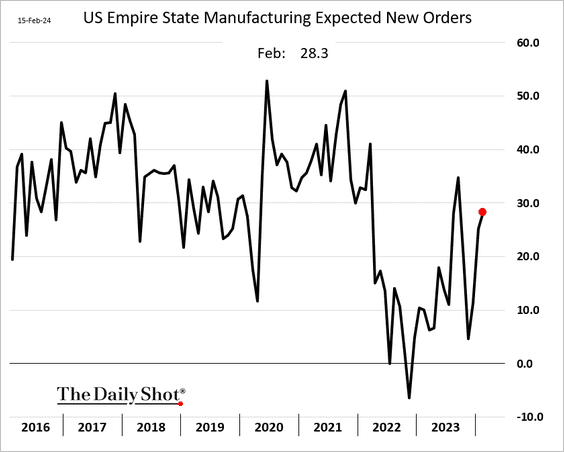
4. Regional Fed surveys signaled some improvement in factory activity.
• NY Fed’s manufacturing index:
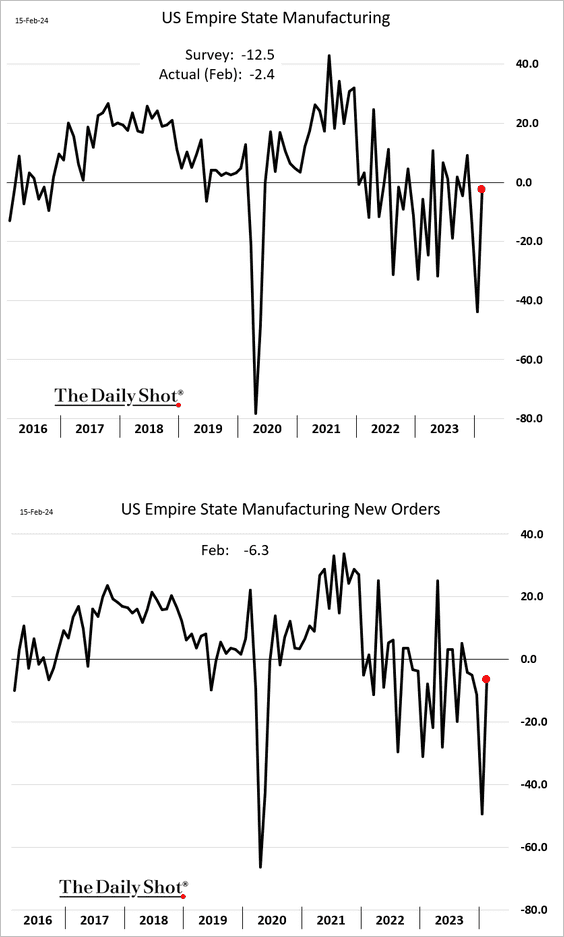
– Expected new orders:
• Philly Fed’s manufacturing index:
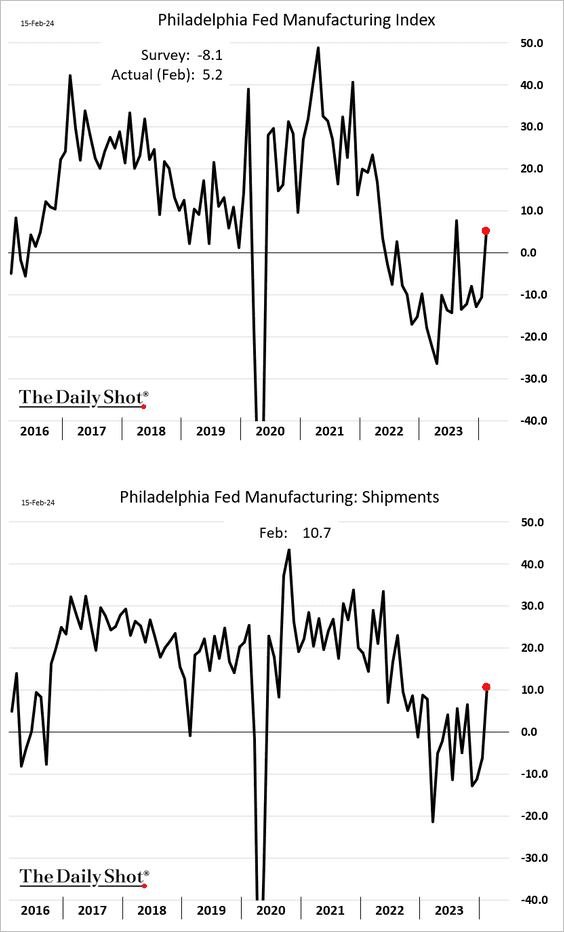
 Source: Morningstar Read full article
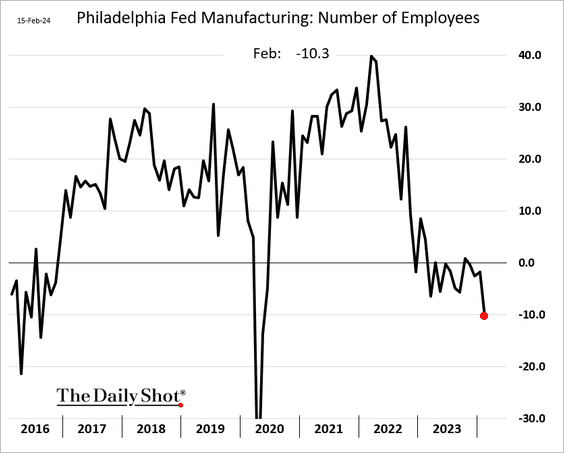
– Employment index (rapid deterioration):
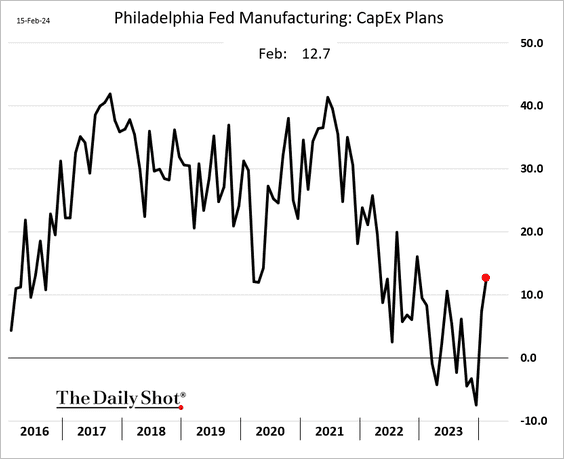
– CapEx plans (ongoing improvement):
• The Philly Fed’s manufacturing index signals stronger activity at the national level.
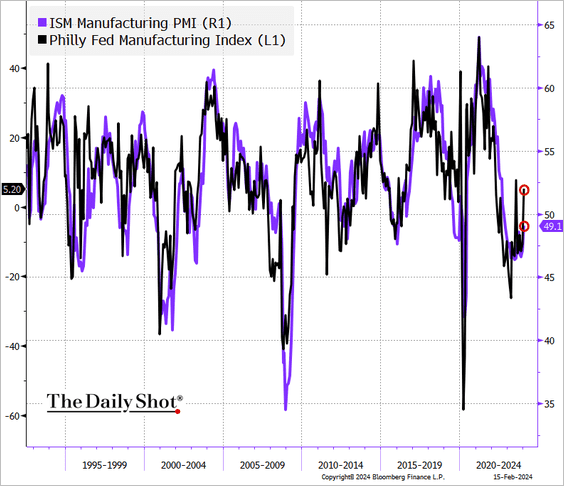 Source: @TheTerminal, Bloomberg Finance L.P.
——————–
5. Homebuilder sentiment improved further this month.
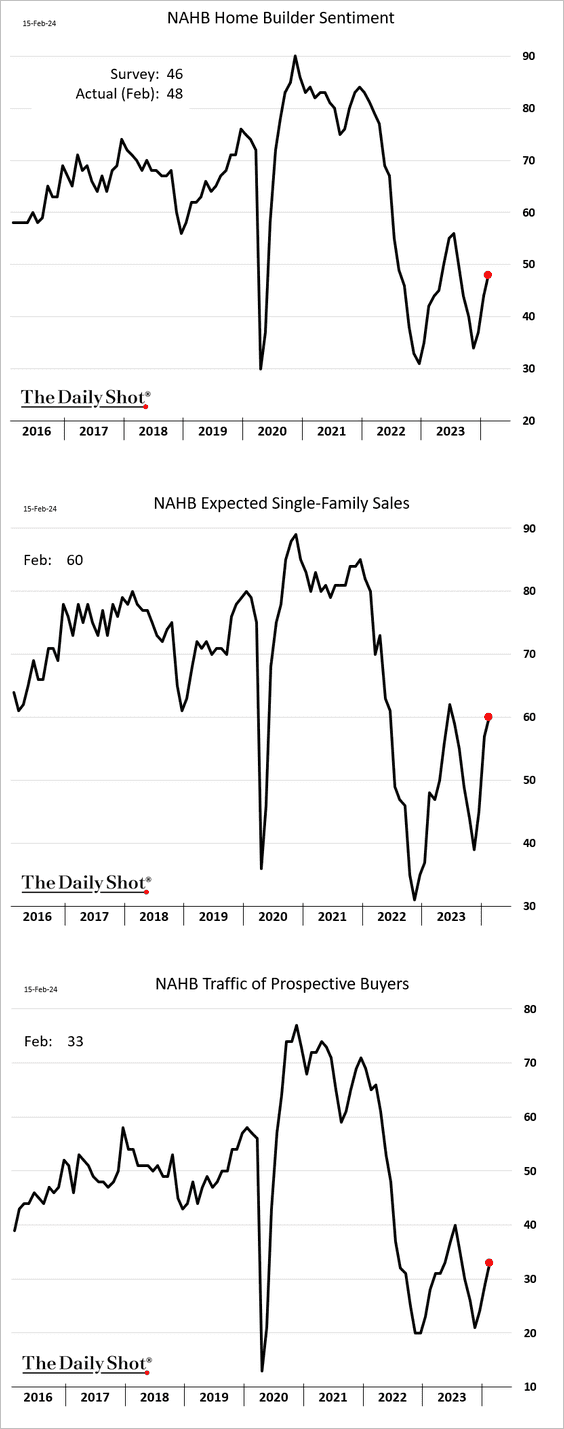
 Source: HousingWire Read full article
——————–
6. US import prices unexpectedly jumped in January.
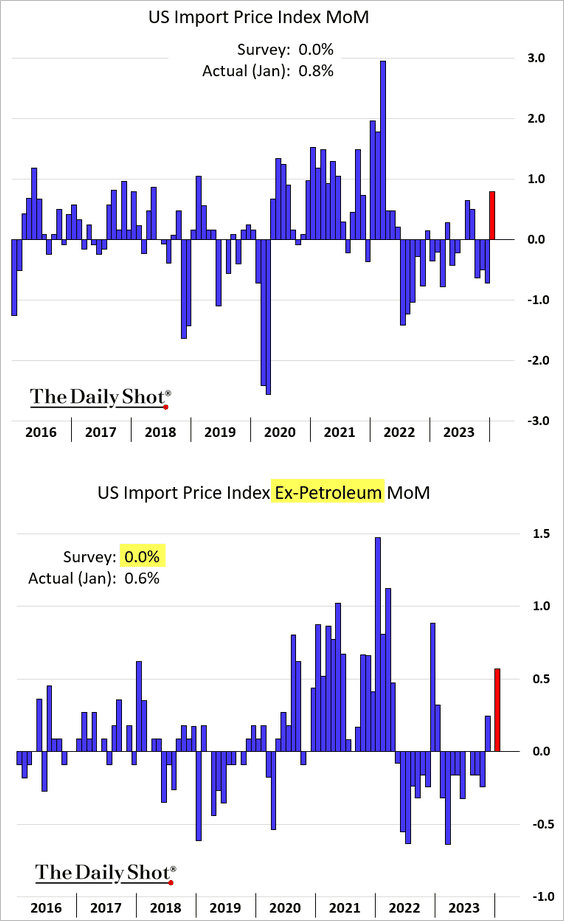
 Source: Reuters Read full article
——————–
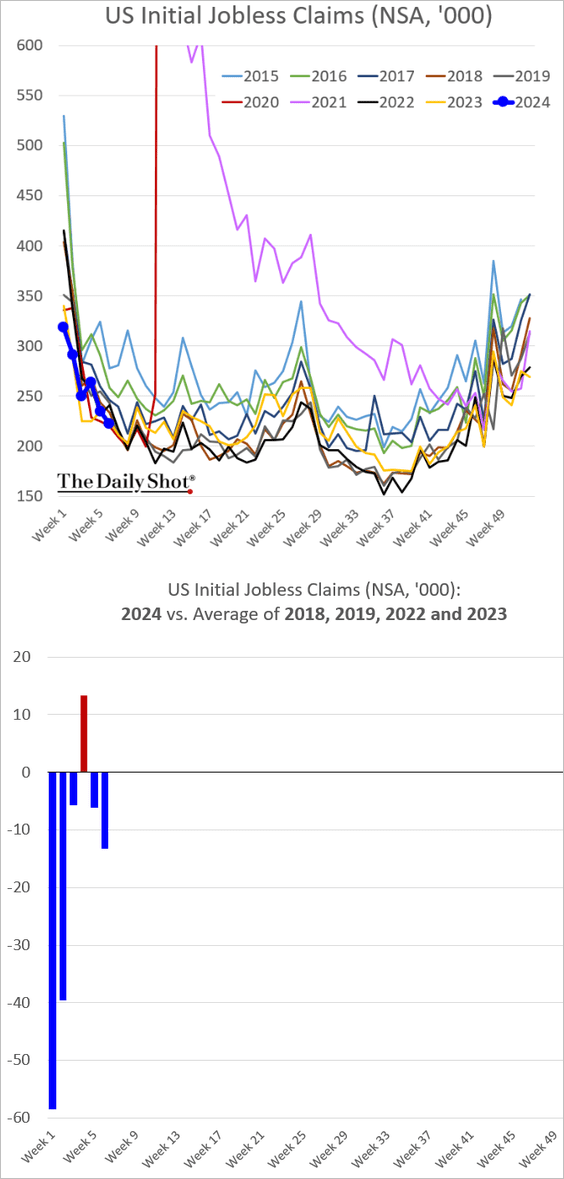
7. Last week, initial jobless claims held near their lowest levels in years.
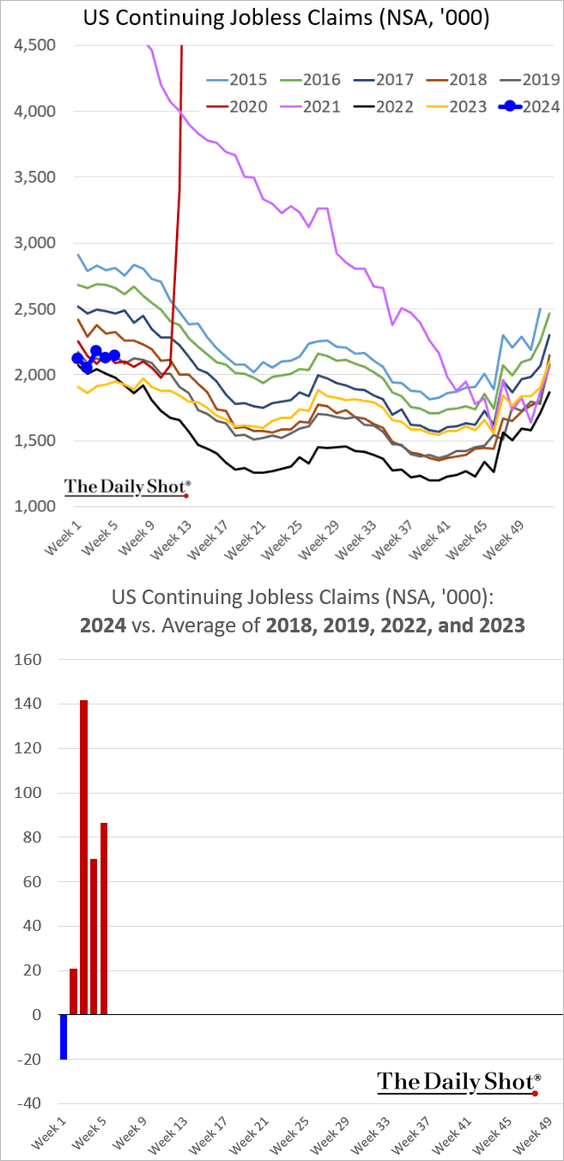
• Continuing claims are still running above the levels we saw in recent years (excluding the COVID shock of 2020 and 2021).
Back to Index
Canada
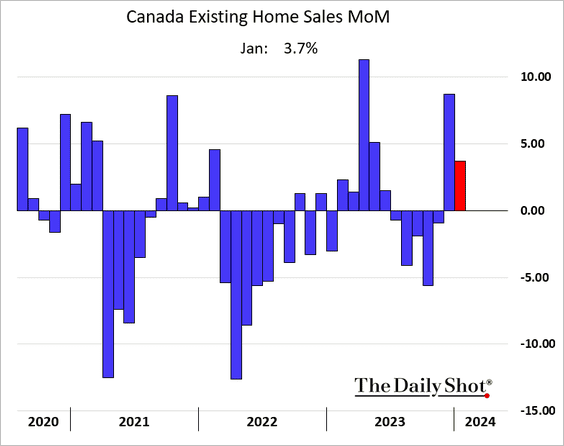
1. Existing home sales increased last month.
2. Housing starts softened in January.
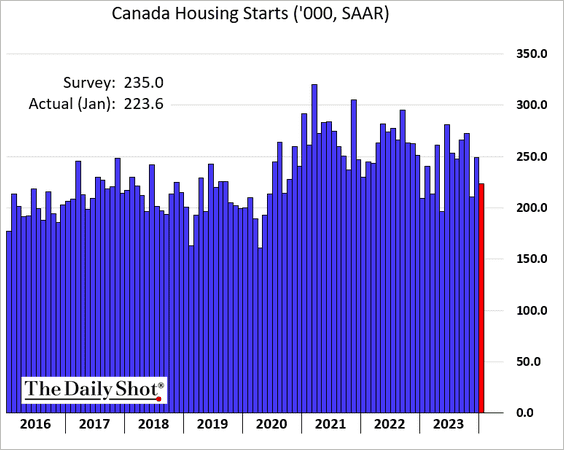
 Source: Reuters Read full article
——————–
3. Here is a look at home price appreciation and the sales-to-new listings ratio.
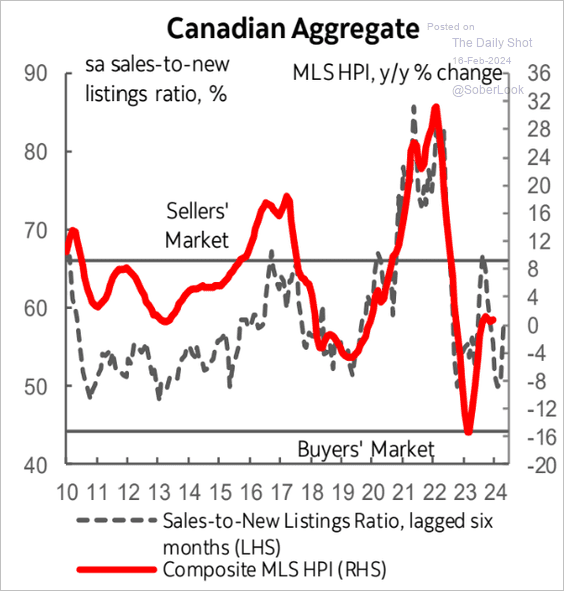 Source: Scotiabank Economics
Back to Index
The United Kingdom
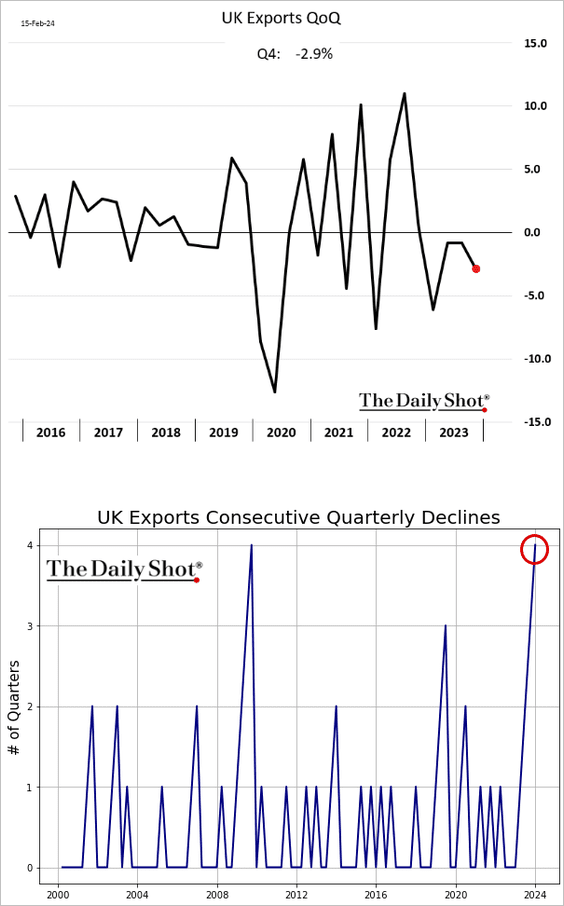
1. As we saw yesterday, the economy entered a technical recession last quarter. However, the weakness was driven by government spending and net exports. Domestic demand was better than the headline GDP figure suggests.
– It’s been a while since UK exports saw four quarterly declines in a row.
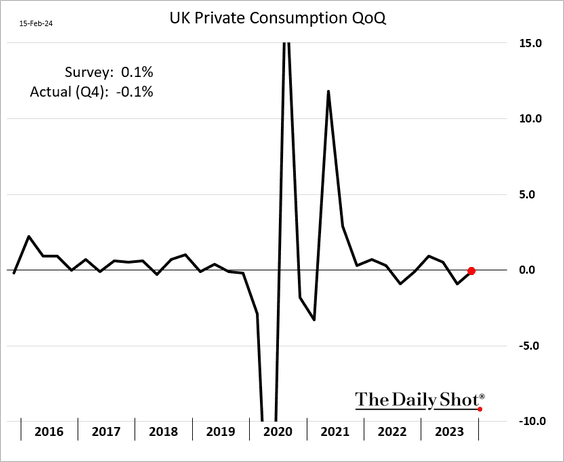
– Consumer spending edged lower last quarter.
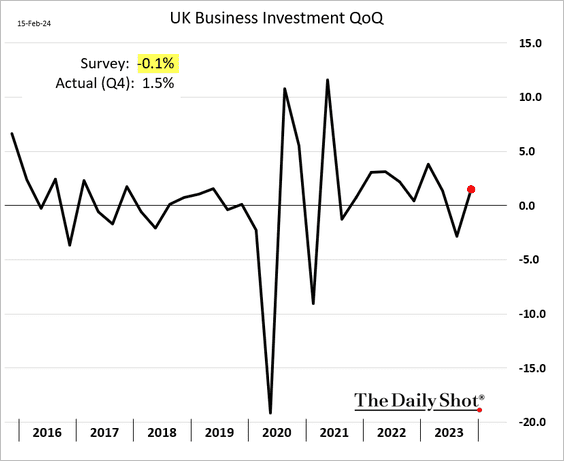
– Business investment unexpectedly jumped in Q4.
– This chart shows the COVID-era UK GDP recovery relative to DM peers.
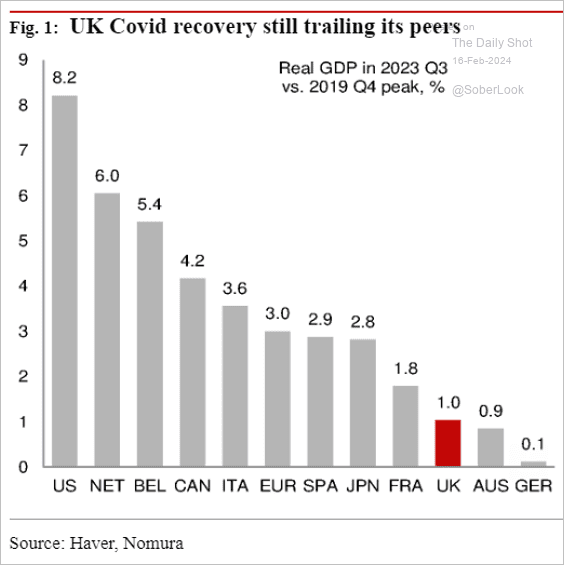 Source: Nomura Securities
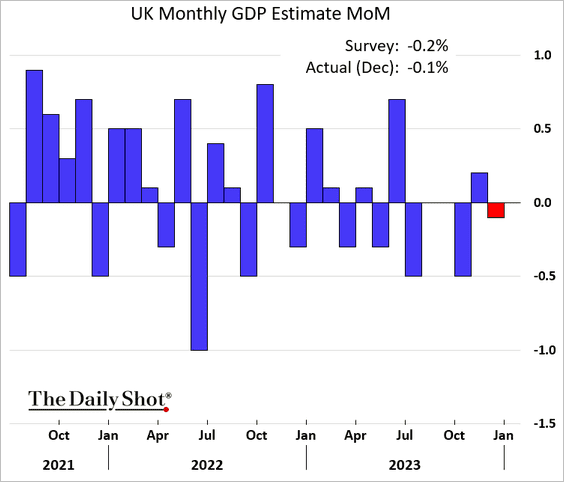
• The December monthly GDP decline was smaller than expected.
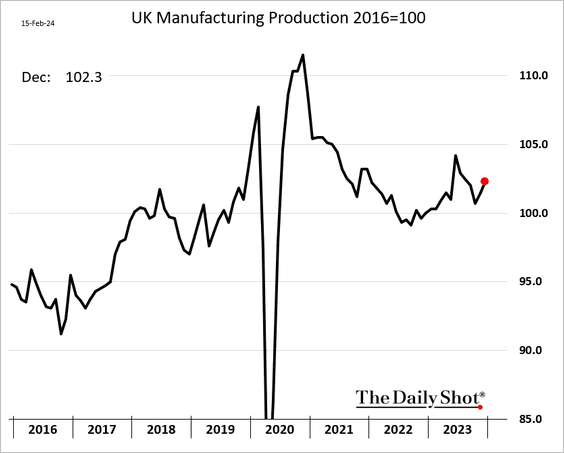
– Services output edged lower, …
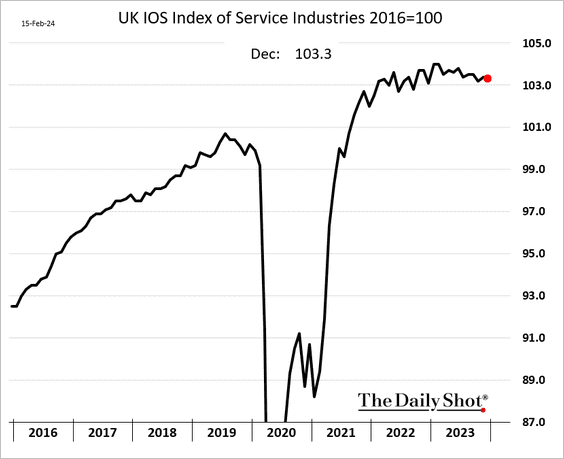
… but manufacturing production increased again.
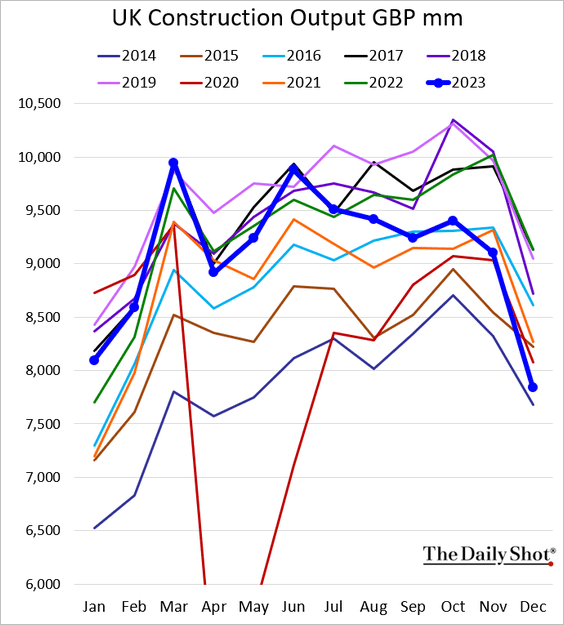
– Construction activity has been very soft, dipping below 2020 levels in December.
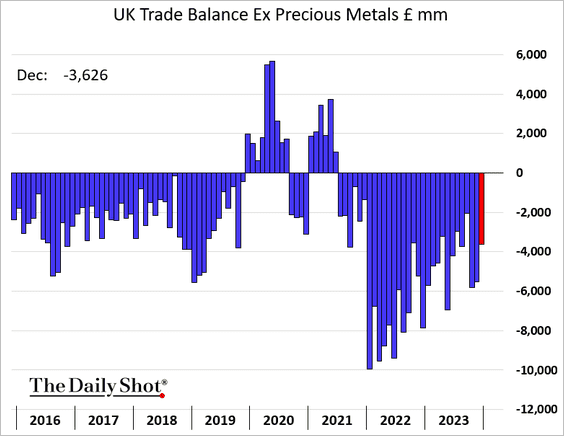
– The trade deficit narrowed.
——————–
2. Here is a look at the latest voting intention polls.
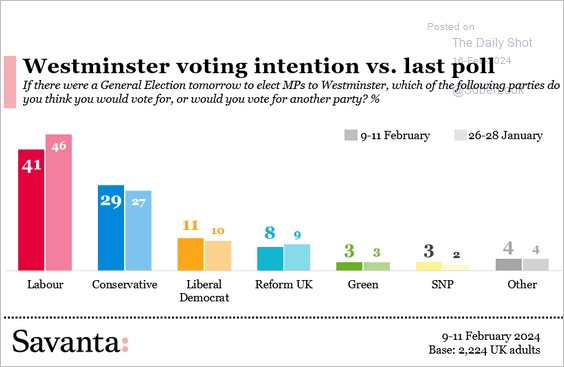 Source: @Savanta_UK
3. This map shows the distribution of people aged 100 and over.
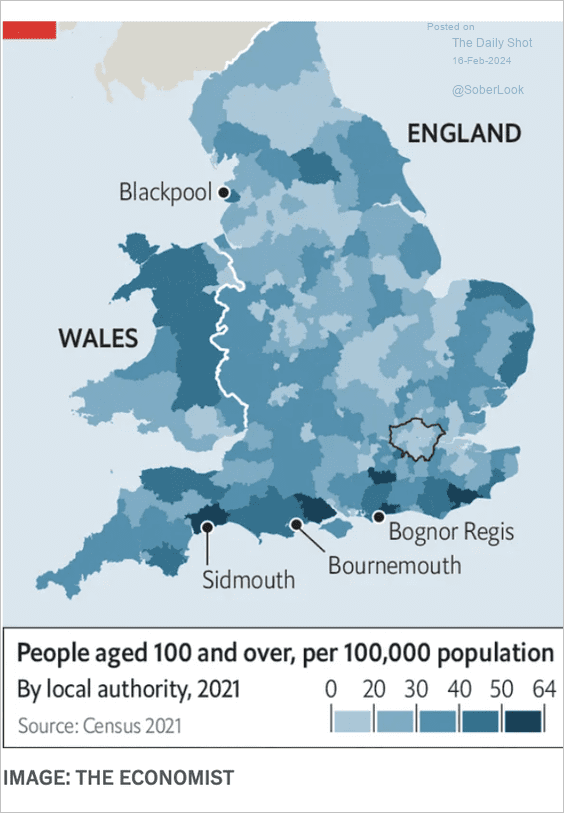 Source: The Economist Read full article
Back to Index
The Eurozone
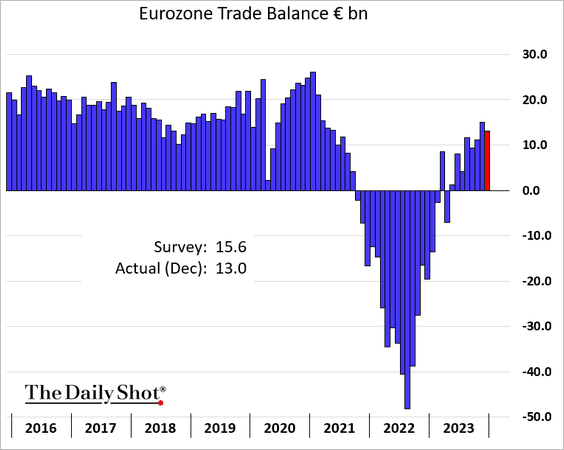
1. The euro-area trade surplus was smaller than expected in December.
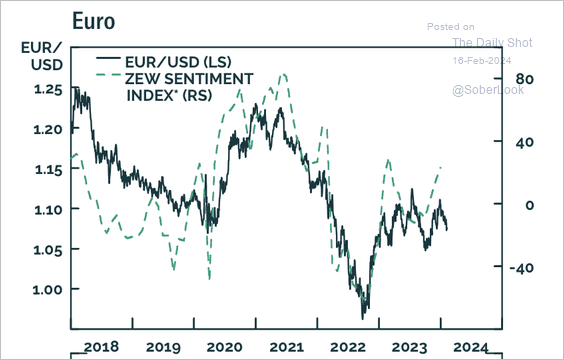
2. EUR/USD has diverged from the ZEW Sentiment Index.
 Source: BCA Research
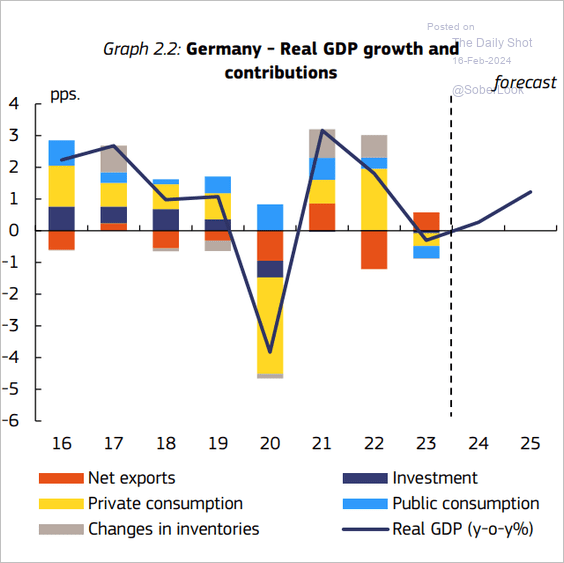
3. The European Commission sees a slow recovery for Germany’s economy.
 Source: European Commission
Back to Index
Europe
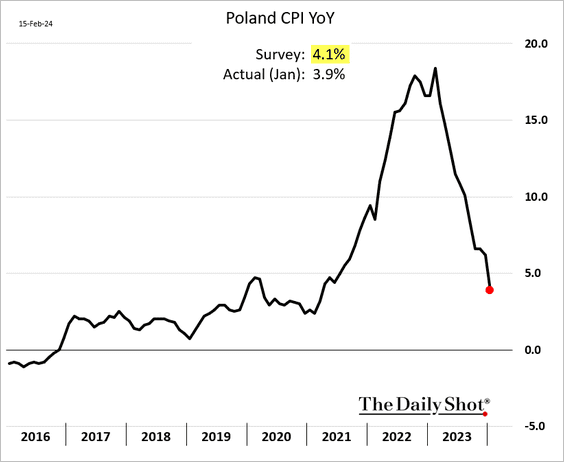
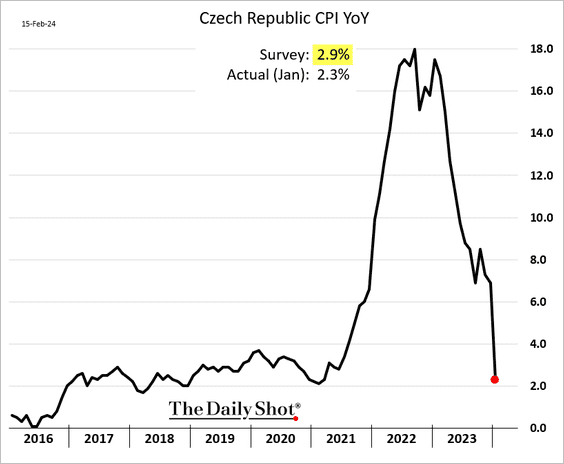
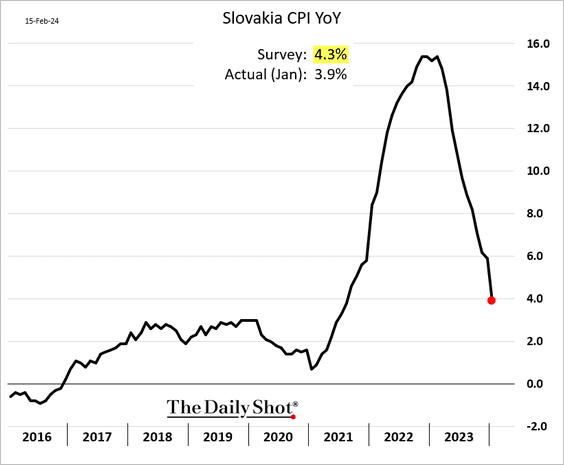
1. Consumer inflation in Central European economies is experiencing a rapid deceleration.
– Poland:
– Czech Republic:
– Slovakia:
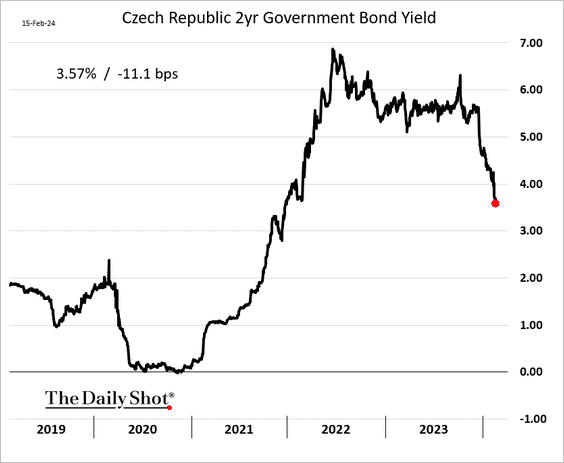
• Bond yields are following inflation lower.
——————–
2. Here is a look at recession risks in Europe.
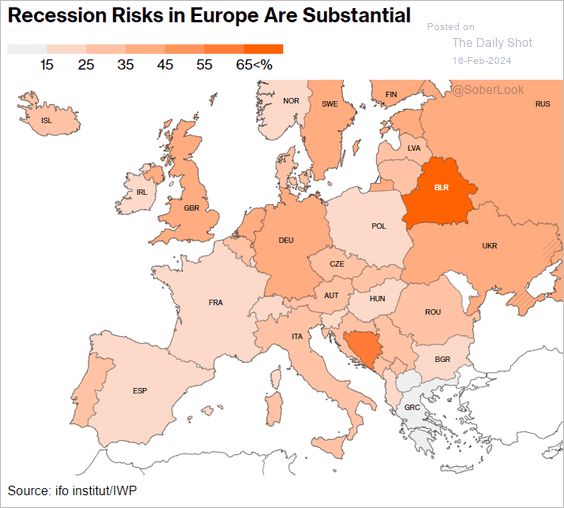 Source: @economics Read full article
3. This map illustrates the distribution of female scientists and engineers across the EU.
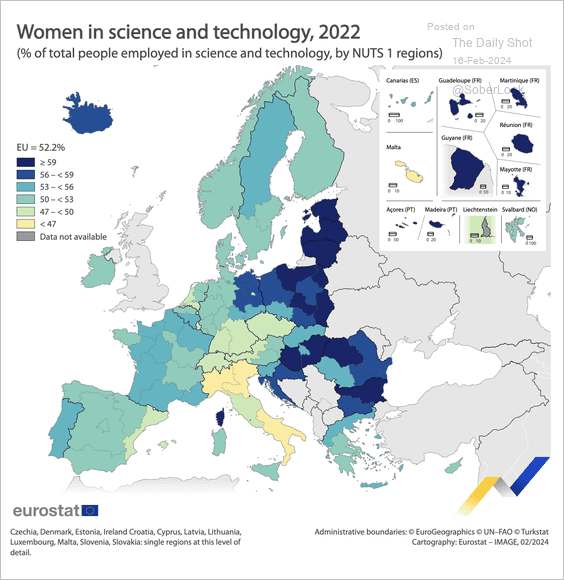 Source: Eurostat Read full article
Back to Index
Japan
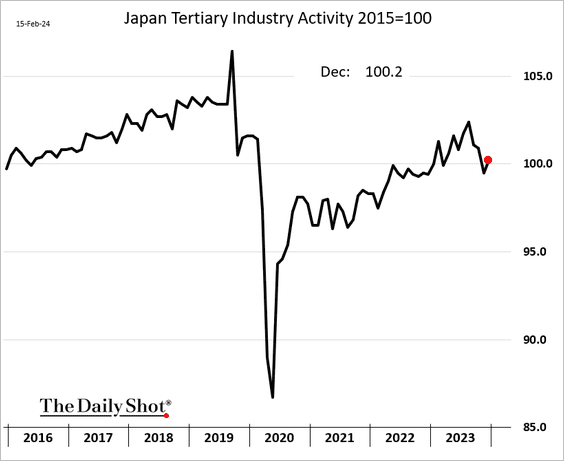
1. Services activity edged higher in December.
2. Corporate profits in Japan have experienced robust growth throughout the COVID era.
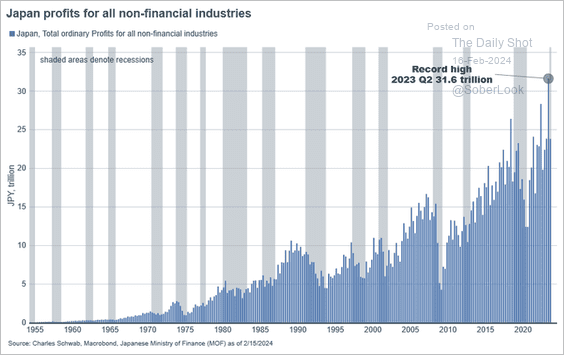 Source: @JeffreyKleintop
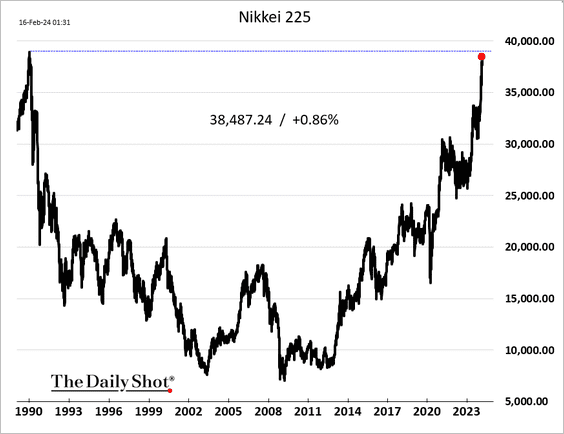
3. The Nikkei 225 is 1.1% percent away from its record high.
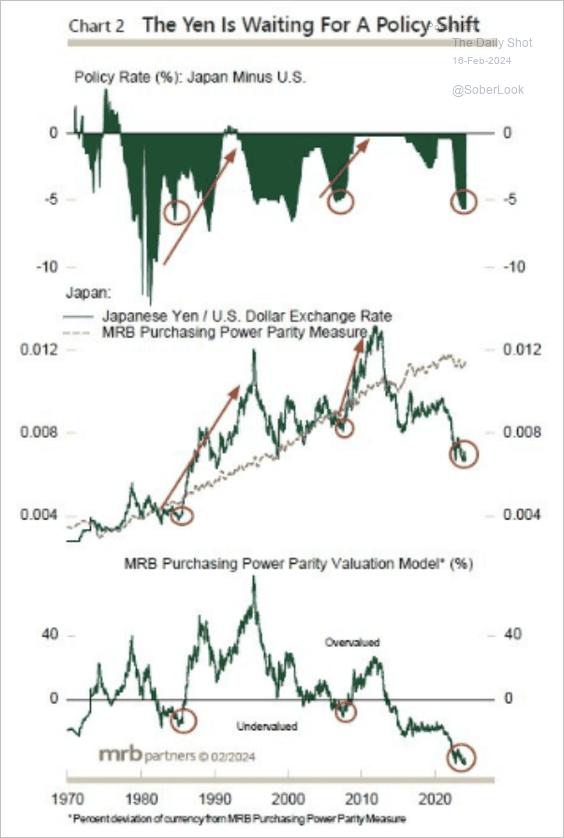
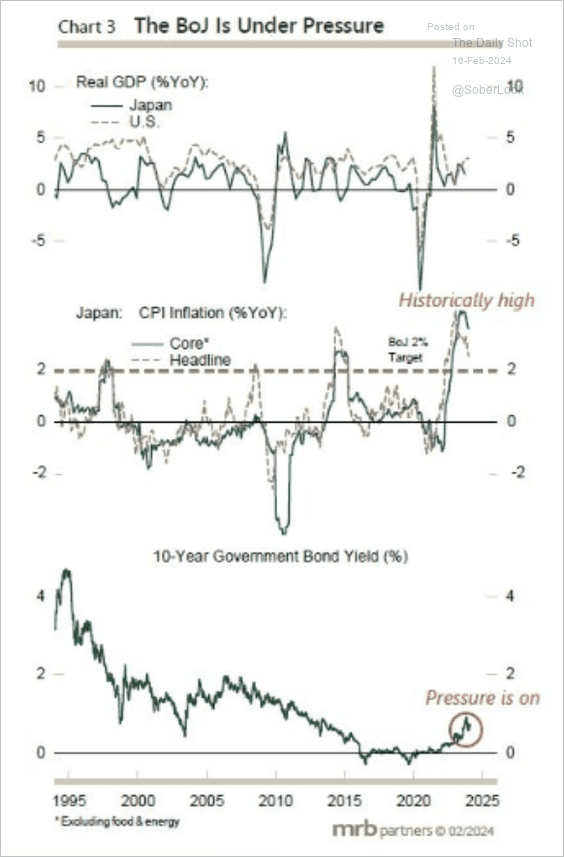
4. Is the yen too weak, given the US-Japan rate differential?
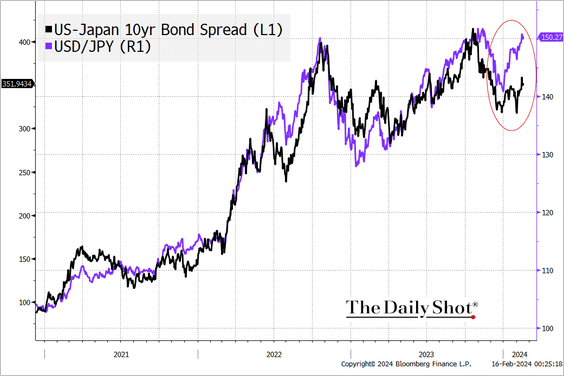
• Fundamentals show that the yen is oversold versus the dollar. A BoJ policy shift away from easing could limit the rise in USD/JPY. (2 charts)
 Source: MRB Partners
 Source: MRB Partners
Back to Index
China
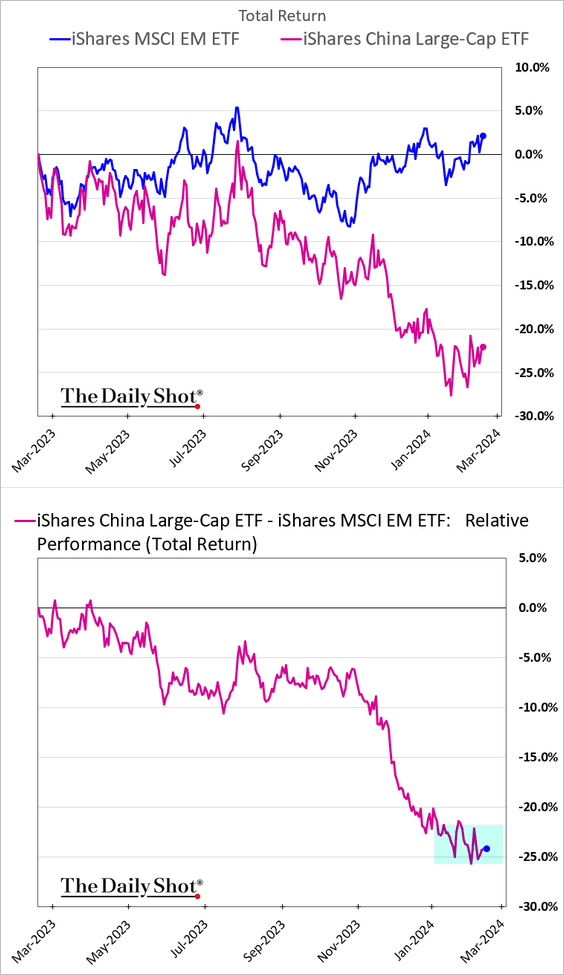
1. Is China’s equity underperformance versus EM peers finally over?
2. China’s property market remains in the doldrums.
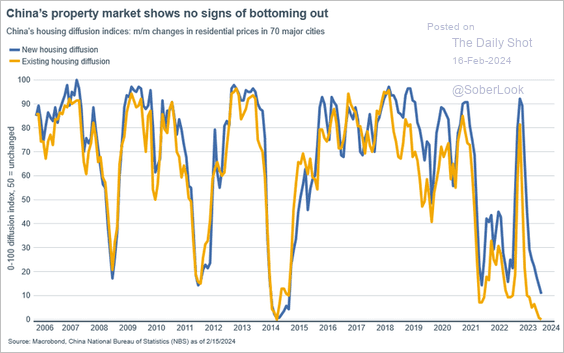 Source: @JeffreyKleintop
3. Amid a price war, auto manufacturers are exacerbating deflationary pressures in China.
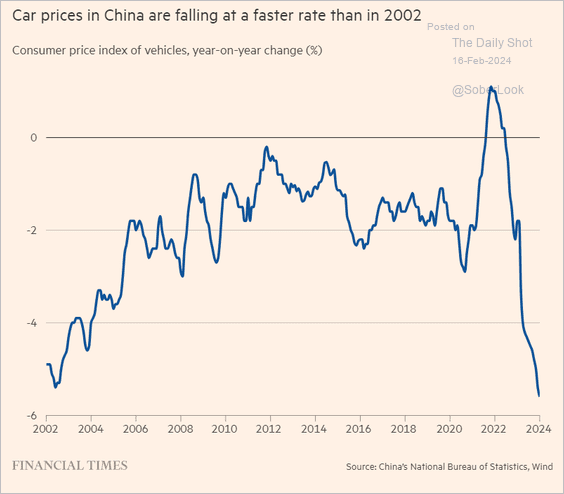 Source: @financialtimes Read full article
4. Much of the past decade’s stimulus spending has been financed by local governments.
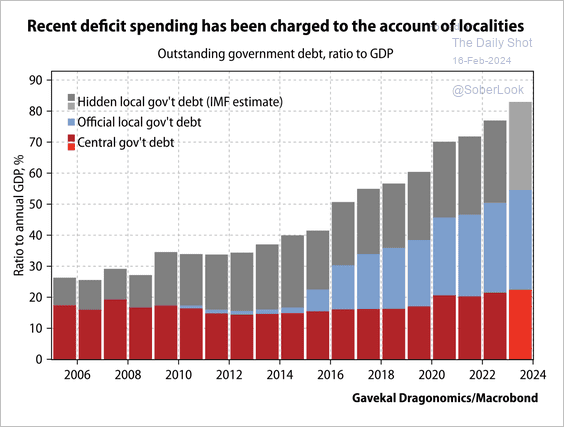 Source: Gavekal Research
• China has low government revenue for its level of debt relative to other G20 nations.
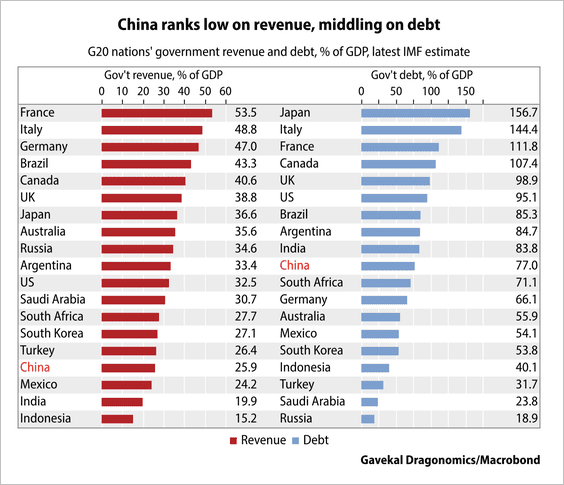 Source: Gavekal Research
Back to Index
Emerging Markets
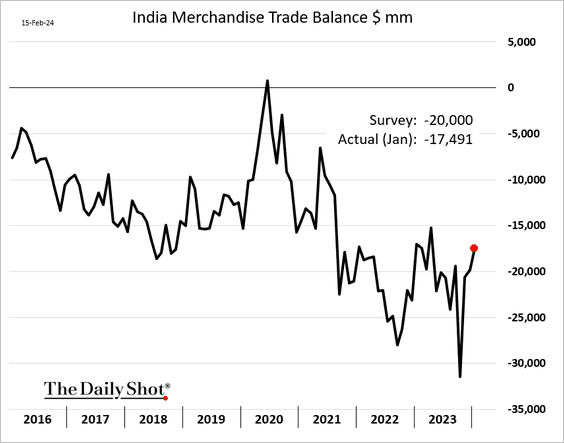
1. India’s trade deficit narrowed last month.
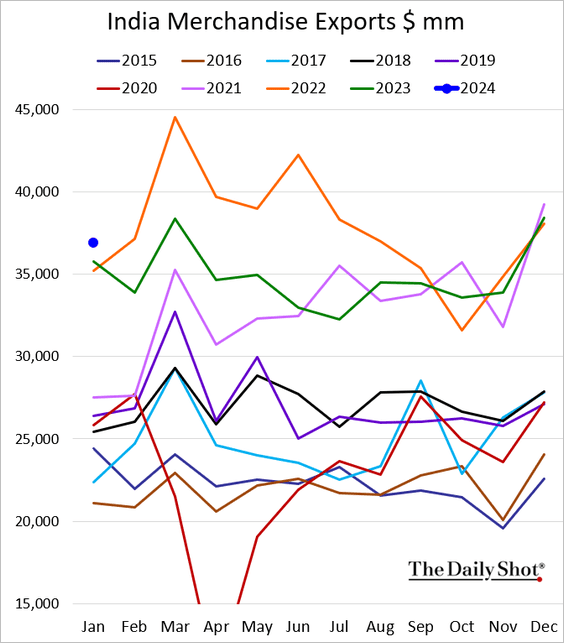
• Exports hit a new high for this time of the year.
——————–
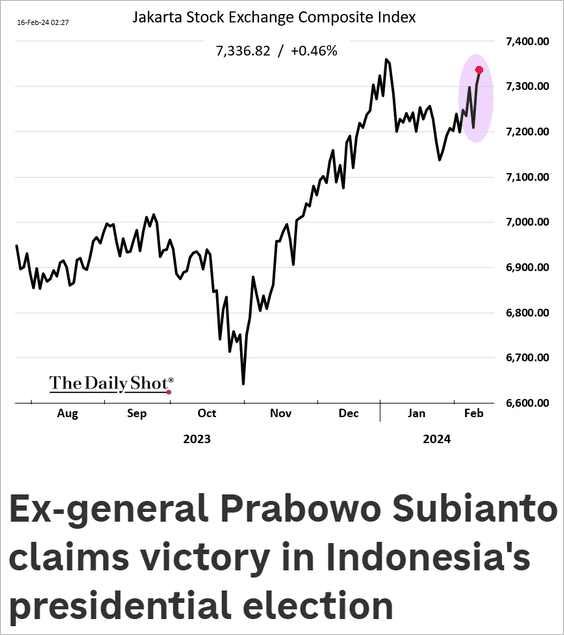
2. Markets cheered Prabowo Subianto’s likely victory in Indonesia.
 Source: NPR Read full article
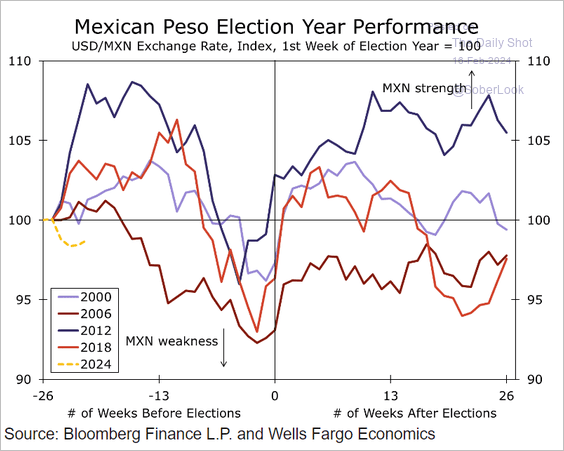
3. Here is a look at the Mexican peso’s performance in election years.
 Source: Wells Fargo Securities
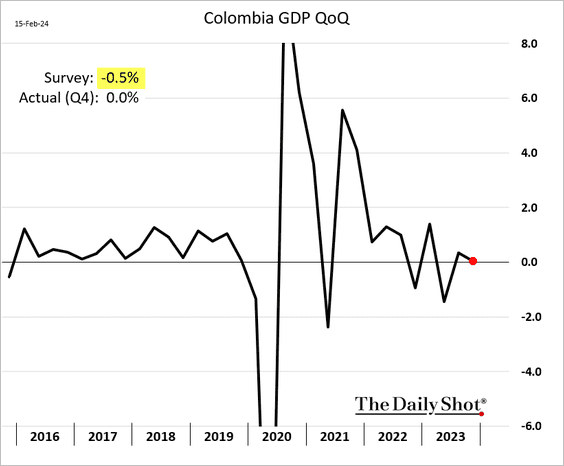
4. Colombia managed to avoid a GDP contraction last quarter.
Back to Index
Cryptocurrency
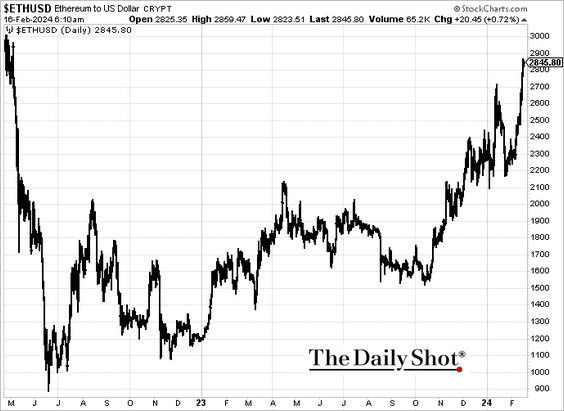
1. Ether has been outperforming bitcoin in recent days, …
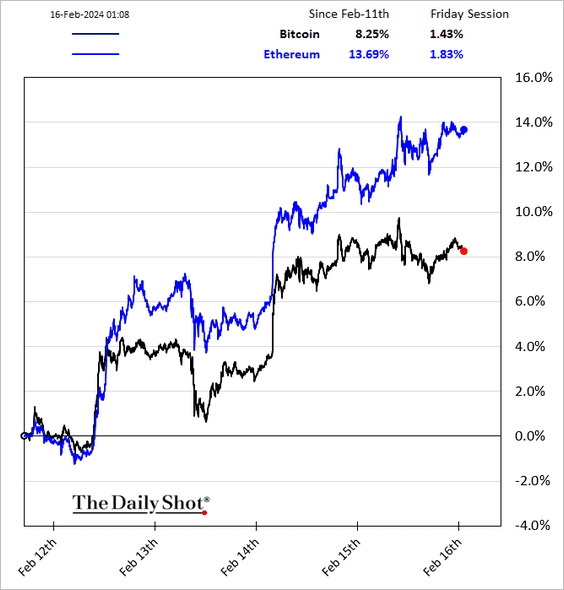
… blasting past $2,800.
——————–
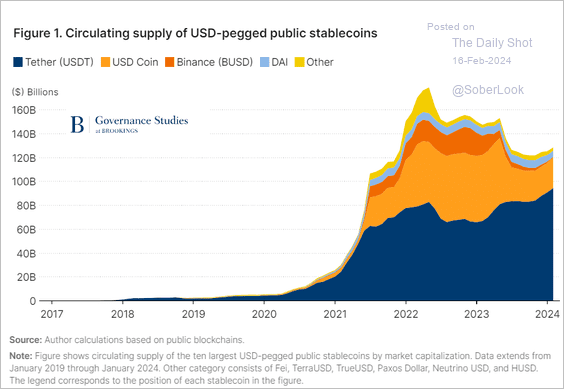
2. This chart shows the evolution of stablecoin supply.
 Source: Brookings Read full article
Back to Index
Energy
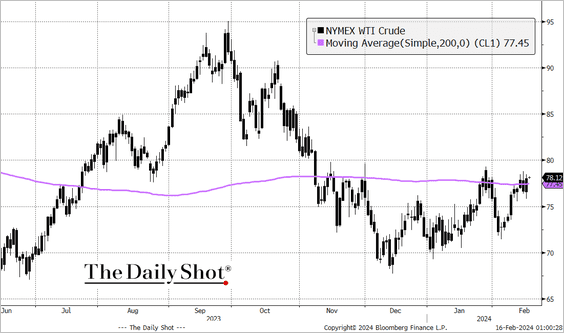
1. WTI crude is making another run at the 200-day moving average.
 Source: @TheTerminal, Bloomberg Finance L.P.
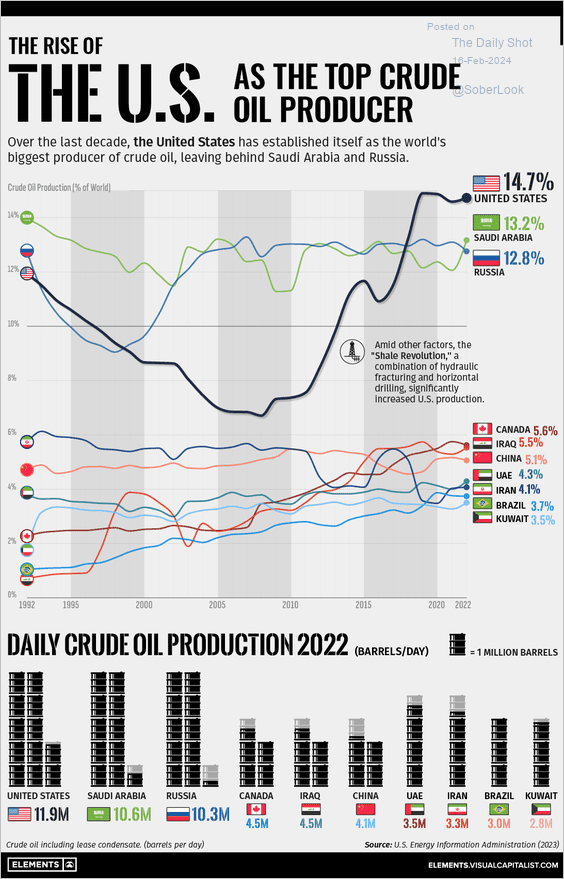
2. Here is a look at crude oil production by country.
 Source: Visual Capitalist Read full article
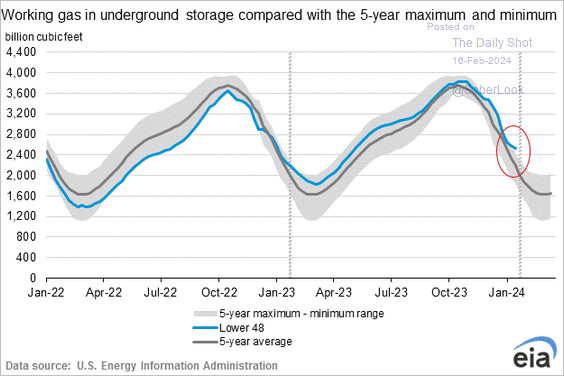
3. Next, we have some updates on natural gas.
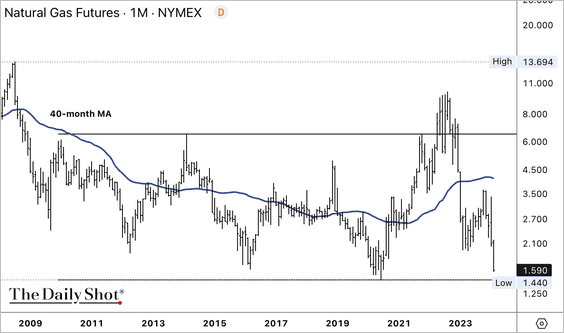
• US natural gas futures dipped below $1.60/MMBtu, …
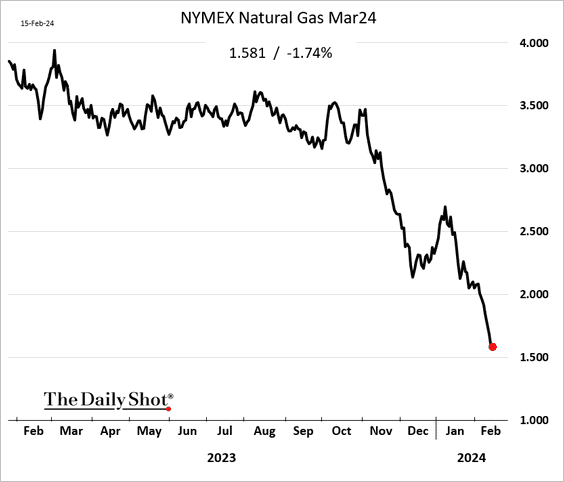
… and are trading at the bottom of their long-term range.
• Natural gas in storage is now well above the five-year range.
• Asia and Europe could drive the bulk of LNG demand this year.
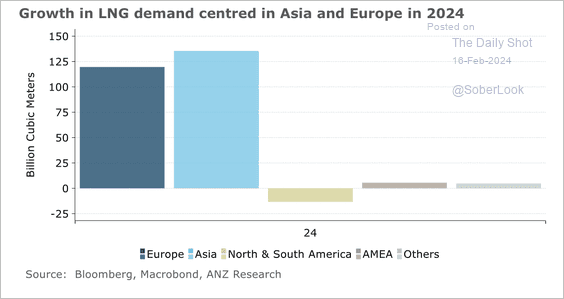 Source: @ANZ_Research
• The global LNG market remains in a deficit, which could support higher prices.
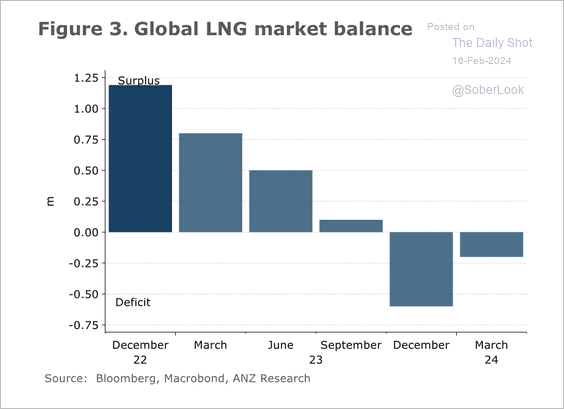 Source: @ANZ_Research
• This chart shows the expected growth in global LNG supply.
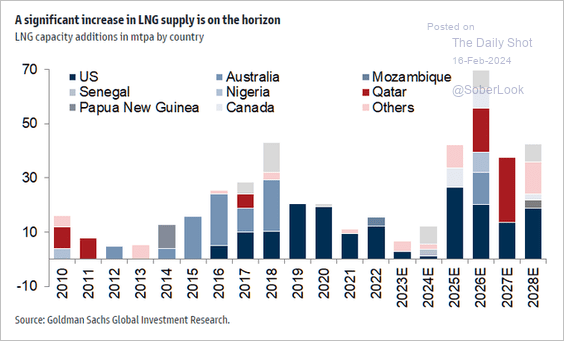 Source: Goldman Sachs; @MikeZaccardi
Back to Index
Equities
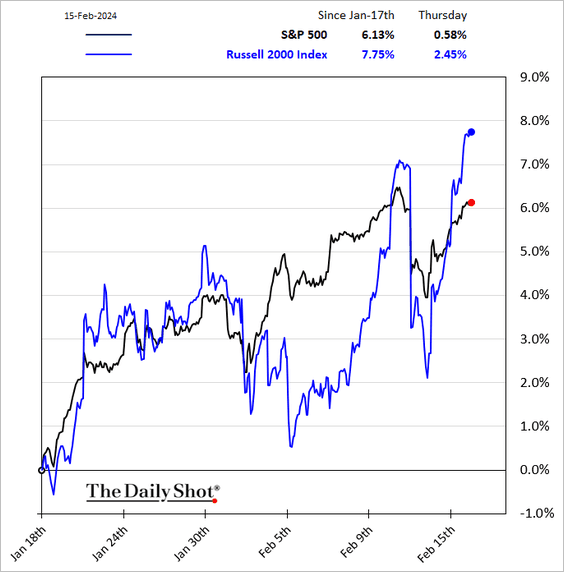
1. Let’s begin with some updates on small caps.
• The Russell 2000 has outperformed the S&P 500 in recent weeks.
• Here is a look at historical cycles in the relative performance of US small-caps.
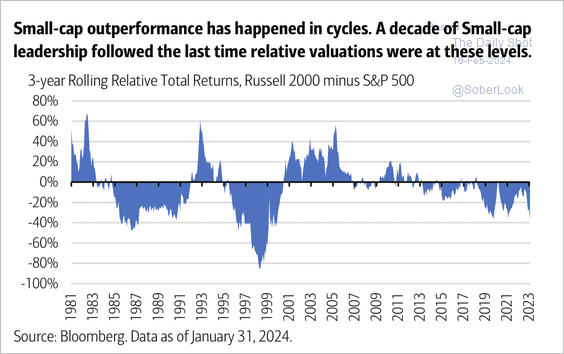 Source: Merrill Lynch
• Small-caps typically outperform during election years.
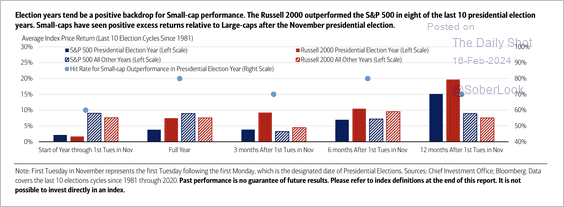 Source: Merrill Lynch
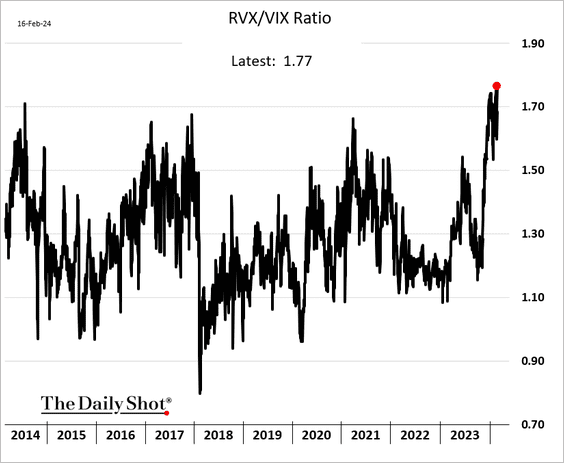
• The Russell 2000 implied volatility index (RVX) has sharply diverged from VIX, reflecting heightened volatility in small-cap stocks.
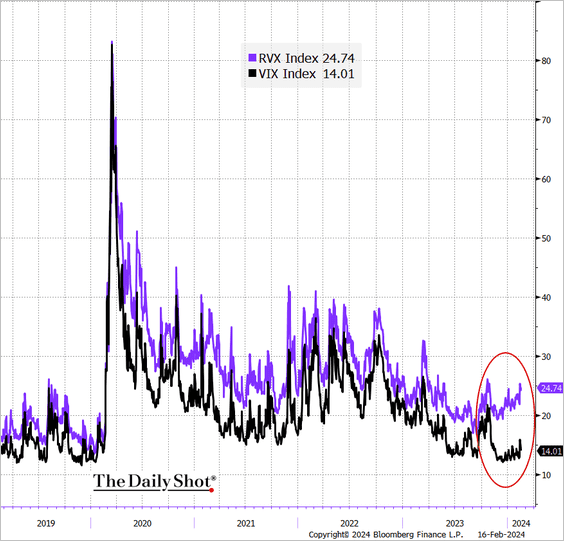
The ratio of the two volatility indicators surged this year.
——————–
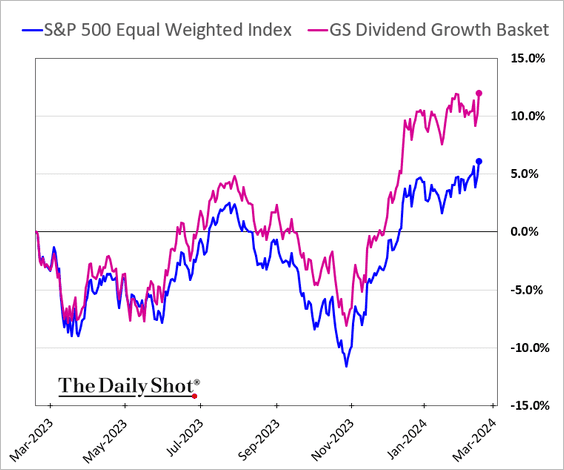
2. Dividend growers have been outperforming the average stock in the S&P 500.
• Low dividend payout ratios could indicate stronger dividend growth ahead, …
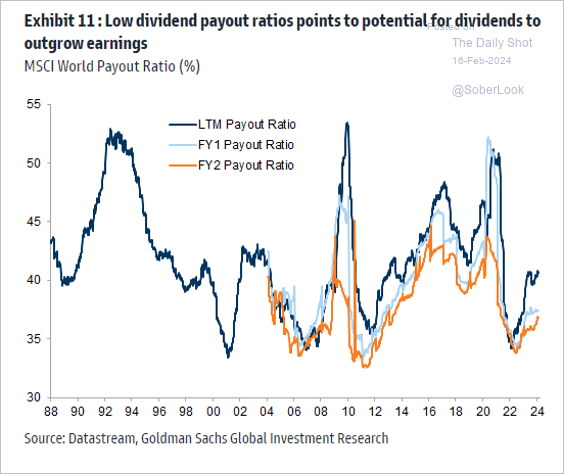 Source: Goldman Sachs; @MikeZaccardi
… which is what the market expects (DPS = dividend per share).
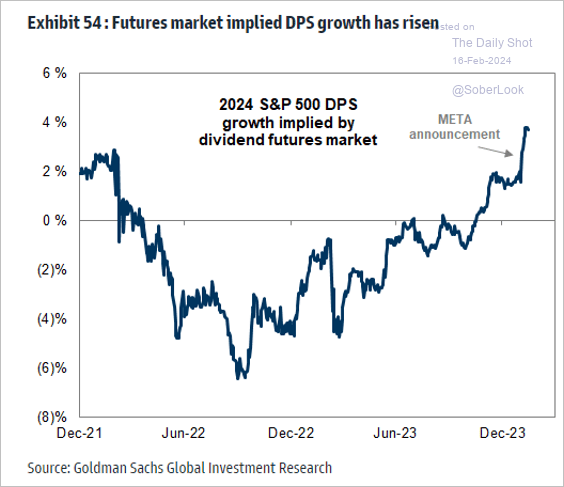 Source: Goldman Sachs; @MikeZaccardi
——————–
3. The S&P 500’s outperformance relative to the average stock in the index has reached extreme levels.
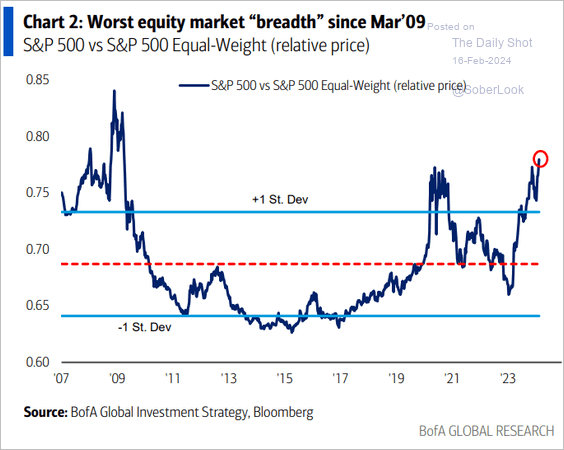 Source: BofA Global Research
4. Fund flows turned positive last week.
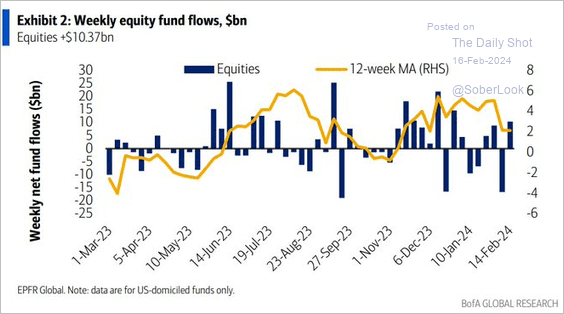 Source: BofA Global Research
5. This chart shows risk-adjusted returns across various markets.
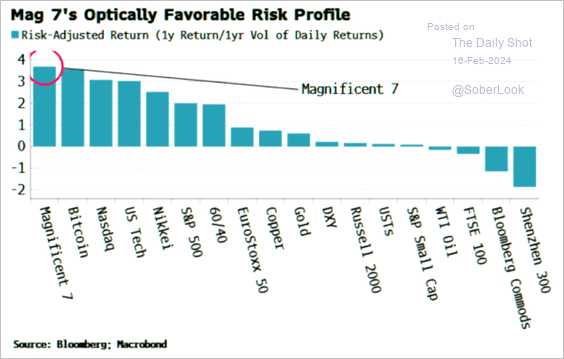 Source: Simon White, Bloomberg Markets Live Blog
6. The Q4 earnings surprises were positive but below average.
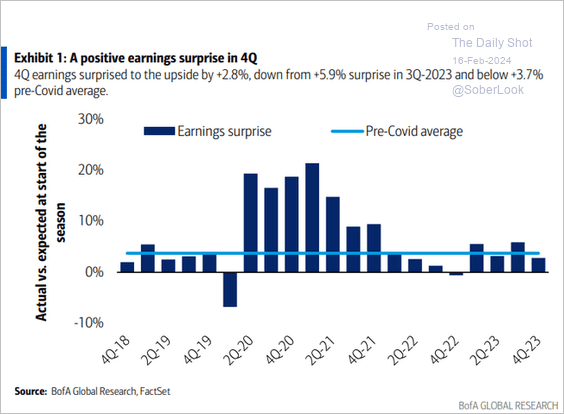 Source: BofA Global Research
7. Share buybacks have become a significant trend only in recent years, as illustrated by a comparison chart showing minimal activity in 1995 versus the extensive buybacks seen today.
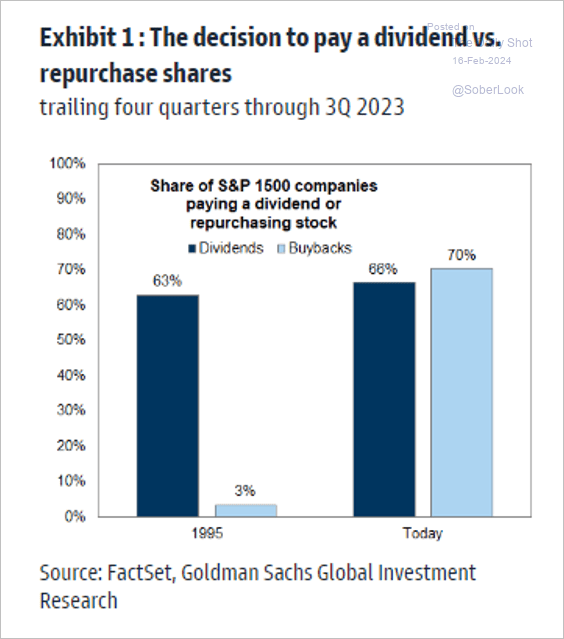 Source: Goldman Sachs; @MikeZaccardi
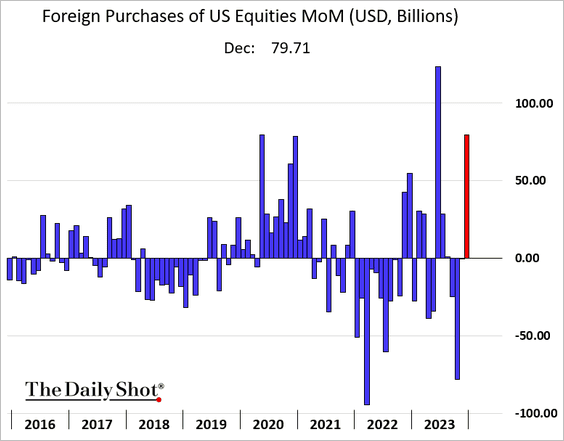
8. Foreigners jumped back into US equities in December.
9. Zero-day options account for half of all options trading activity.
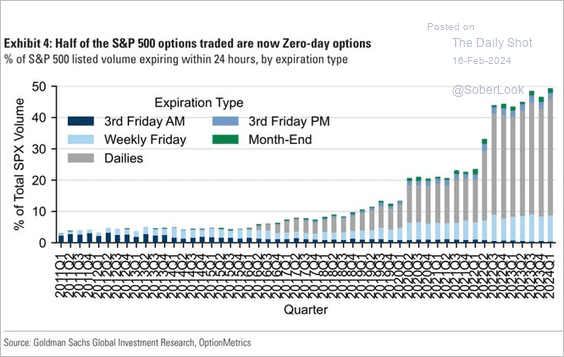 Source: Goldman Sachs; @WallStJesus
Back to Index
Alternatives
1. Investments in new hedge funds slowed last year.
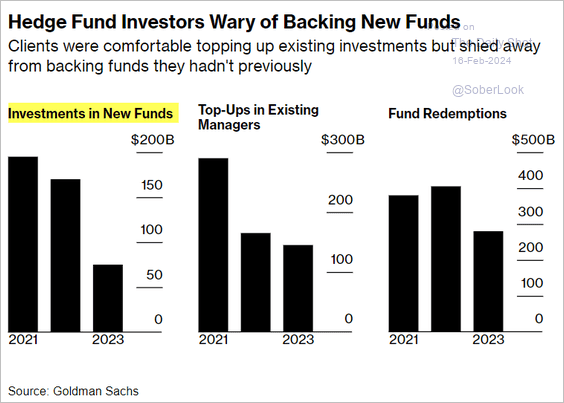 Source: @wealth Read full article
2. PE distributions hit the lowest level in more than a decade in 2023.
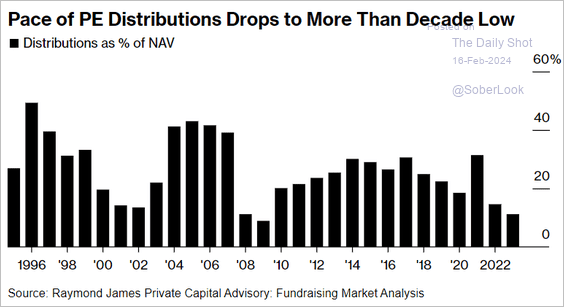 Source: @markets Read full article
This chart shows VC distributions over time.
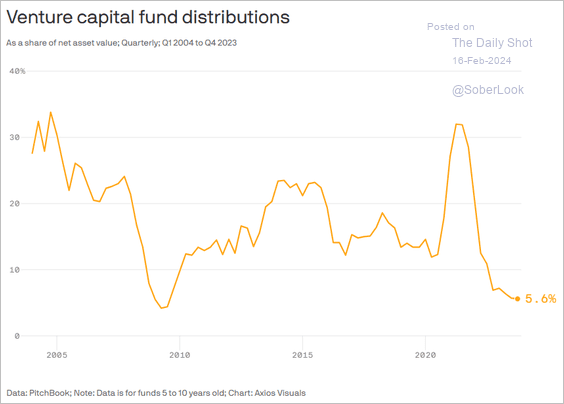 Source: @axios Read full article
——————–
3. Venture capital down rounds are increasing.
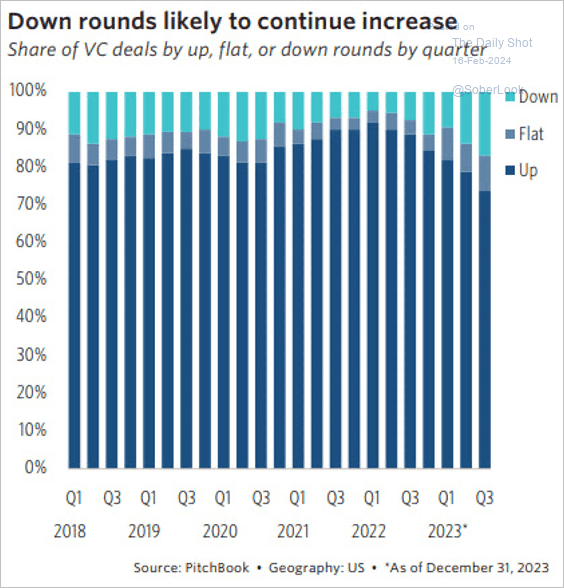 Source: PitchBook
4. US early-stage startups continue to receive the most invested capital.
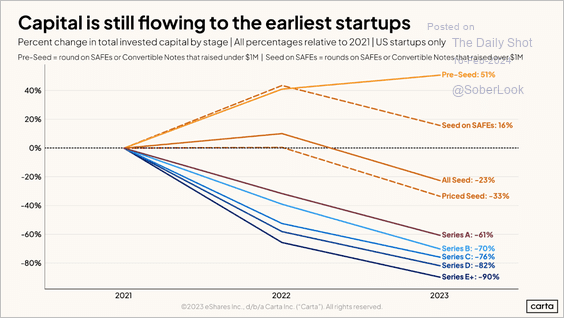 Source: Carta
Back to Index
Credit
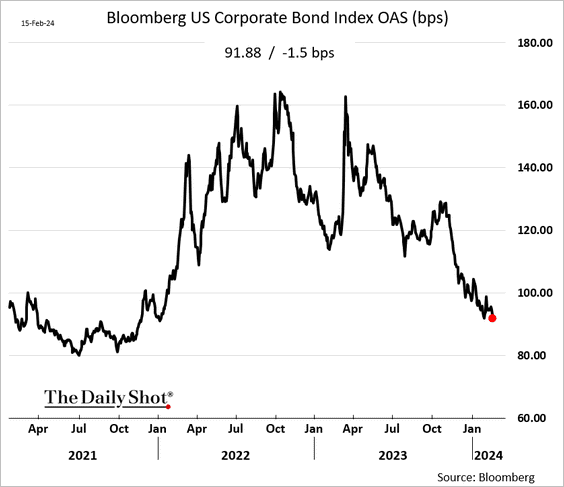
1. Corporate US investment-grade bond spreads hit the lowest level in two years.
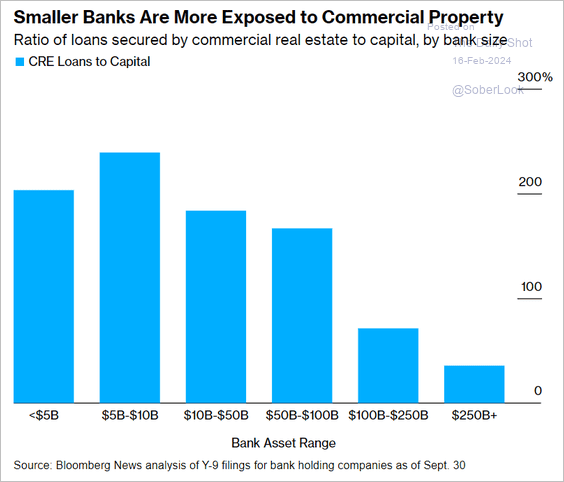
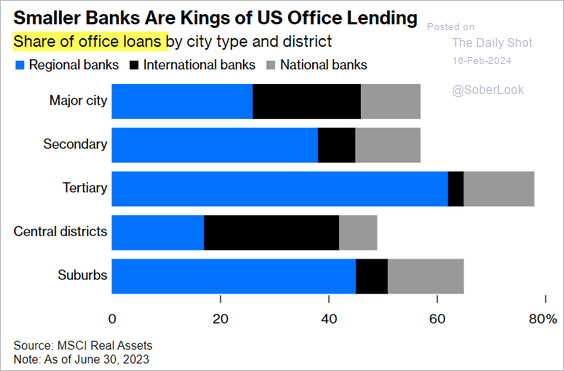
2. Smaller banks are more exposed to commercial real estate (2 charts).
 Source: @wealth Read full article
 Source: @PaulJDavies, @opinion Read full article
Back to Index
Global Developments
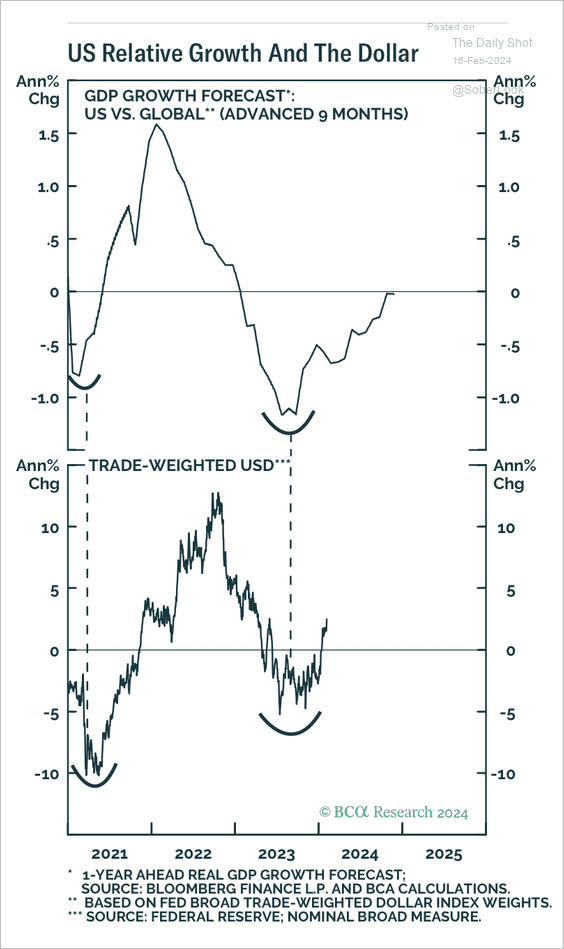
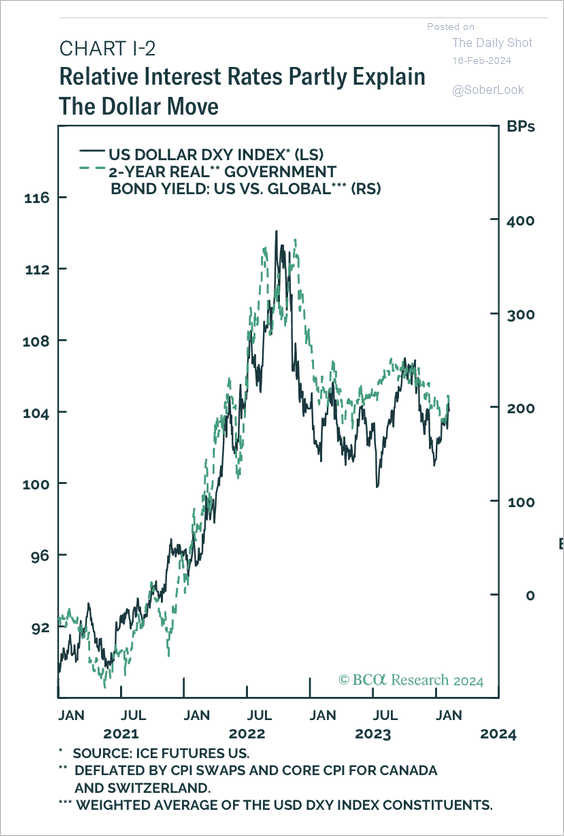
1. Positive economic growth in the US versus the rest of the world and improving interest rate differentials have benefitted the dollar. (2 charts)
 Source: BCA Research
 Source: BCA Research
——————–
2. This chart ranks countries by current inflation levels and inflation momentum over the last 12 months.
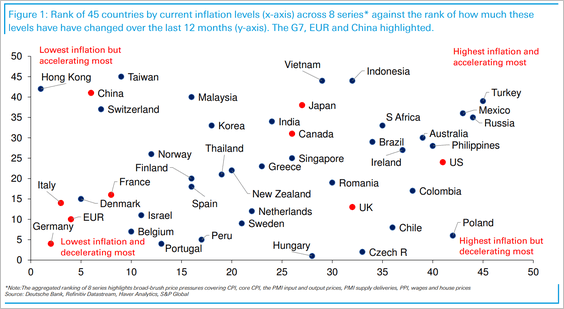 Source: Deutsche Bank Research
3. Finally, we have the evolution of dependency ratios in select economies.
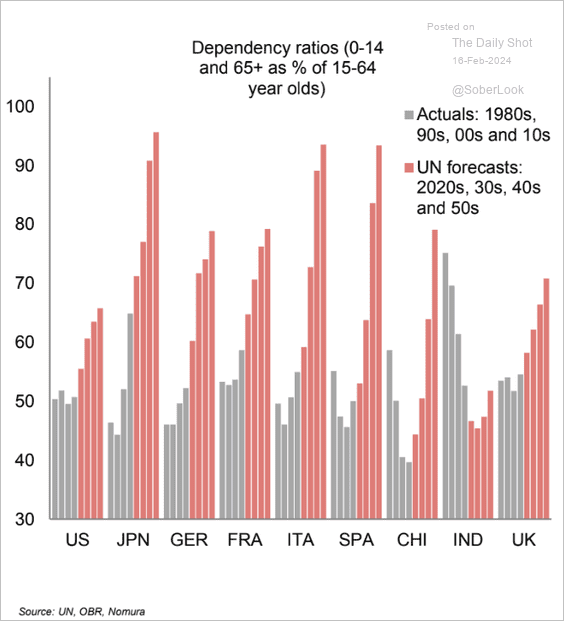 Source: Nomura Securities
——————–
Food for Thought
1. Global market share by unit smartphone shipments:
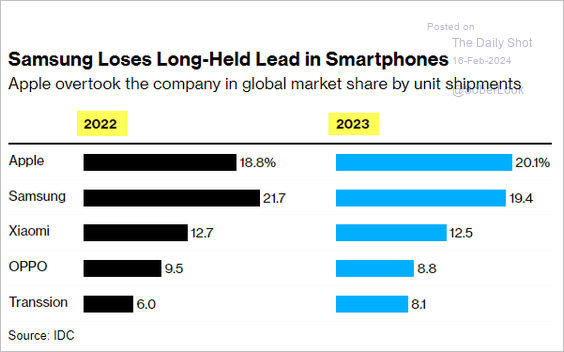 Source: @technology Read full article
2. Starbucks stores by country:
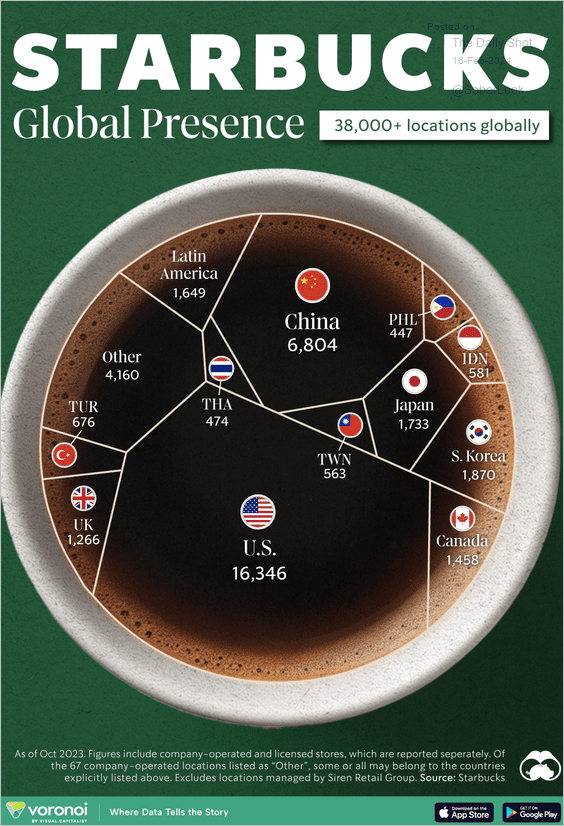 Source: Visual Capitalist Read full article
3. Adjusting to higher food prices:
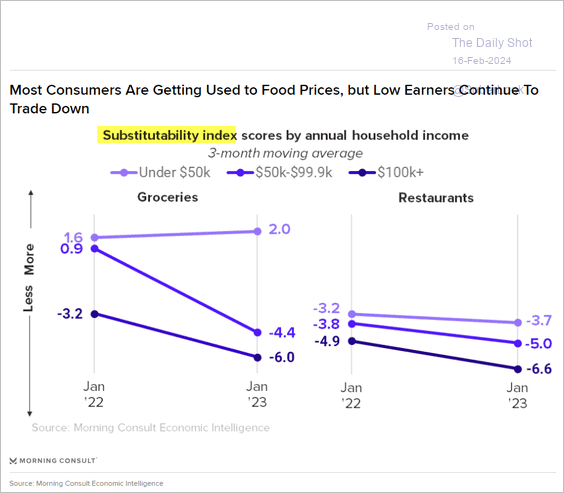 Source: Morning Consult Read full article
4. US centenarian population:
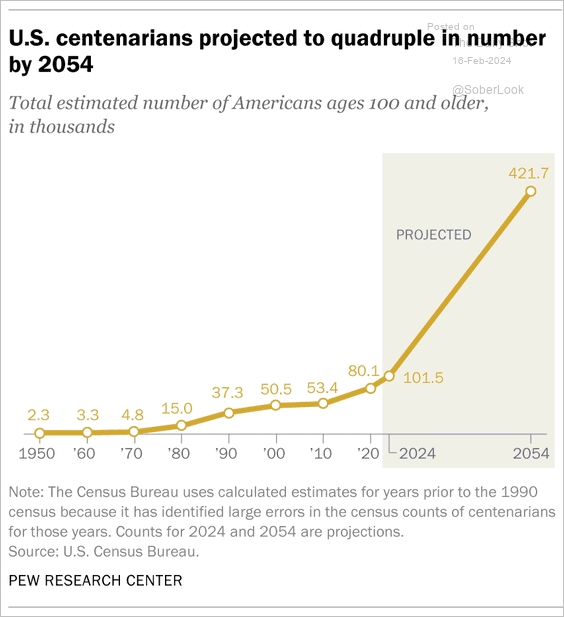 Source: Pew Research Center Read full article
5. Cigarette sales in the US:
 Source: Statista
6. Battery prices:
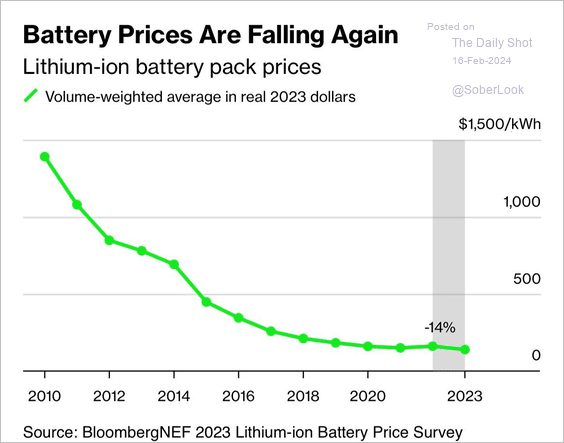 Source: @climate Read full article
7. US political party identification:
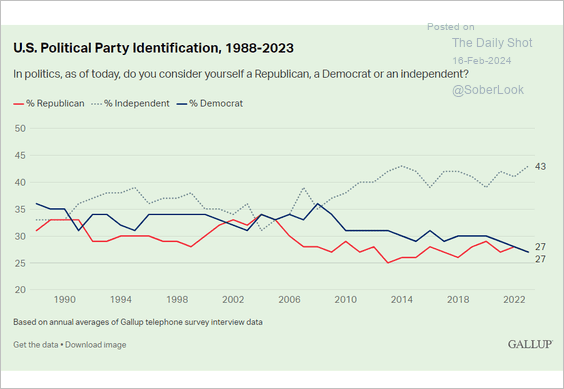 Source: Gallup Read full article
8. Views on Valentine’s Day around the world:
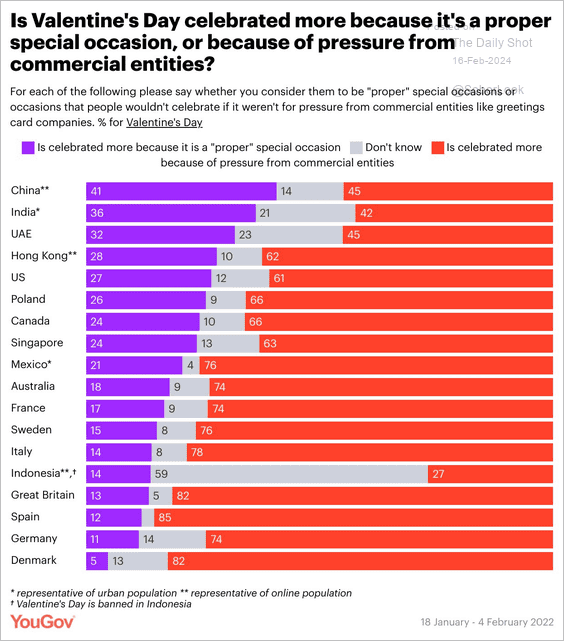 Source: YouGov Read full article
——————–
Have a great weekend!
Back to Index