
The Daily Shot: 20-Feb-24
• The United States
• Europe
• China
• Emerging Markets
• Cryptocurrency
• Commodities
• Energy
• Equities
• Credit
• Rates
• Global Developments
• Food for Thought
The United States
1. The World Economics SMI report signals an acceleration in US business activity this month. Price pressures appear to be easing.
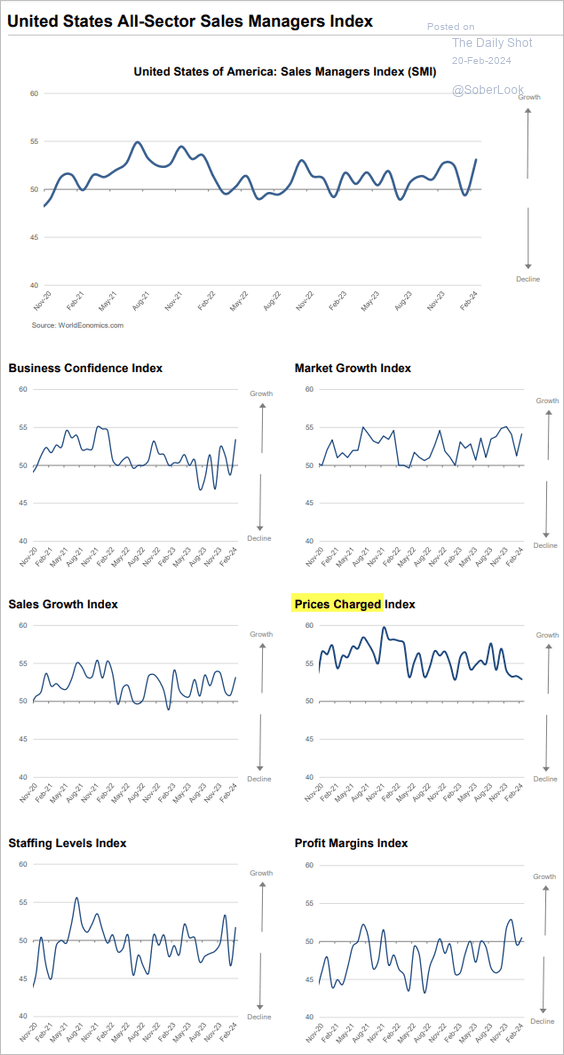 Source: World Economics
2. Next, we have some updates on the labor market, …
• Payroll revisions recently turned positive.
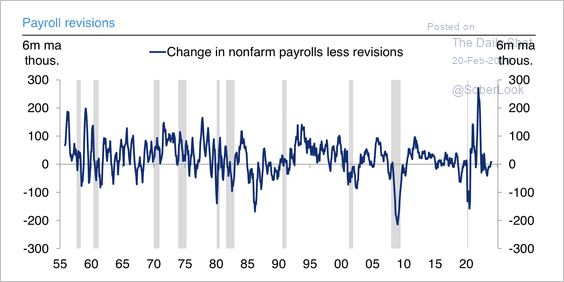 Source: Deutsche Bank Research
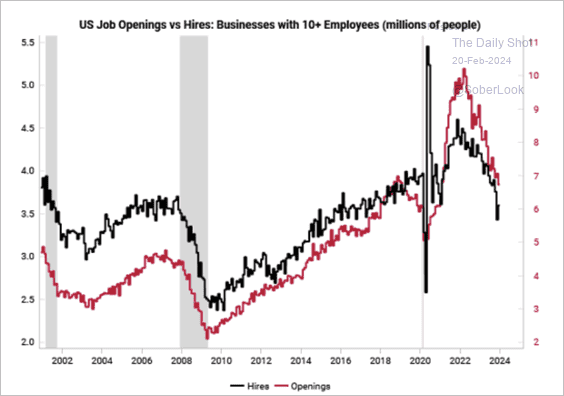
… but the slowdown in hiring suggests that labor market strength relies on maintaining a low-layoffs rate.
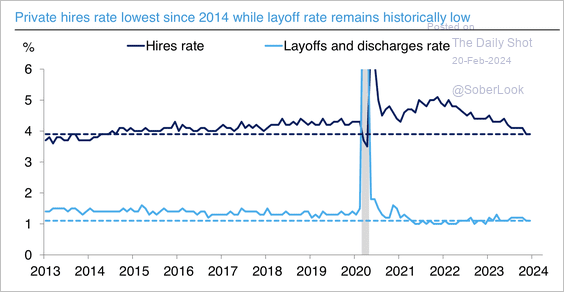 Source: Deutsche Bank Research
• Job openings remain elevated for businesses with 1-9 employees, while larger firms have scaled back. (2 charts)
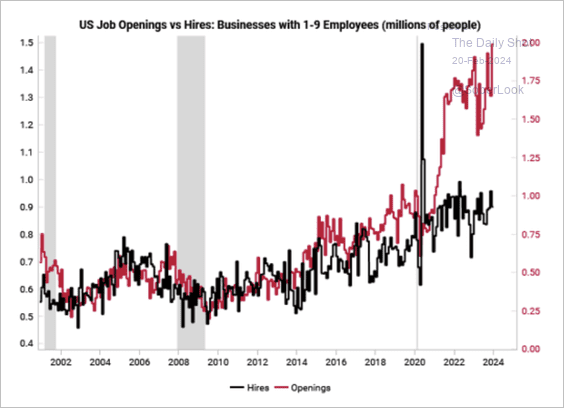 Source: Variant Perception
 Source: Variant Perception
——————–
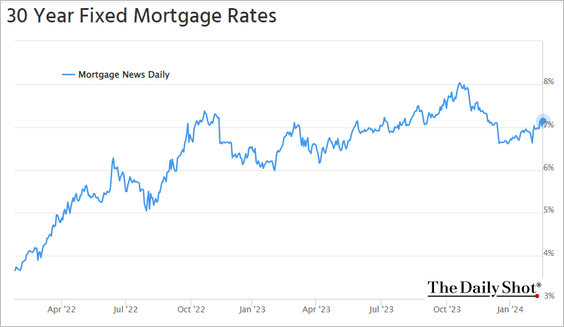
3. Below are some housing market trends.
• Mortgage rates are holding above 7%.
 Source: Mortgage News Daily
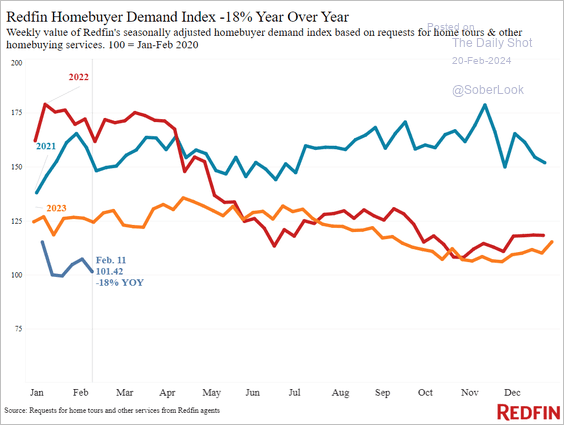
• Homebuyer demand has been softening, according to Redfin.
 Source: Redfin
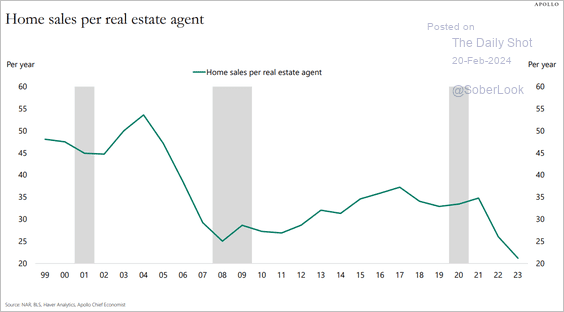
• This chart shows home sales per real estate agent.
 Source: Torsten Slok, Apollo
• More than a quarter of lower-priced homes in the US are purchased by investors.
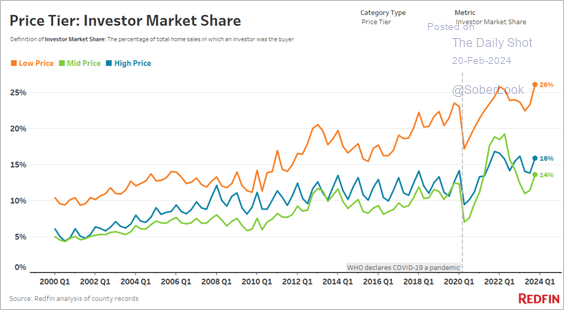 Source: Redfin
——————–
4. The jump in house prices drove a relatively equitable rise in wealth.
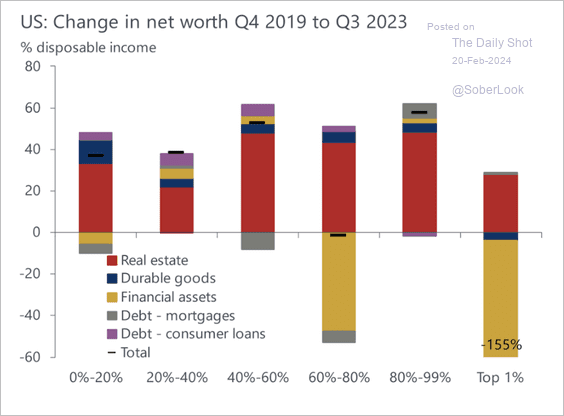 Source: Oxford Economics
• Net worth has risen across the income spectrum.
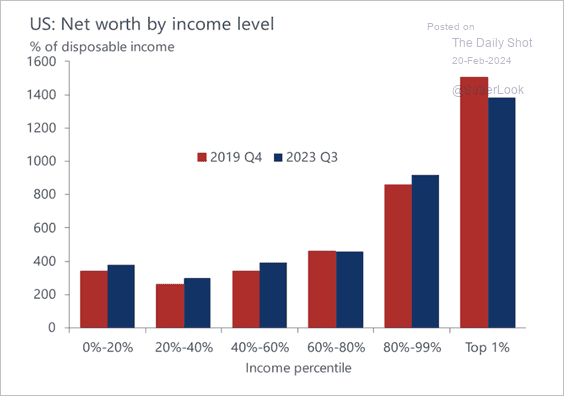 Source: Oxford Economics
——————–
5. Next, let’s take a look at a few inflation trends.
• Nomura’s assessment of January’s core PCE inflation points to the largest monthly increase in a year.
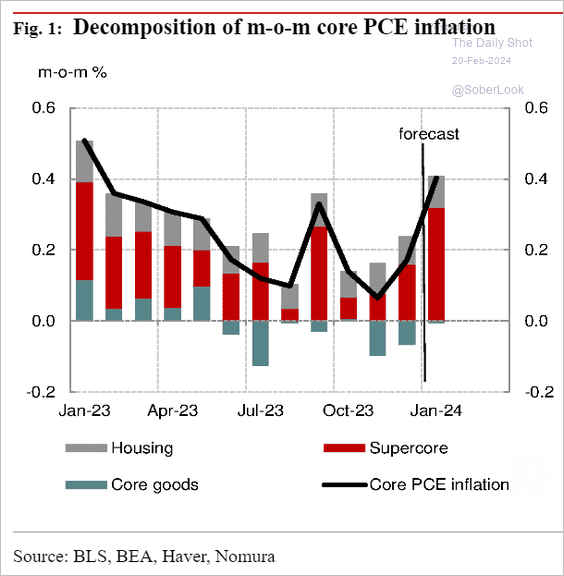 Source: Nomura Securities
• Inflation surprises have bottomed.
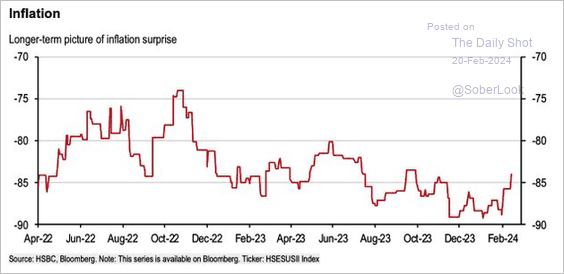 Source: HSBC; @WallStJesus
• Will inflation follow the post-WWII path?
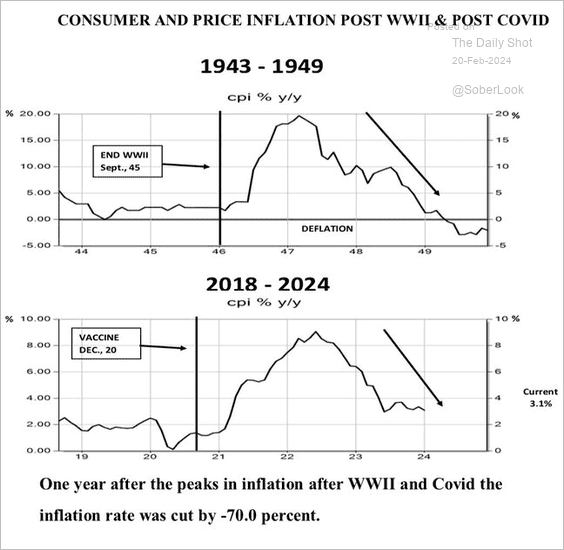 Source: Elaine Garzarelli; @carlquintanilla
——————–
6. Investment in nonresidential structures has been fueled by the manufacturing sector, especially semiconductor facilities.
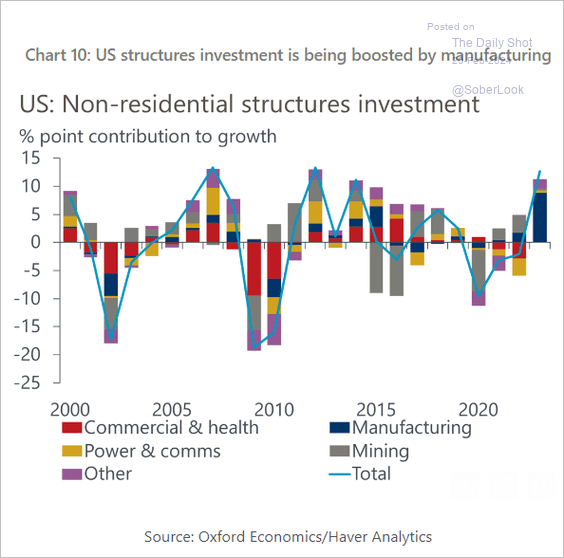 Source: Oxford Economics
Here are the new manufacturing mega projects.
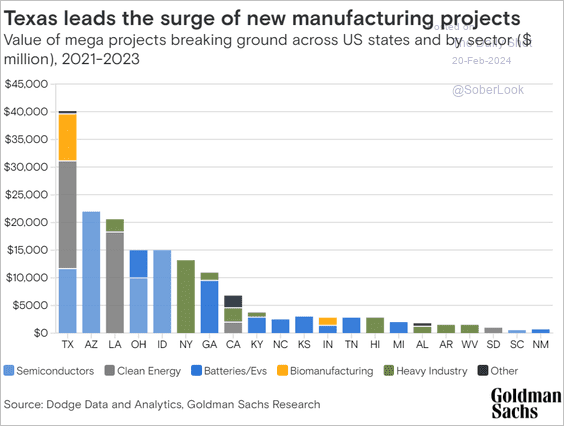 Source: Goldman Sachs
• Capital spending on intellectual property and R&D has surpassed structures and equipment as a share of GDP.
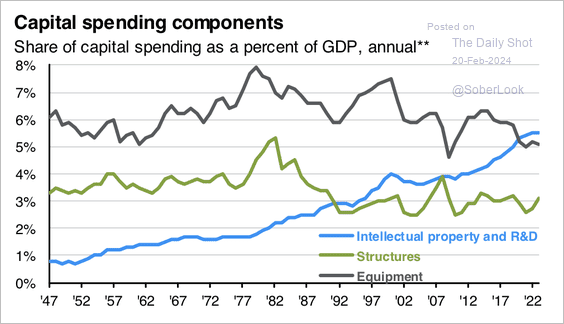 Source: J.P. Morgan Asset Management
Back to Index
Europe
1. This chart shows wind and solar share of power generation in the EU.
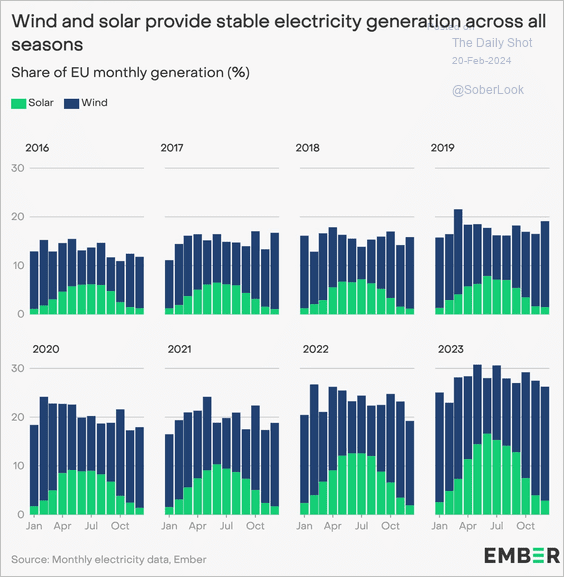 Source: @EmberClimate Read full article
• Germany is accelerating permits for wind farms.
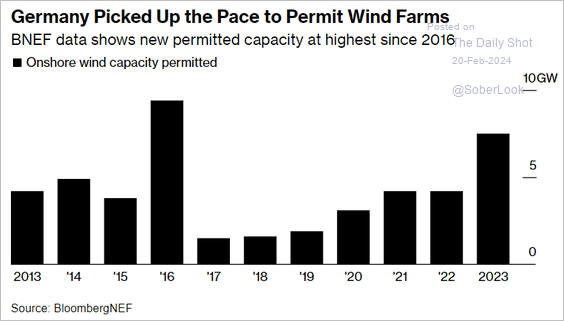 Source: @business Read full article
• EU coal facility closures have been picking up momentum.
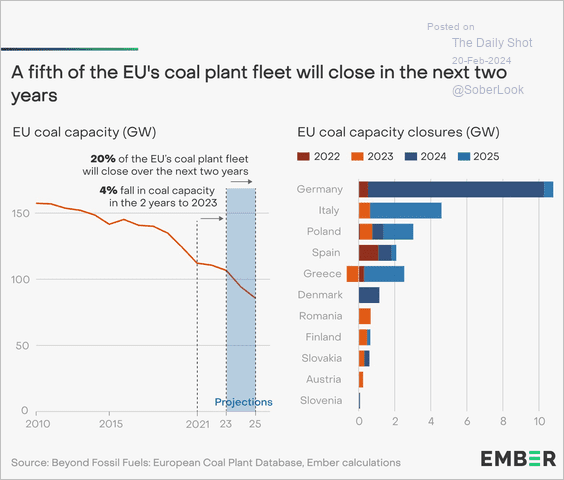 Source: EMBER Read full article
——————–
2. Here is a look at old-age dependency ratios in the EU.
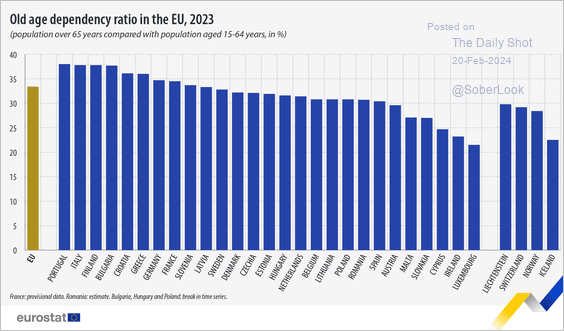 Source: Eurostat Read full article
• Which countries’ population is aging at the fastest rate?
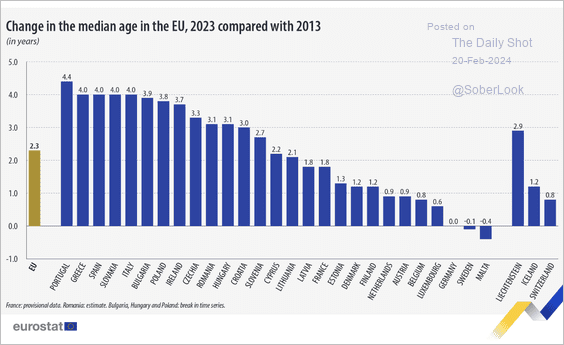 Source: Eurostat Read full article
Back to Index
China
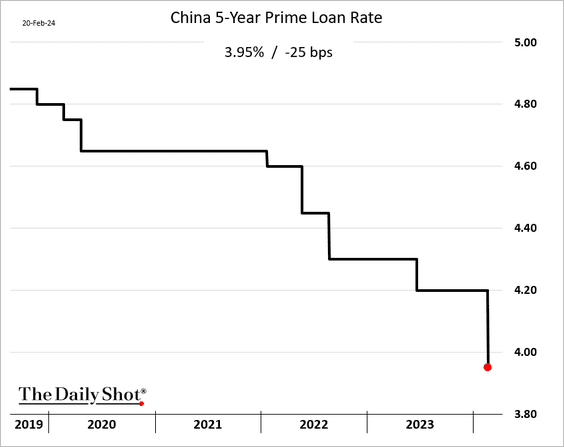
1. Beijing unexpectedly instructed the banks to cut the benchmark mortgage rates by 25 bps.
 Source: Nikkei Asia Read full article
The goal is to stabilize the housing market by pushing borrowing rates even lower.
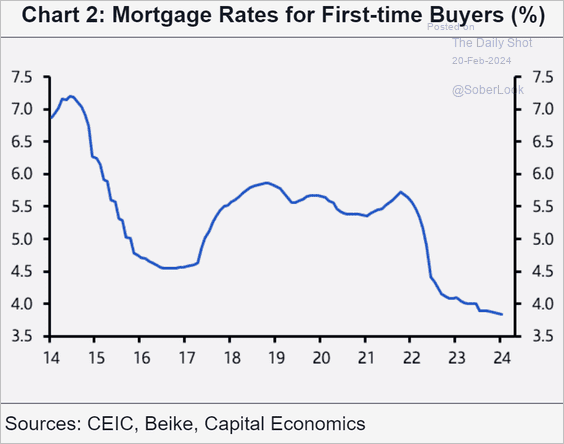 Source: Capital Economics
——————–
2. According to the World Economics SMI report, China’s factory activity contracted this month, while services growth remains robust.
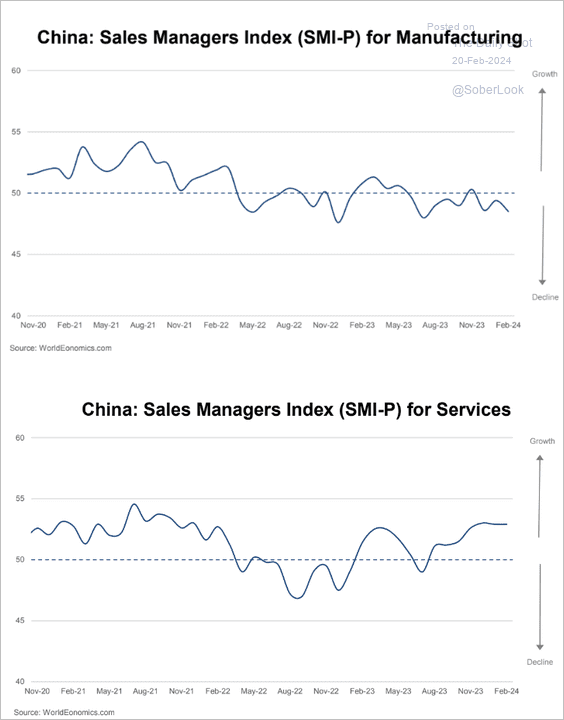 Source: World Economics
3. Foreign direct investment tumbled last year.
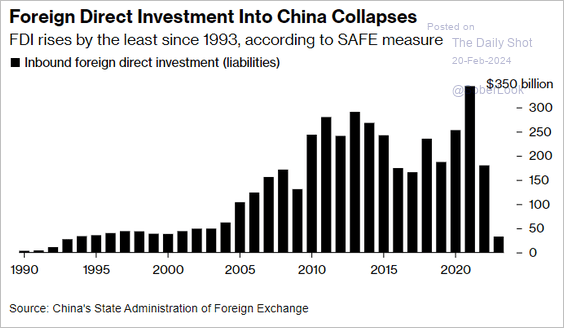 Source: @economics Read full article
4. Here is a look at China’s manufacturing labor costs relative to Asian peers.
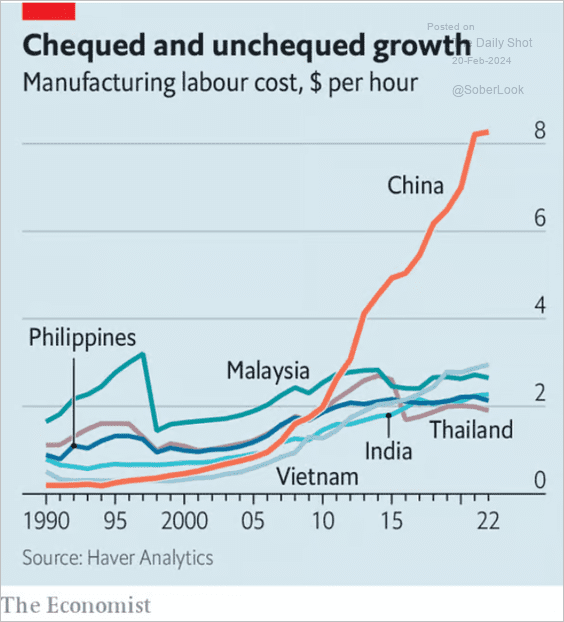 Source: The Economist Read full article
Back to Index
Emerging Markets
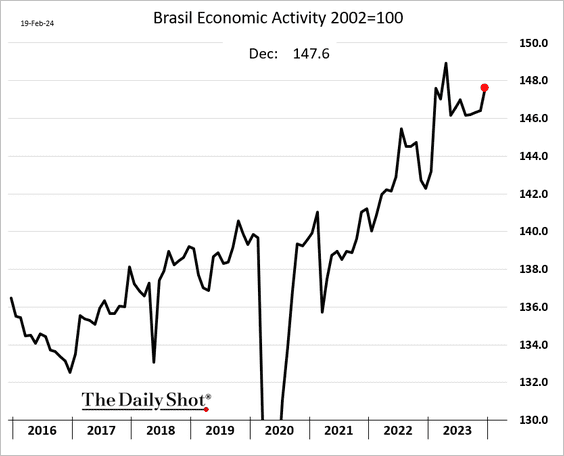
1. Brazil’s economic activity jumped in December.
2. India’s business activity accelerated this month, according to World Economics.
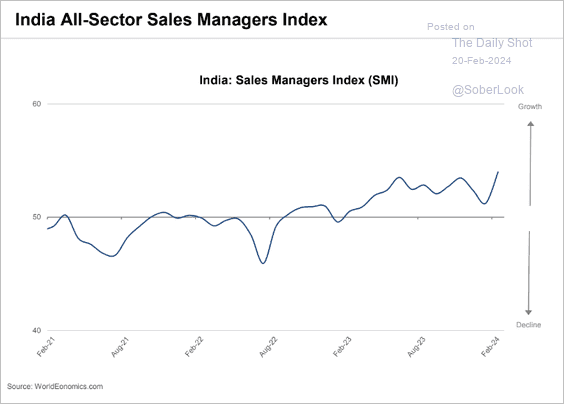 Source: World Economics
3. EM corporate sentiment has been surging.
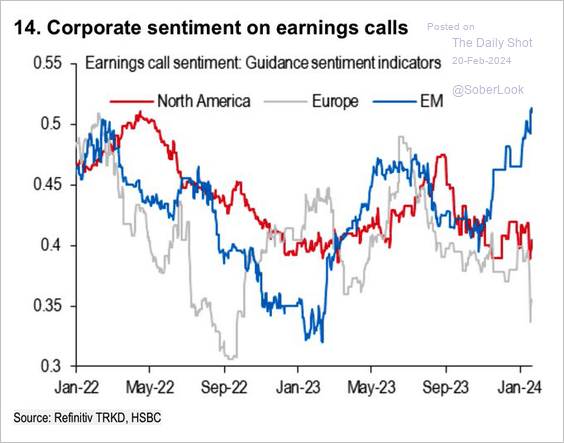 Source: HSBC; @WallStJesus
4. EM real policy rates are still substantially higher than developed markets. There is much greater room for further EM rate cuts.
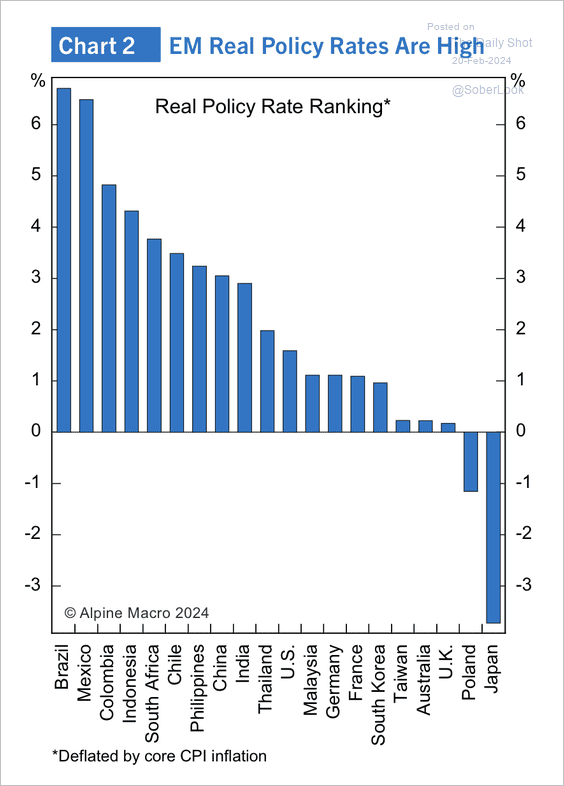 Source: Alpine Macro
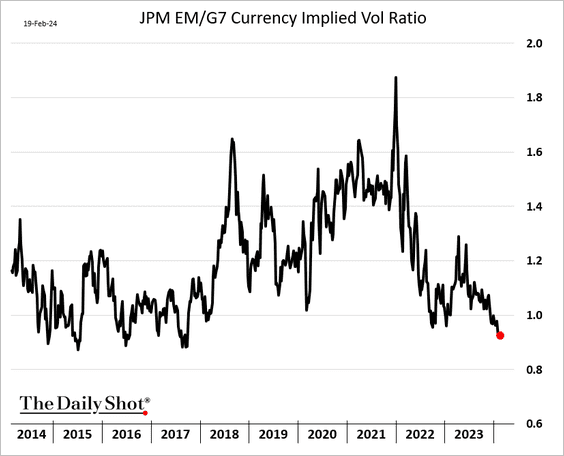
5. The implied volatility in EM currency markets has been crashing.
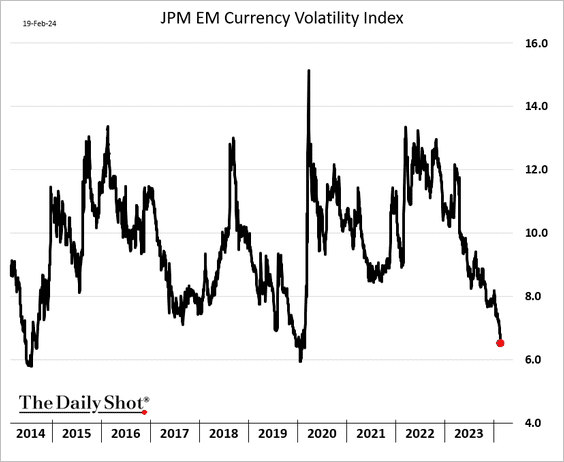
Below is the ratio of implied volatilities between EM and G7 currencies.
Back to Index
Cryptocurrency
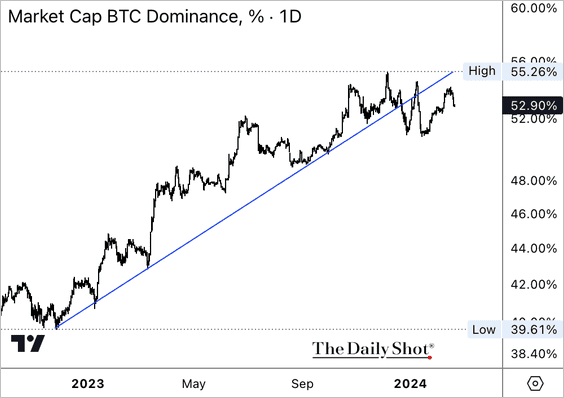
1. Bitcoin’s market cap relative to the total crypto market cap (dominance ratio) broke below its year-long uptrend.
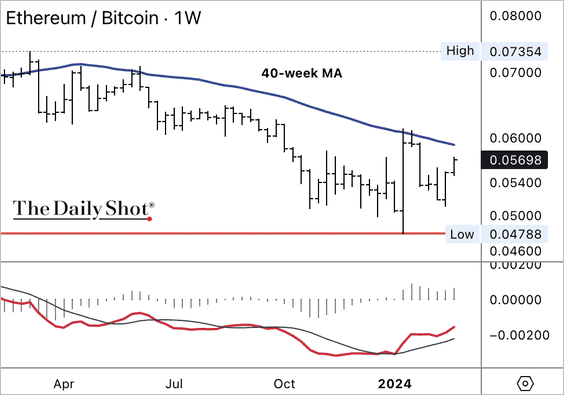
2. The ETH/BTC price ratio is approaching initial resistance at its 40-week moving average, although momentum is improving.
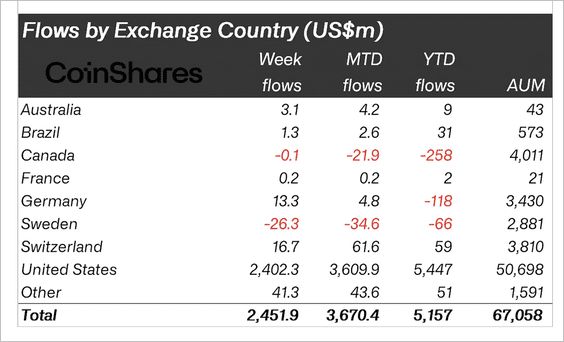
3. Crypto funds saw record inflows last week, led by new US spot-bitcoin products. (2 charts)
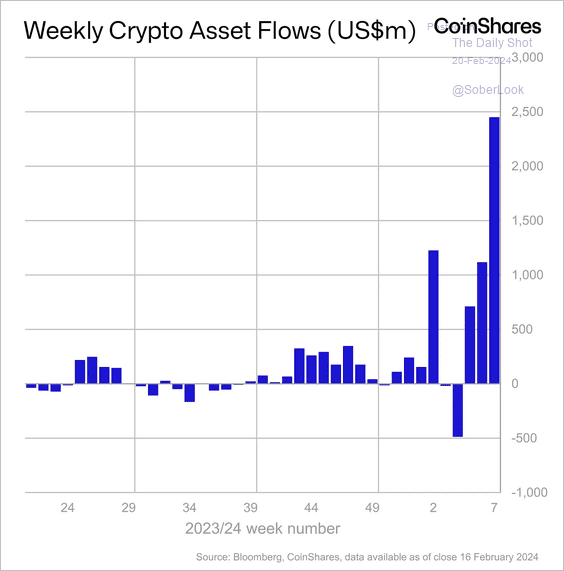 Source: CoinShares Read full article
 Source: CoinShares Read full article
Here is a look at daily bitcoin ETF flows.
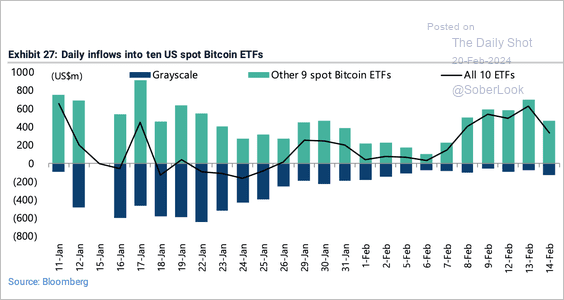 Source: Jefferies; @dailychartbook
Back to Index
Commodities
1. Despite Beijing’ rate cut, iron ore and steel futures are dropping amid soft demand from China’s housing sector.
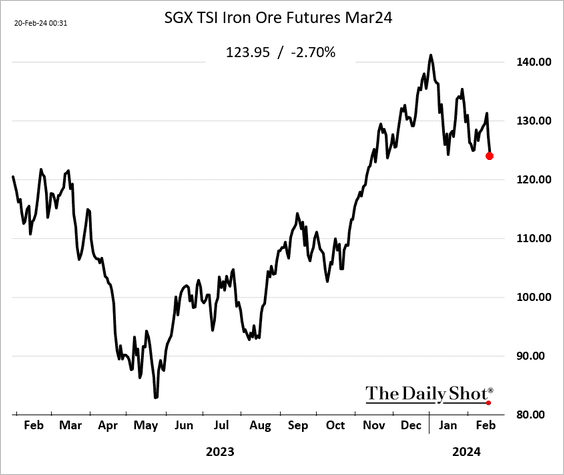
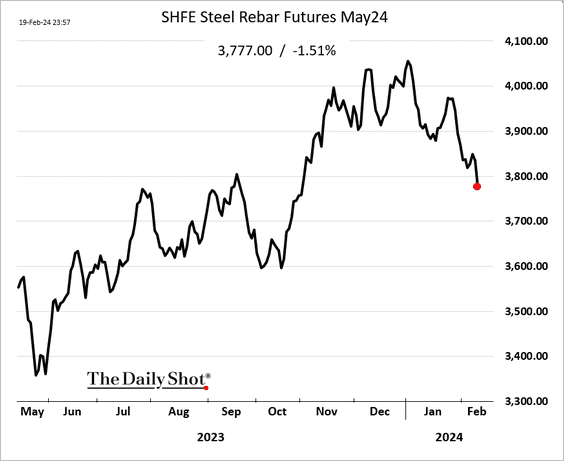
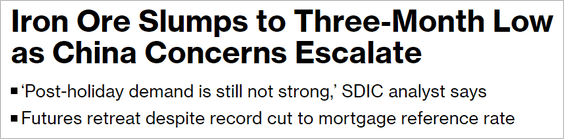 Source: @markets Read full article
——————–
2. Gold prices continue to diverge from ETF gold holdings.
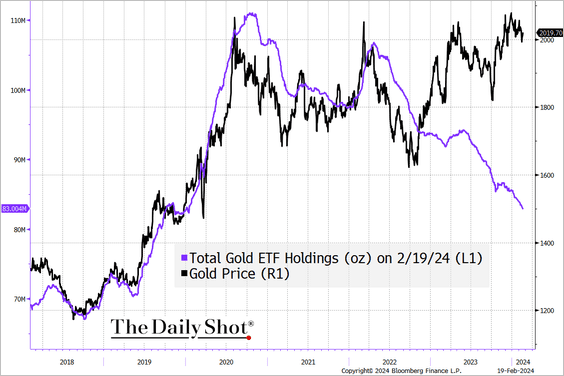 Source: @TheTerminal, Bloomberg Finance L.P.
• Sanctions typically have a positive impact on the gold market.
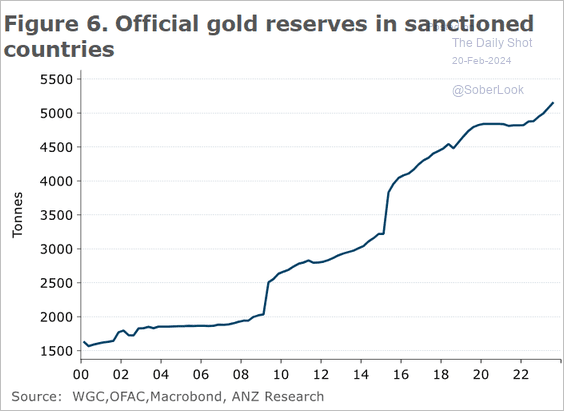 Source: @ANZ_Research
——————–
3. How do commodities perform around the Fed’s first rate cut?
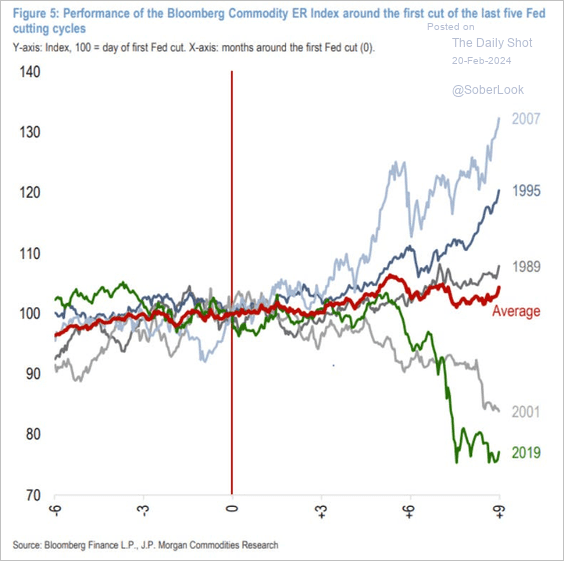 Source: JP Morgan Research; @dailychartbook
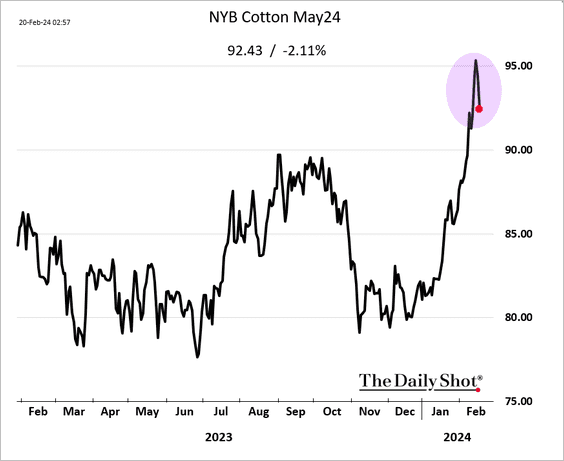
4. The rally in cotton futures is fading.
Back to Index
Energy
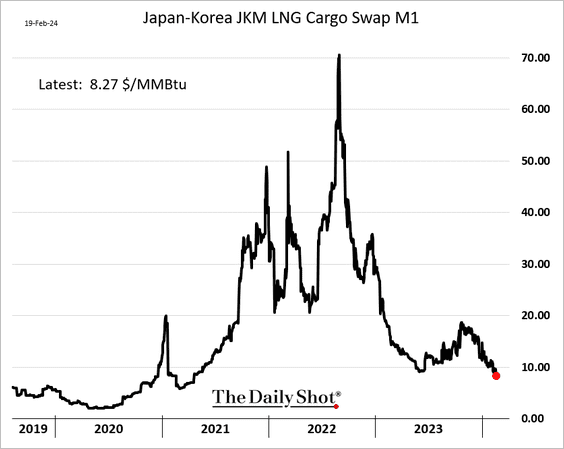
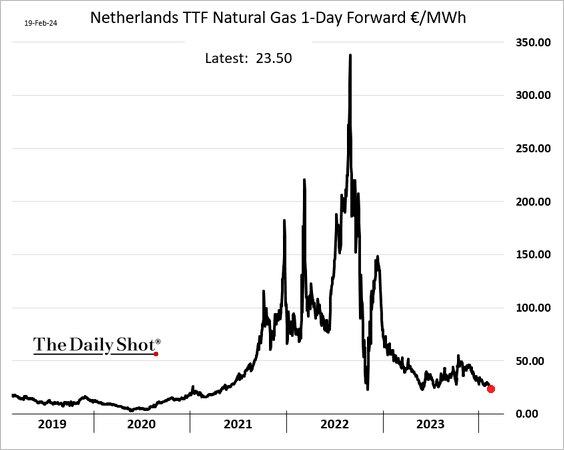
Natural gas prices have been falling globally.
• Asia (2 charts):
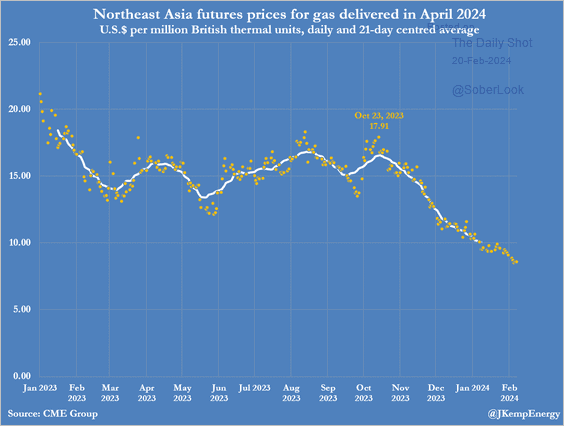 Source: @JKempEnergy
• Europe:
Back to Index
Equities
1. The S&P 500 is increasingly tech-heavy.
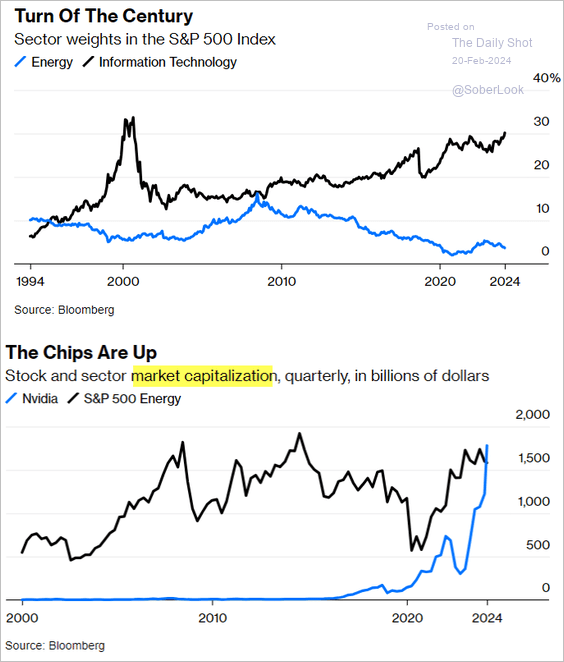 Source: @liamdenning, @opinion Read full article
2. Tech stocks’ market cap share is outpacing their earnings share.
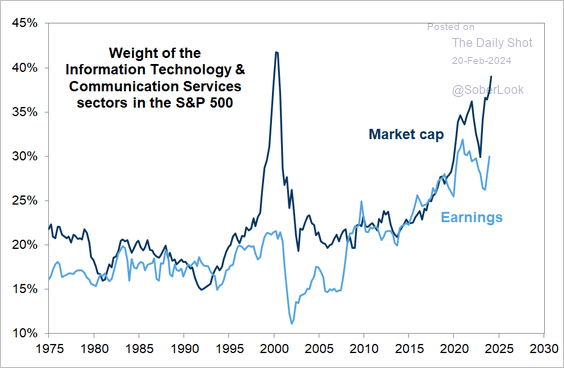 Source: Goldman Sachs; @MikeZaccardi
3. Excluding tech stocks, margins for the S&P 500 are projected to see only a slight expansion this year.
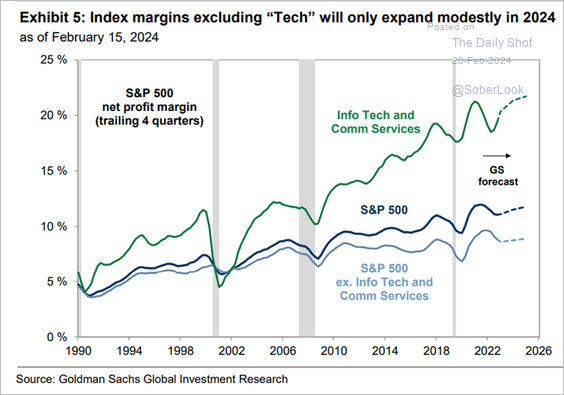 Source: Goldman Sachs; @MikeZaccardi
4. Most S&P 500 sector valuations are running above their 25-year averages.
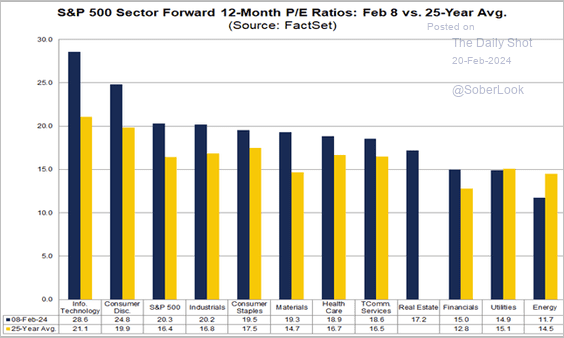 Source: @FactSet Read full article
5. The S&P 500 dividend yield is running well below that of its global counterparts.
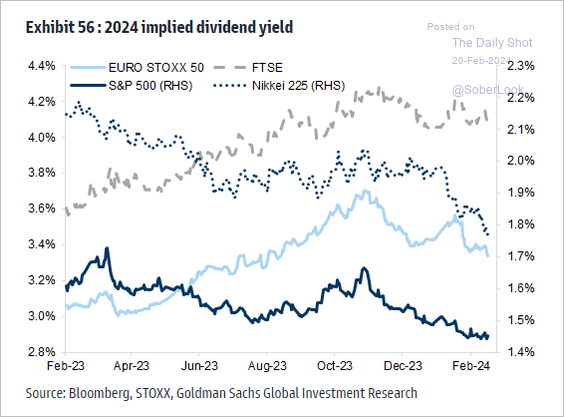 Source: Goldman Sachs; @MikeZaccardi
6. Share buybacks picking up.
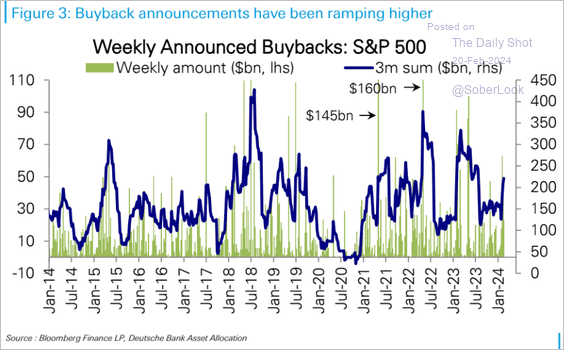 Source: Deutsche Bank Research
7. The market hasn’t been kind to companies that missed earnings and sales estimates in the latest earnings season.
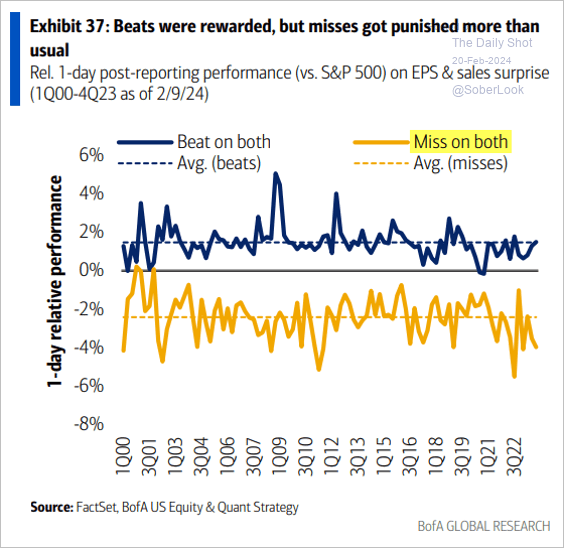 Source: BofA Global Research
8. Retail investors have been buying IWM (the Russell 2000 ETF).
 Source: Goldman Sachs; @dailychartbook
• Retail investors have been more involved in options as their portfolios’ P&Ls improve.
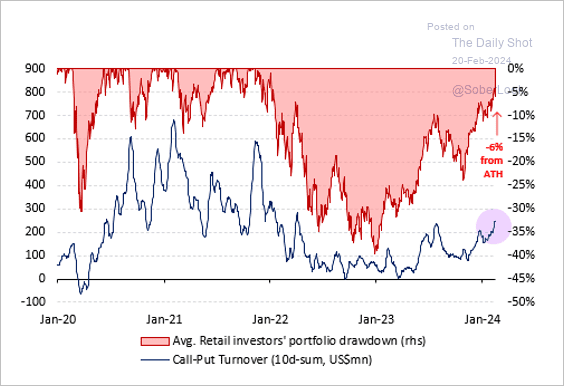 Source: Vanda Research
——————–
9. The correlation between the Russell 2000 relative performance and Treasury yields hit extreme levels in recent weeks.
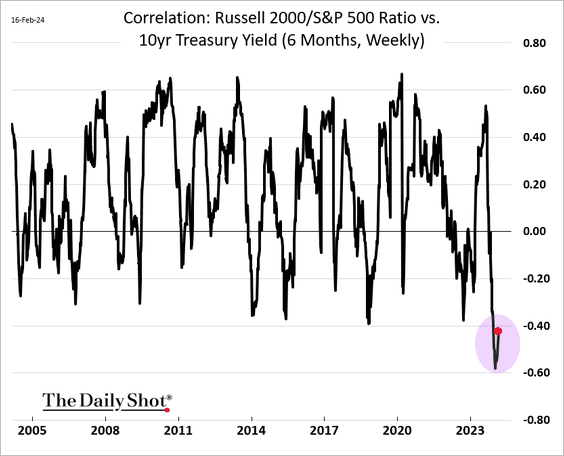 h/t UBS
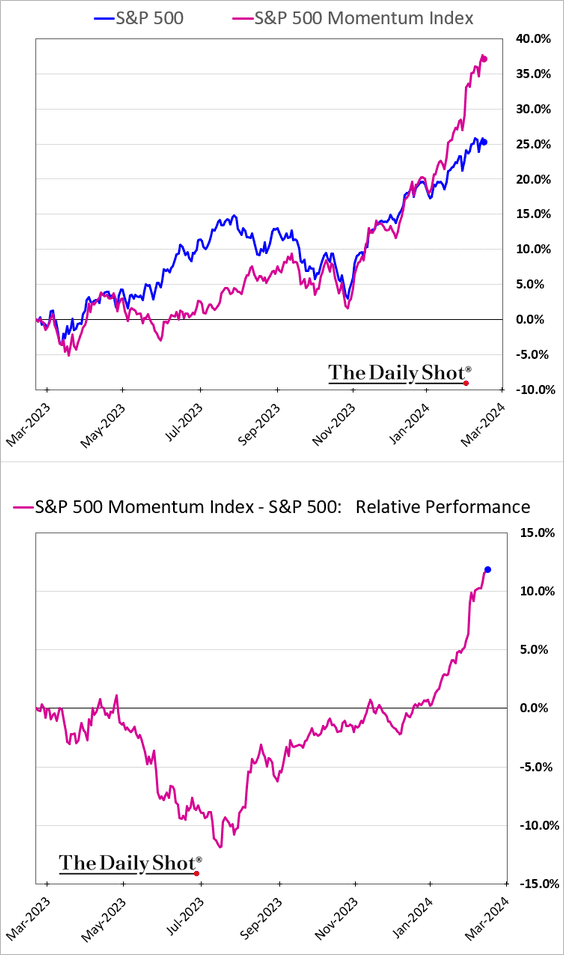
10. Momentum stocks continue to outperform.
11. Over the past four years, S&P 500 returns were predominantly driven by earnings.
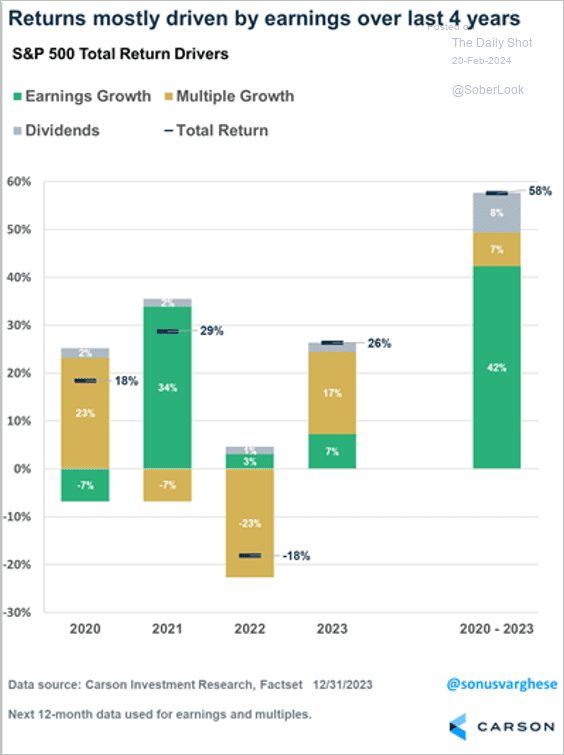 Source: @RyanDetrick, @sonusvarghese
Back to Index
Credit
1. US small-cap stocks have more floating rate debt than large caps.
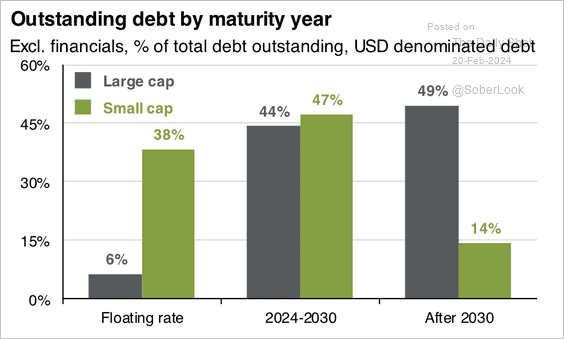 Source: J.P. Morgan Asset Management
2. The size of the private credit market is approaching that of the leveraged loan and high-yield bond markets.
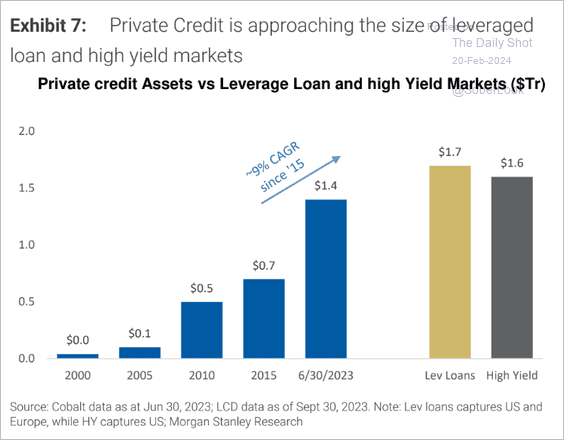 Source: Morgan Stanley Research
3. Is the office market returning to balance?
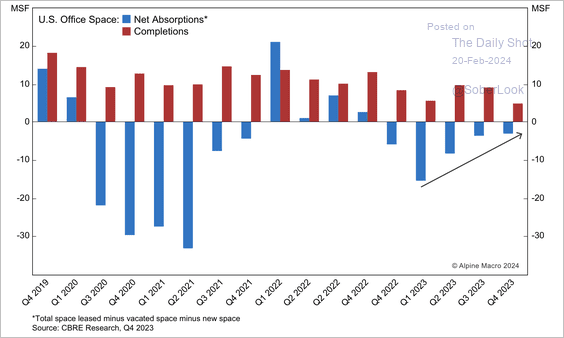 Source: Alpine Macro
• The downturn in commercial real estate prices was correlated with rising interest rates, although CMBS spreads remained relatively low.
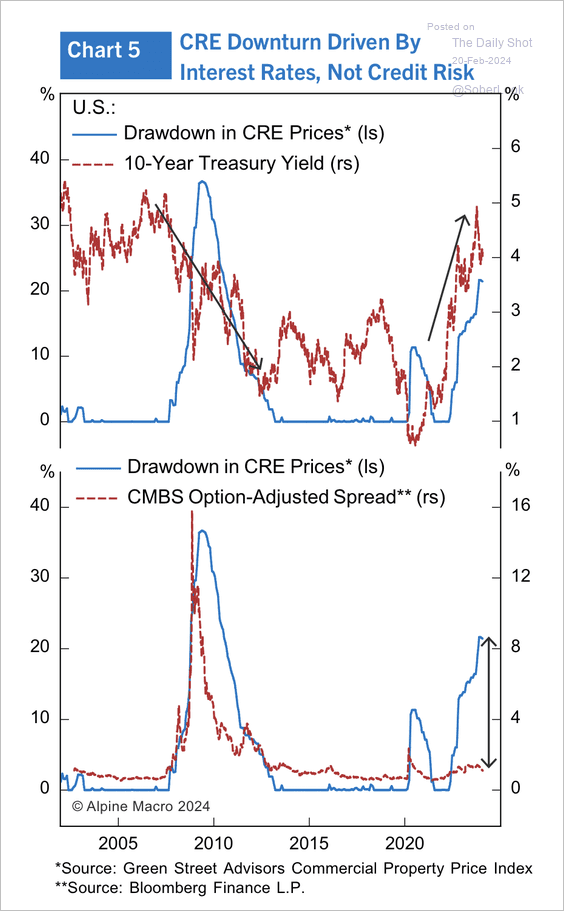 Source: Alpine Macro
• During this Fed rate-hiking cycle, the correction in the US commercial real estate market has been notably severe.
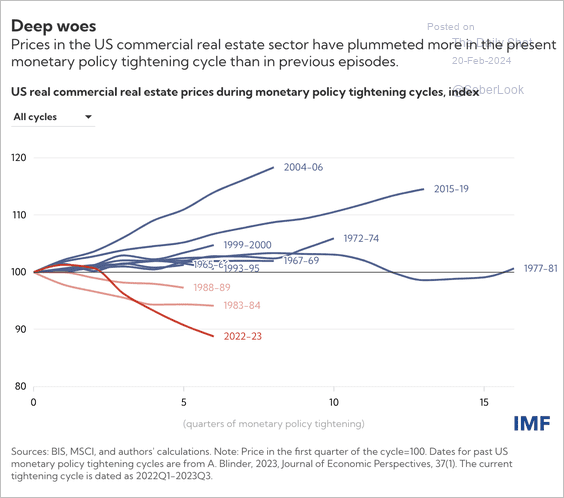 Source: IMF Read full article
——————–
4. Here is a look at US household loan growth rates and delinquencies, which have been particularly high in credit cards.
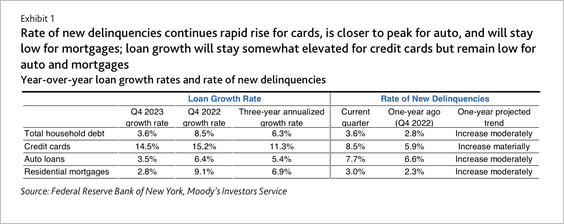 Source: Moody’s Investors Service
• Michigan, Nevada, and Texas have some of the highest delinquency levels.
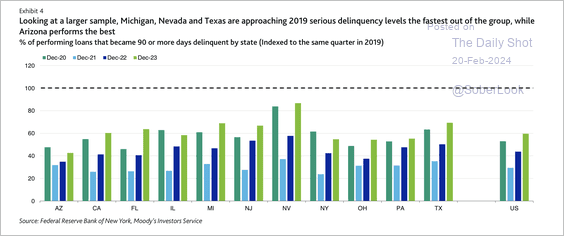 Source: Moody’s Investors Service
• The decline in household loan originations means that it has been taking longer for higher rates to pass through to consumers.
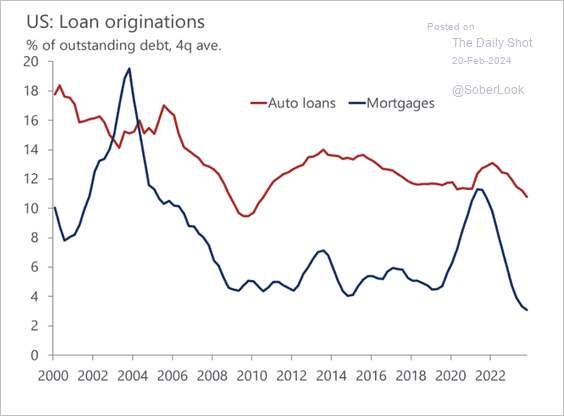 Source: Oxford Economics
Back to Index
Rates
1. The 2-year note is testing support at the 200-day moving average.
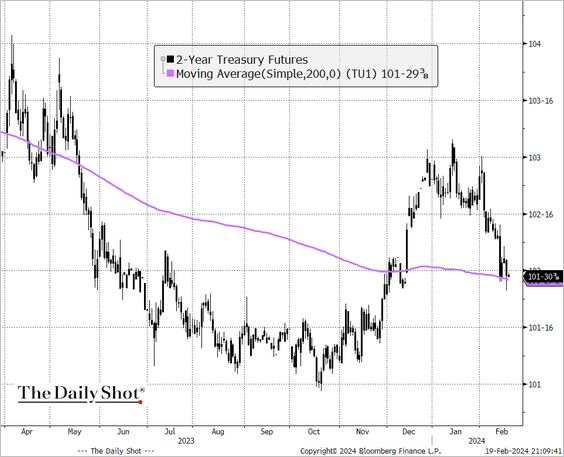 Source: @TheTerminal, Bloomberg Finance L.P.
2. Recent movements in the 10-year Treasury yield have been driven by Fed policy and a rising term premium.
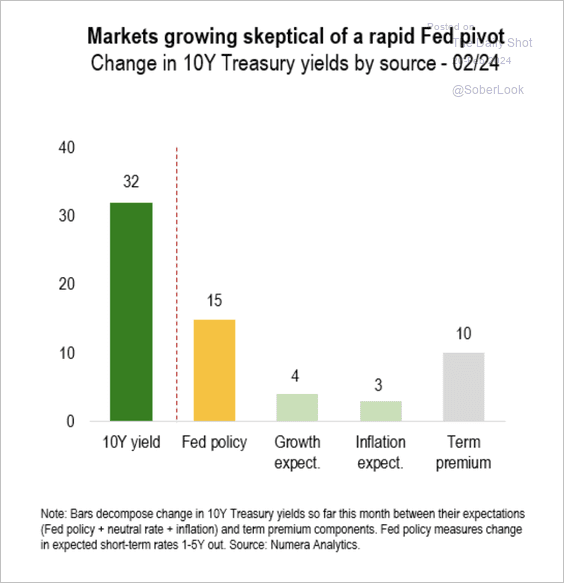 Source: Numera Analytics (@NumeraAnalytics)
3. Foreign official accounts have been reducing their holdings of Treasuries.
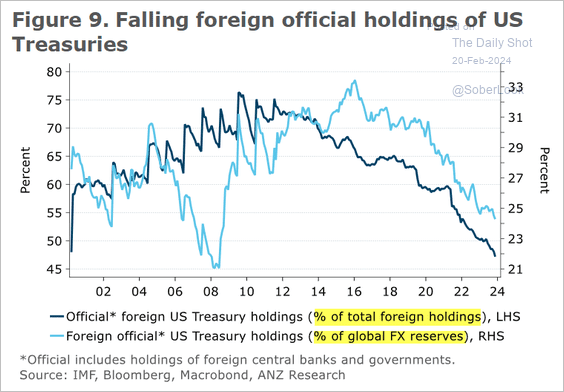 Source: @ANZ_Research
4. BofA’s private clients are getting back into TIPS.
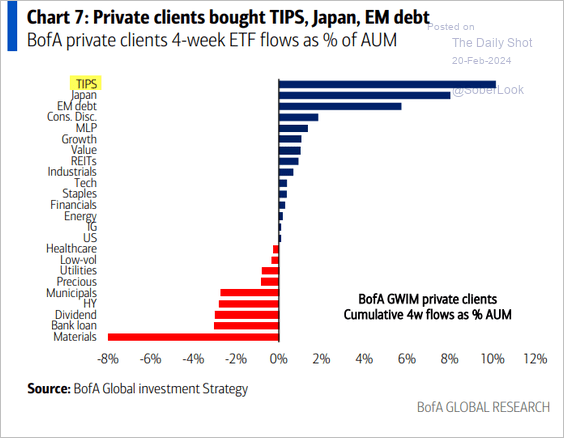 Source: BofA Global Research
Back to Index
Global Developments
1. The post-pandemic uptrend in commodity prices could eventually benefit the credit profiles of commodity-exporting countries.
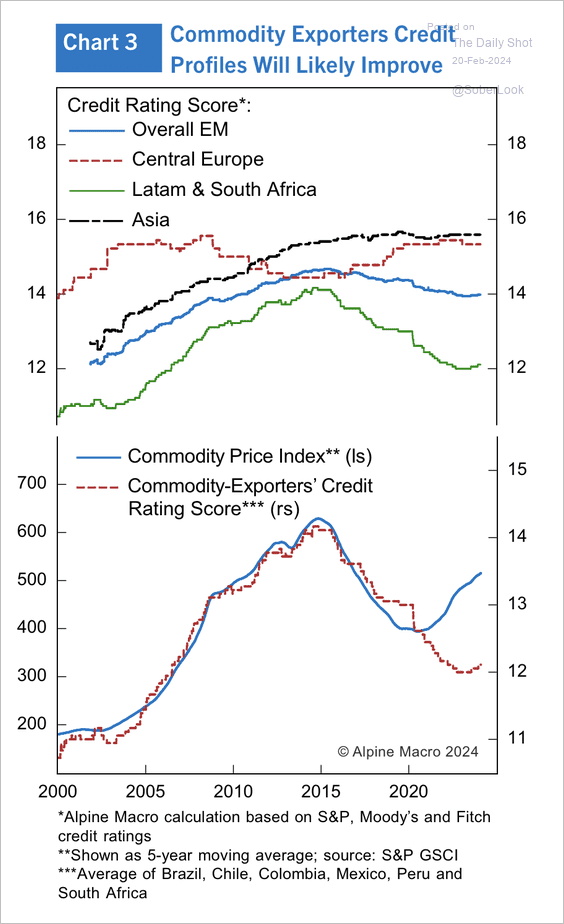 Source: Alpine Macro
2. Four G7 economies experienced GDP contractions over the past two quarters.
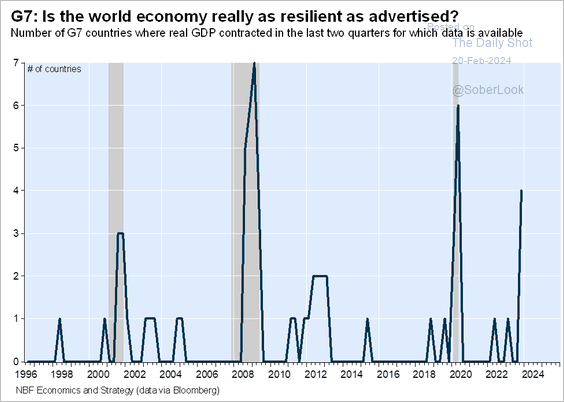 Source: Economics and Strategy Group, National Bank of Canada
3. This chart shows where companies from each region generate their sales, highlighting their global market reach and regional sales presence.
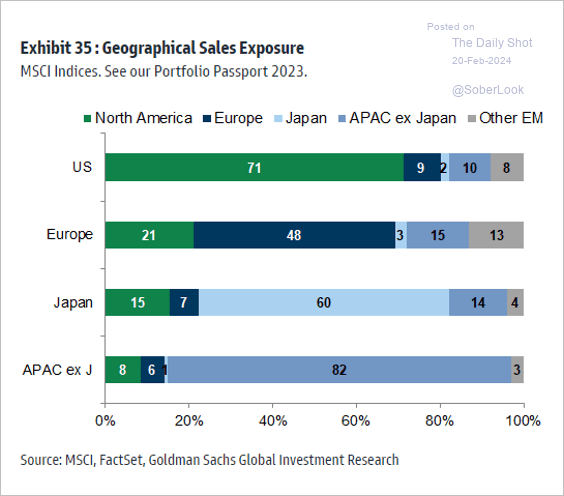 Source: Goldman Sachs; @MikeZaccardi
——————–
Food for Thought
1. The top four US banks pay very low interest rates to consumers.
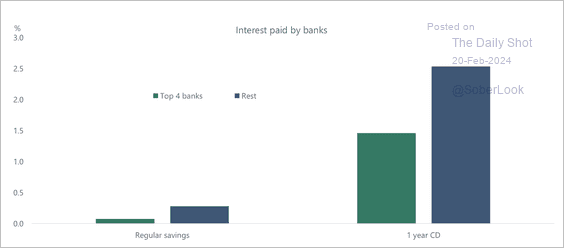 Source: Torsten Slok, Apollo
2. BofA’s and JPMorgan’s bank branches:
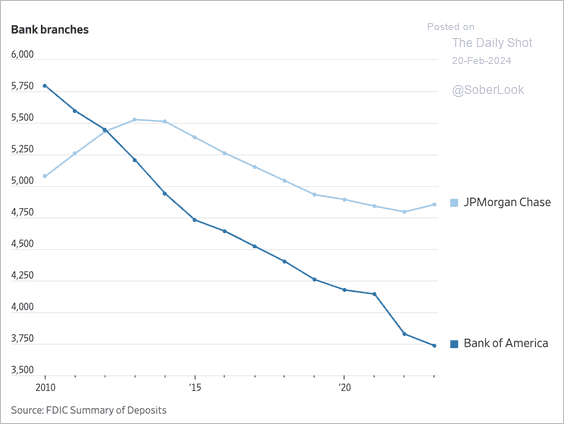 Source: @WSJ Read full article
3. Apple’s product revenue:
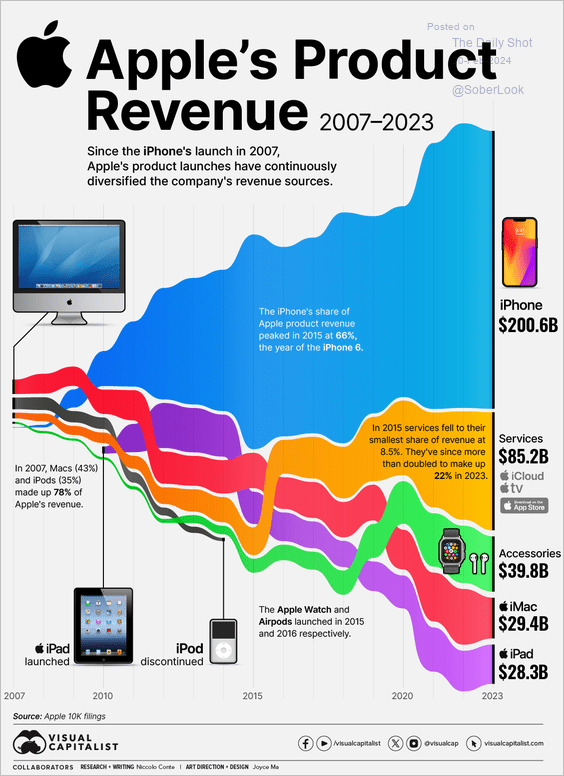 Source: Visual Capitalist Read full article
4. US birth rates by mother’s age:
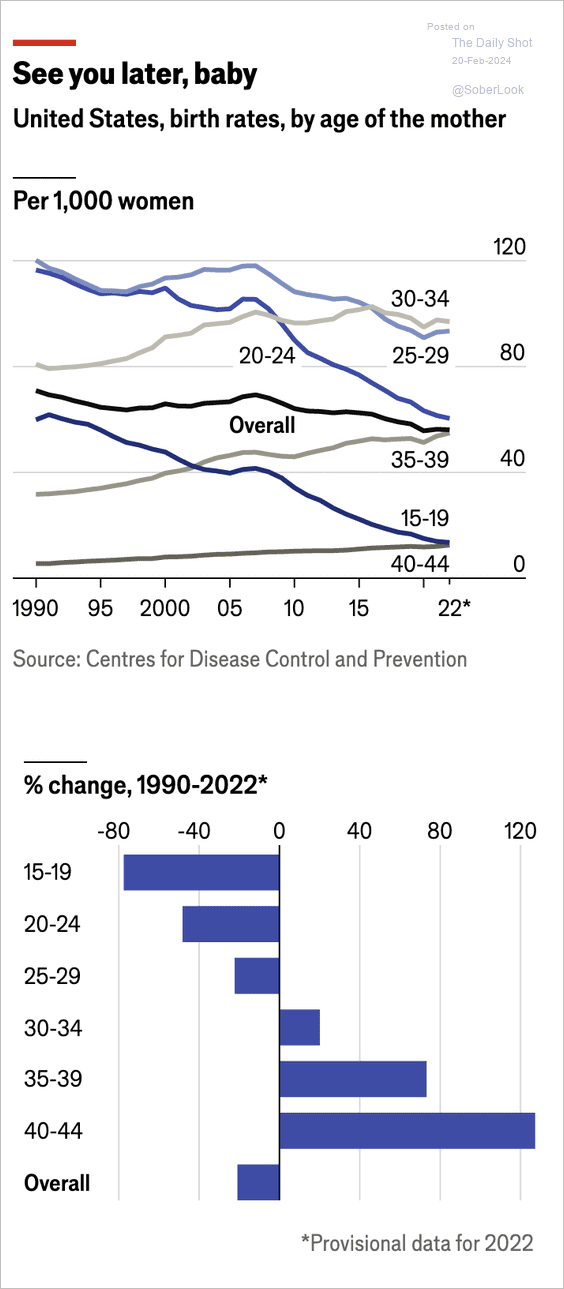 Source: The Economist Read full article
5. The Great Lakes ice cover:
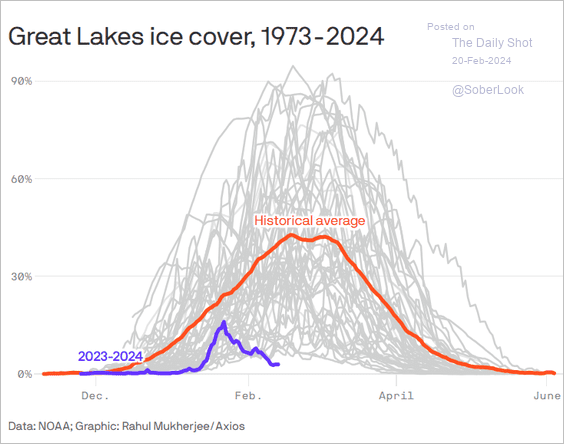 Source: @axios Read full article
6. Issues that are underreported by the national media:
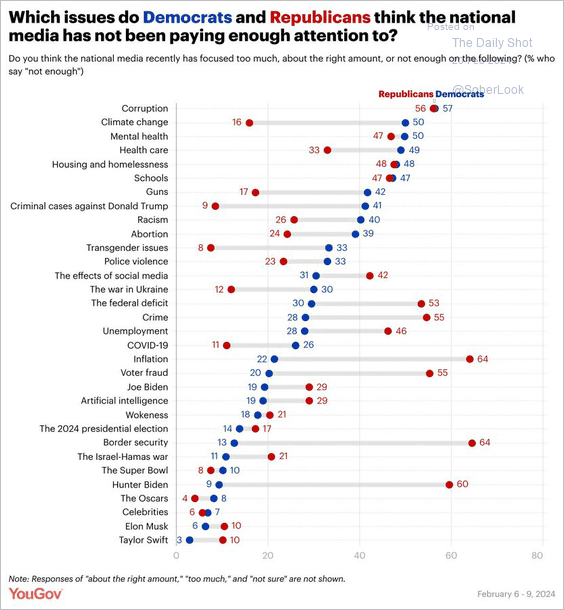 Source: @YouGovAmerica Read full article
7. The Google autocomplete, by state:
 Source: Bazomo Read full article
——————–
Back to Index