
The Daily Shot: 21-Feb-24
• The United States
• Canada
• The Eurozone
• Europe
• Japan
• Asia-Pacific
• China
• Emerging Markets
• Cryptocurrency
• Commodities
• Energy
• Equities
• Credit
• Global Developments
• Food for Thought
The United States
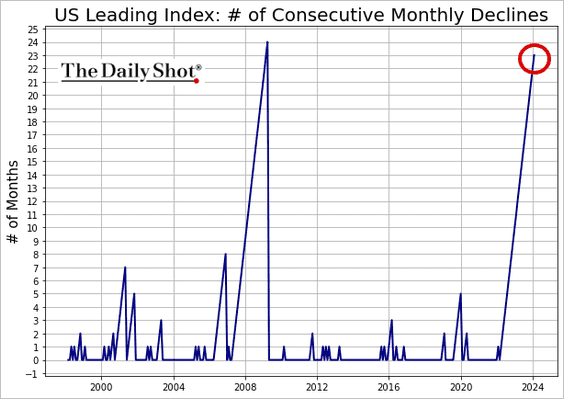
1. The Conference Board’s index of leading economic indicators declined again last month …
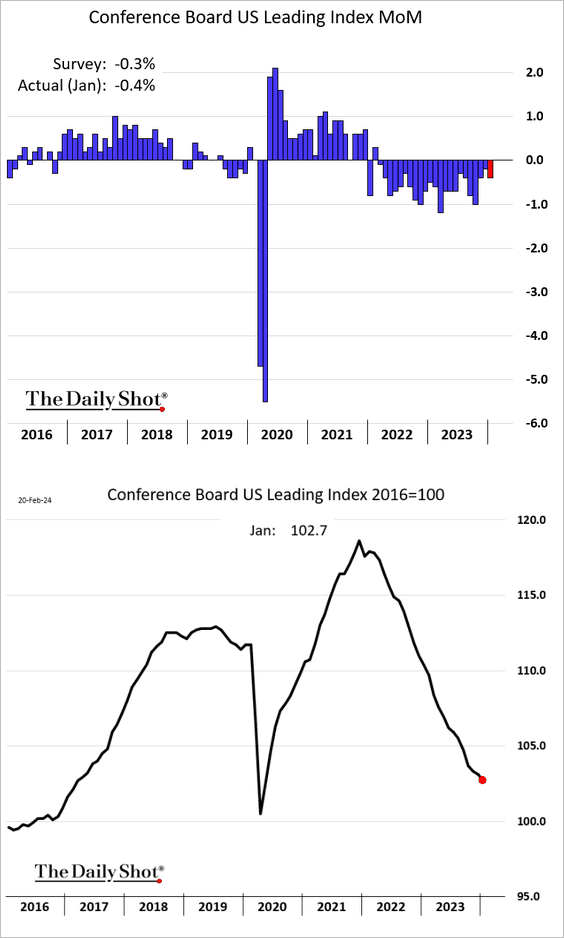
… for the 23rd month in a row.
• Last month’s adverse weather conditions negatively impacted the index, primarily through a sharp reduction in the average workweek.
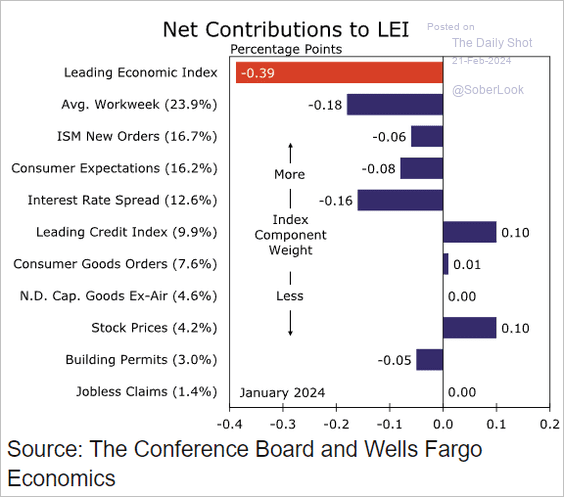 Source: Wells Fargo Securities
• While the six-month changes in the indicator continue to suggest recessionary conditions, the Conference Board no longer anticipates a recession.
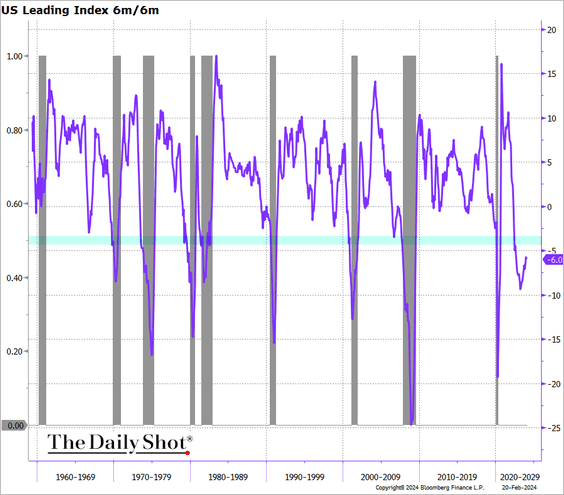
 Source: Reuters Read full article
——————–
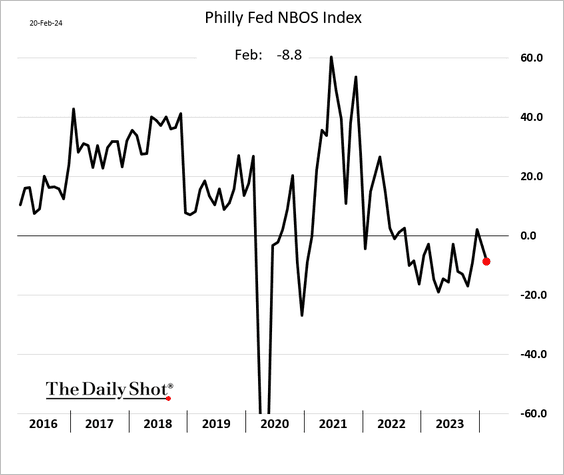
2. The Philly Fed’s regional survey of service firms moved back into contraction territory this month.
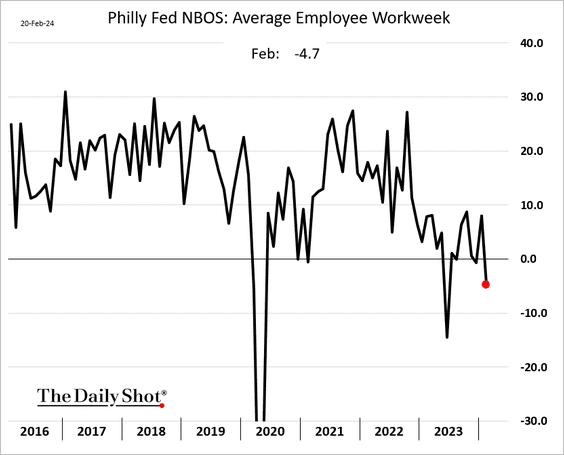
• Companies are cutting back workers’ hours.
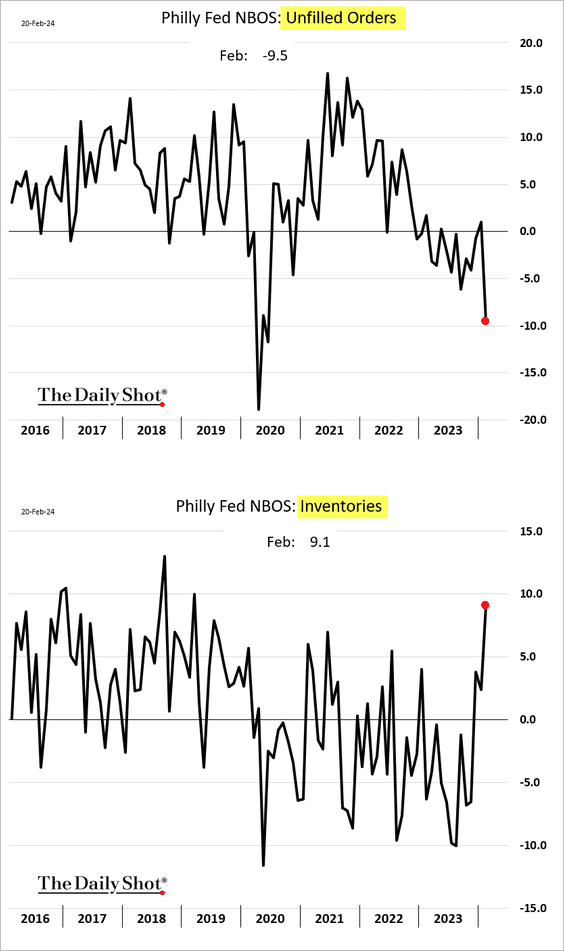
• The report shows signs of slack demand in the region.
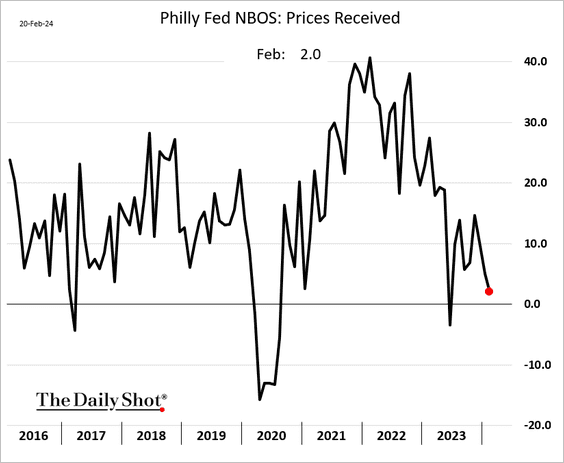
• Fewer firms are raising prices.
——————–
3. Growth in posted wages on Indeed continues to ease.
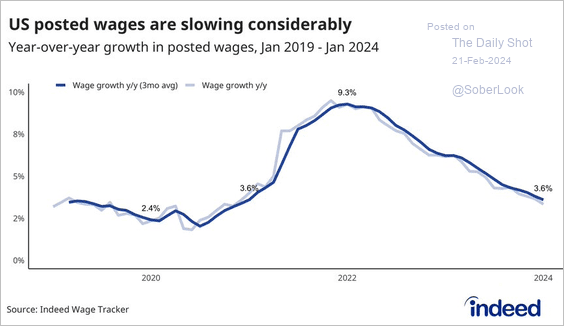 Source: @nick_bunker
4. This chart shows annual hours per US worker over time.
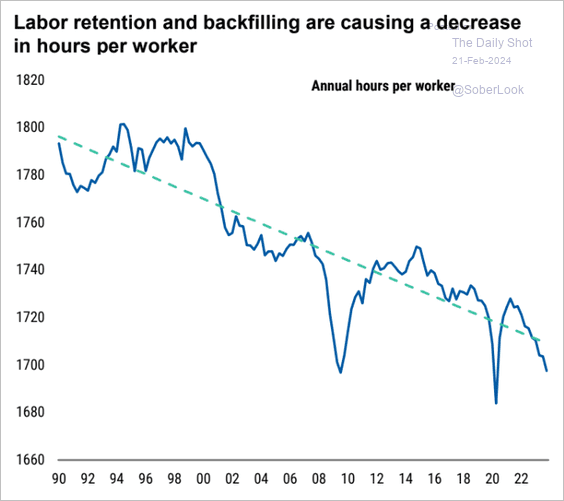 Source: Morgan Stanley Research
5. What if the Congressional Budget Office is underestimating the trajectory of Treasury yields?
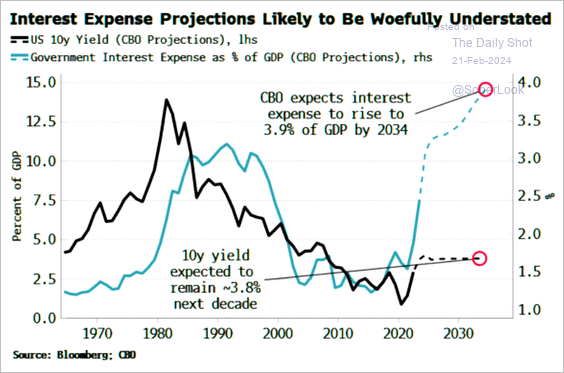 Source: Simon White, Bloomberg Markets Live Blog
Back to Index
Canada
1. The January CPI report surprised to the downside.
– Headline:
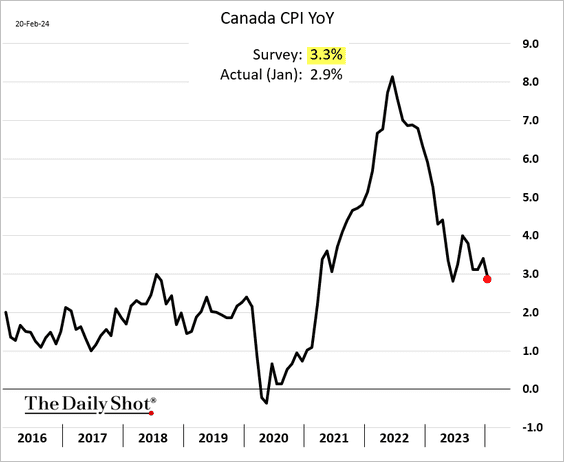
– Core:
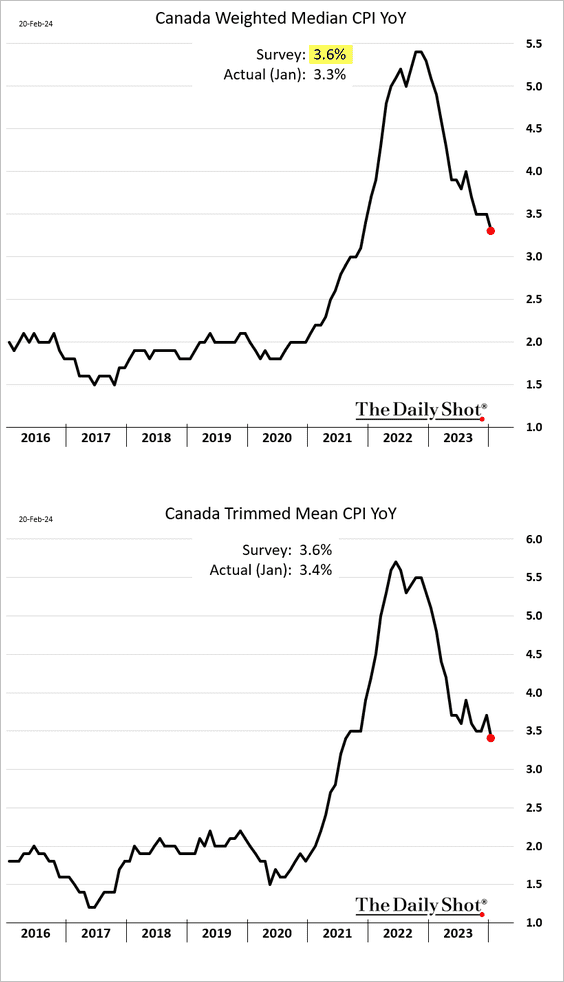
 Source: @economics Read full article
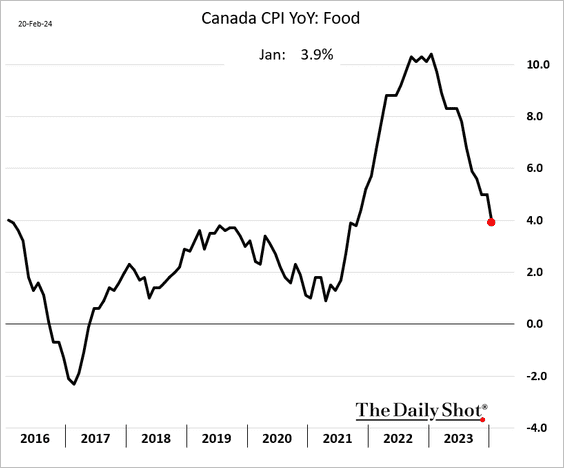
• Food inflation continues to ease.
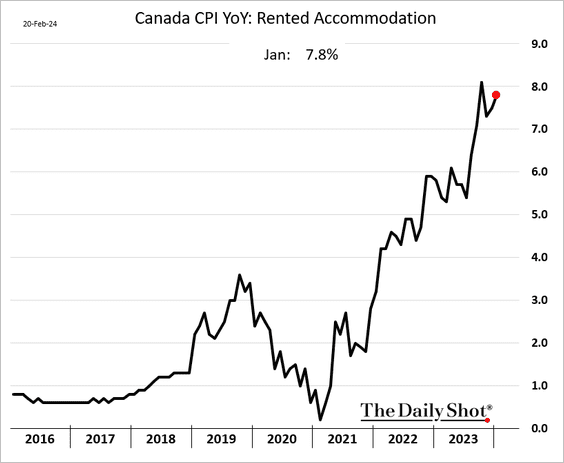
• Rent CPI remains very high.
——————–
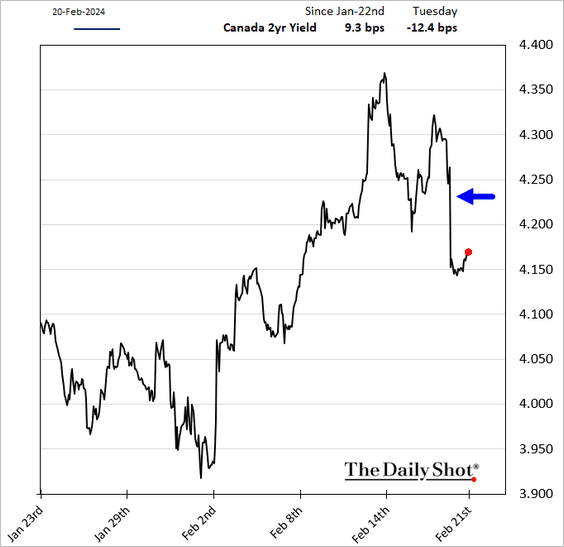
2. Rate cut expectations increased in response to the CPI report.
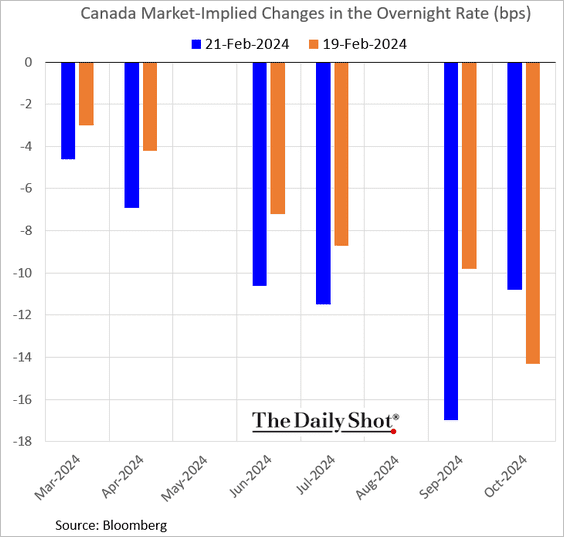
Bond yields dropped.
——————–
3. Here is a look at mortgage originations and mortgage rates by term.
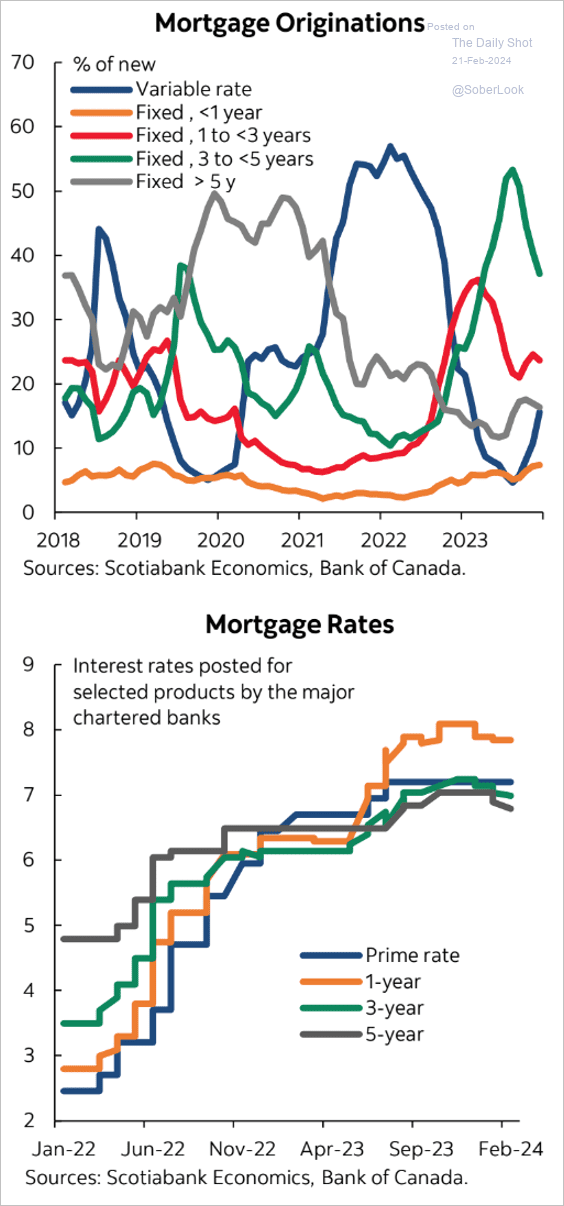 Source: Scotiabank Economics
4. Reserve balances continue to fall (resulting in tighter liquidity conditions).
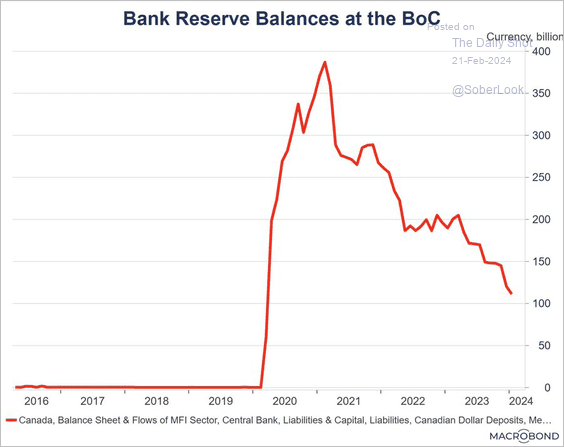 Source: @DavidBeckworth, @bankofcanada
Back to Index
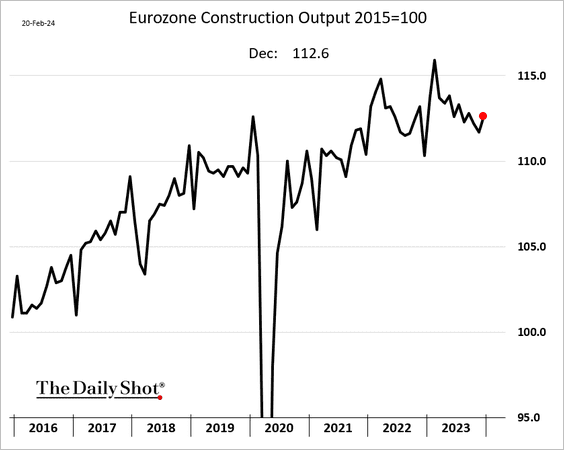
The Eurozone
1. Construction output moved higher in December.
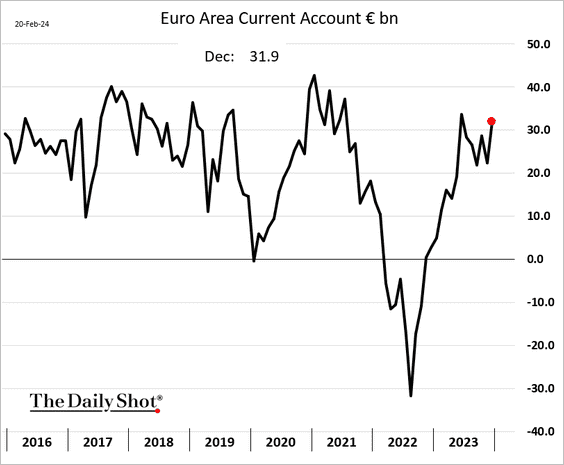
2. The current account surplus widened.
Back to Index
Europe
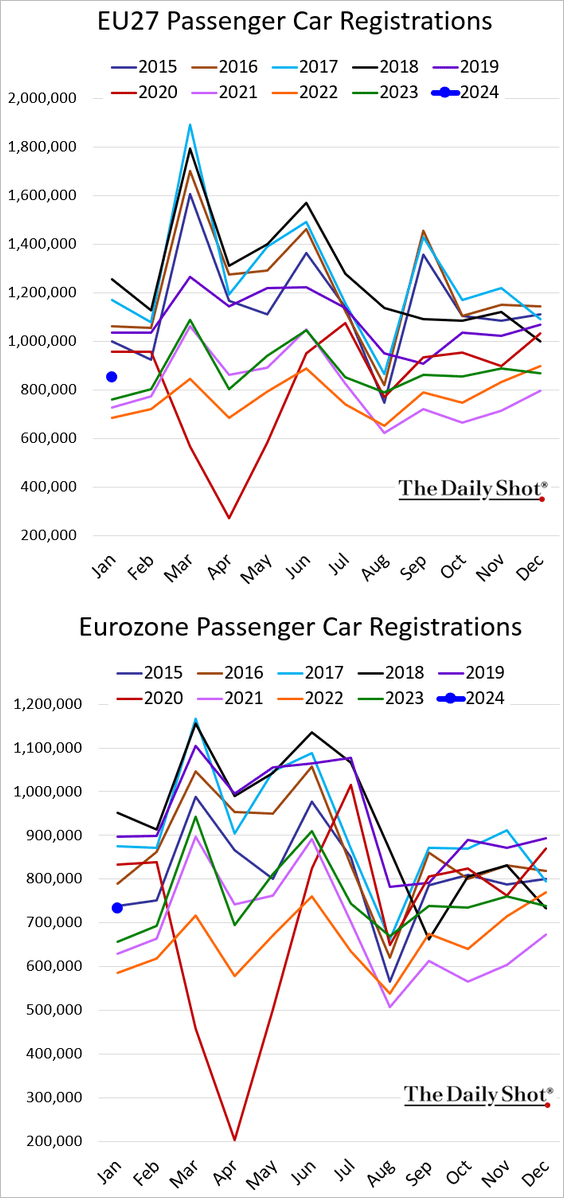
1. New car registrations in the EU were firmly above last year’s levels in January.
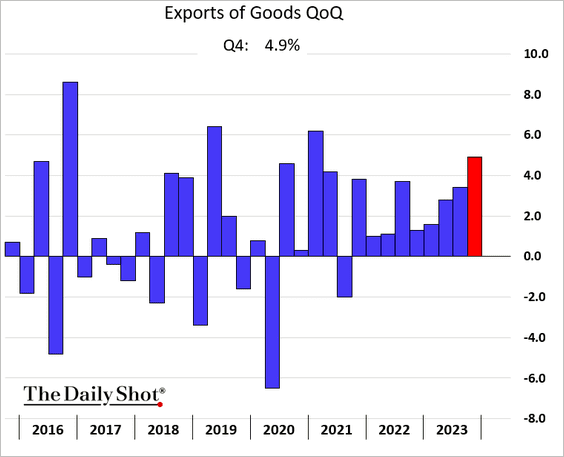
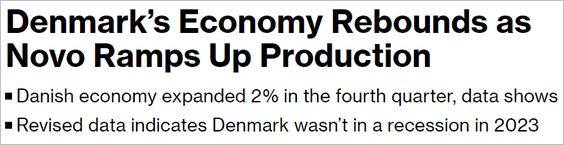
2. Denmark’s GDP surged last quarter, with revised data indicating that the country managed to avoid a recession in 2023.
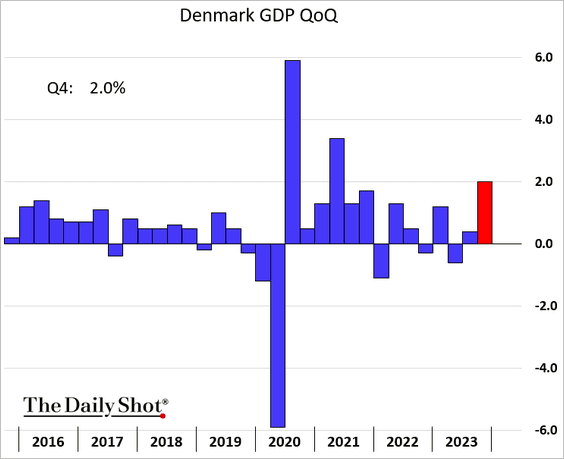
Exports jumped.
 Source: @economics Read full article
——————–
3. Poland’s industrial production finished the year on a softer note.
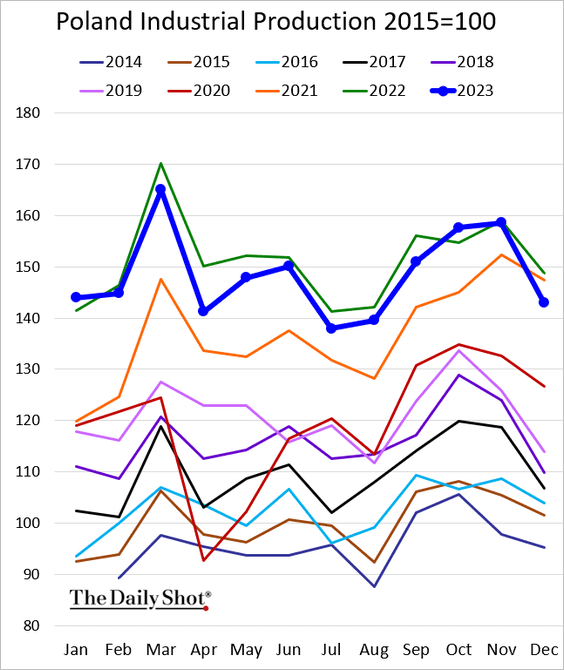
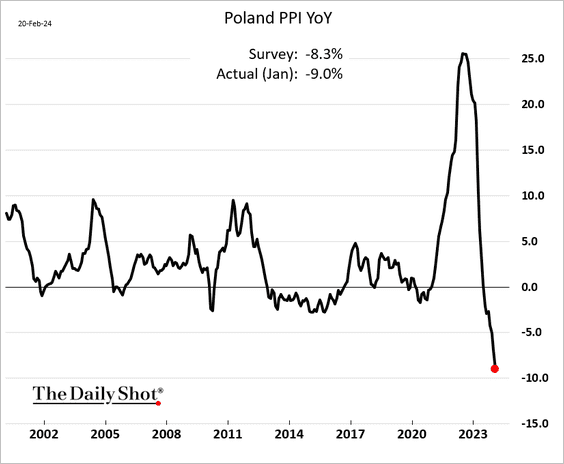
• The PPI posted a record year-over-year decline last month.
——————–
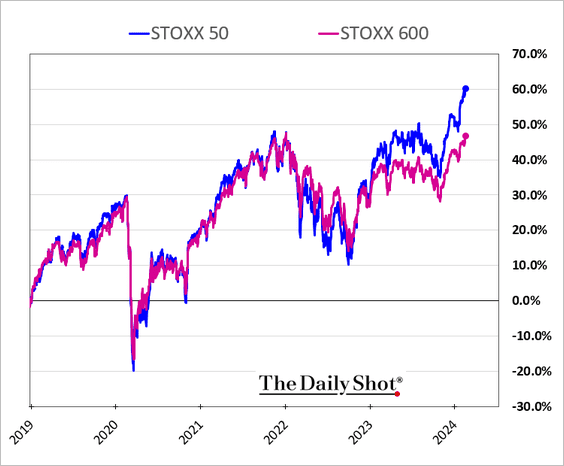
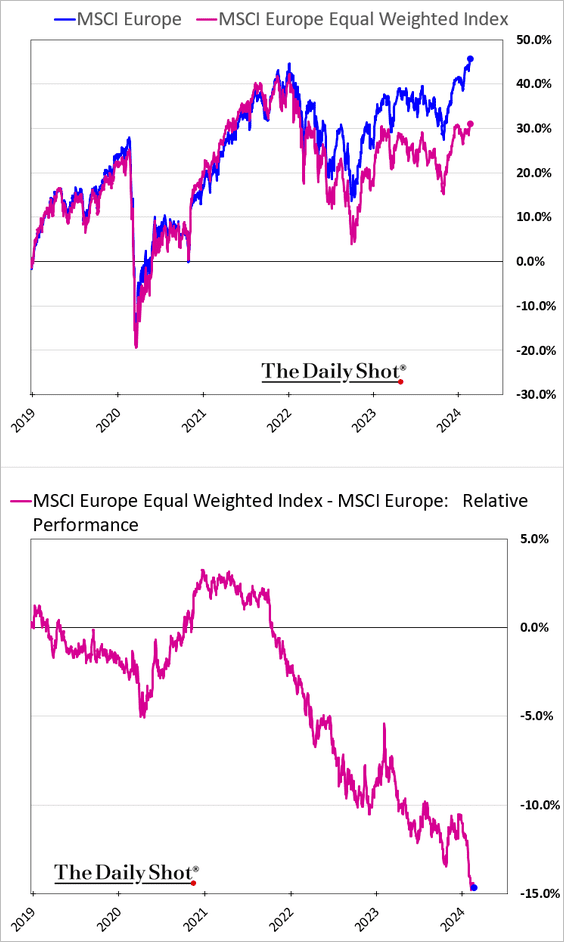
4. Shares of Europe’s biggest companies are increasingly outpacing the broader market (2 charts).
Back to Index
Japan
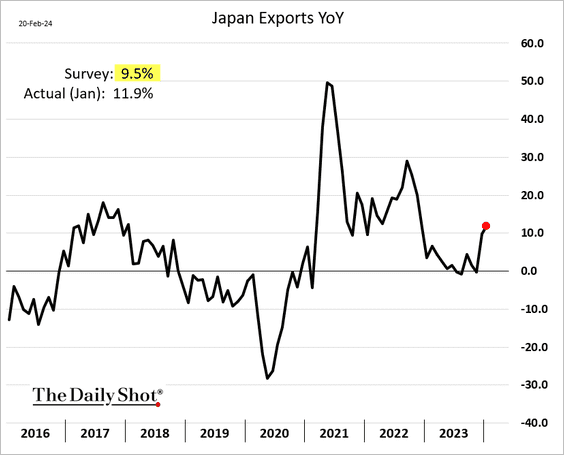
1. The seasonally adjusted trade balance unexpectedly returned to surplus last month.
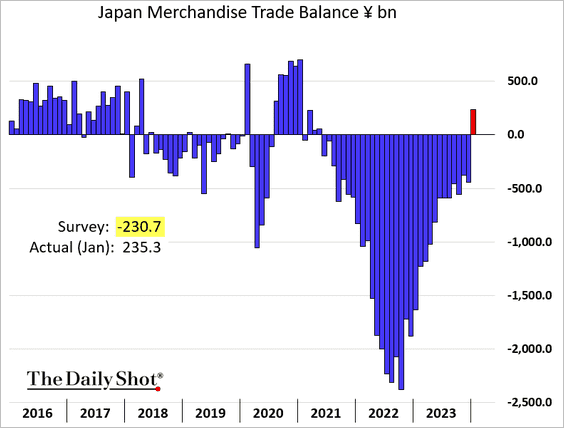
• Exports topped forecasts.
 Source: @technology Read full article
——————–
2. Home price appreciation has picked up momentum.
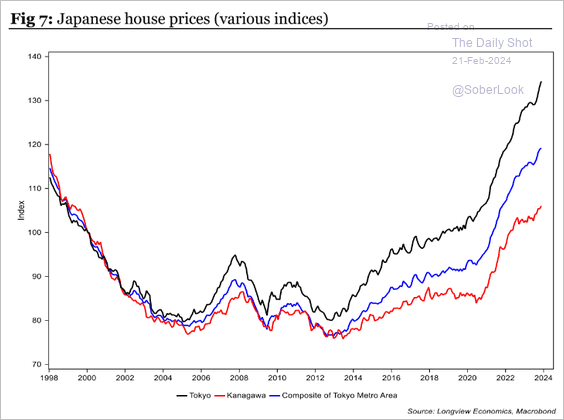 Source: Longview Economics
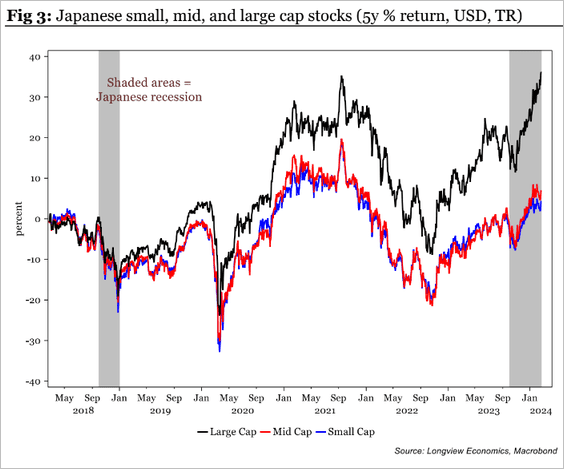
3. Japan’s equity market is becoming more concentrated, …
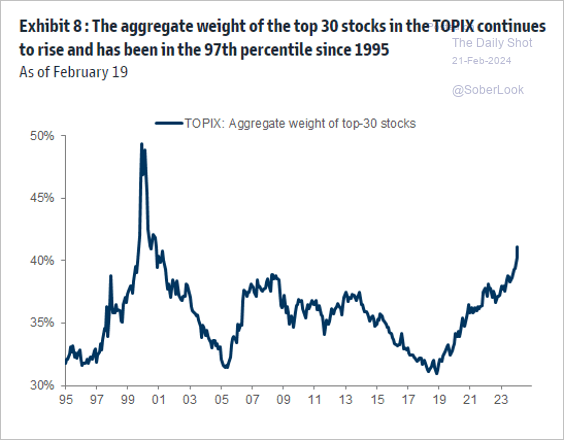 Source: Goldman Sachs; @MikeZaccardi
… as large caps increasingly outperform.
Back to Index
Asia-Pacific
1. Let’s begin with South Korea.
• Exports held up well this month.
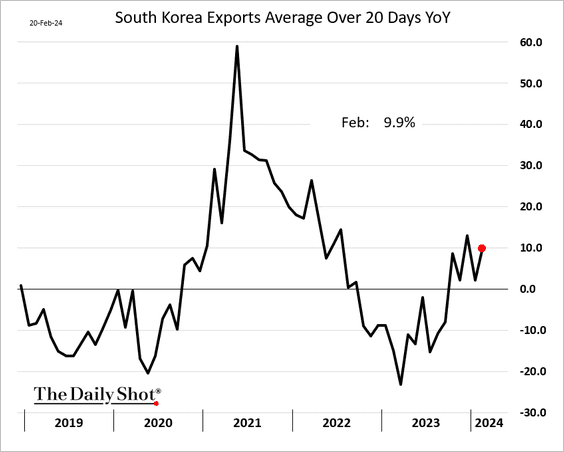 Source: Bloomberg
 Source: @technology Read full article
Here is the distribution of export destinations.
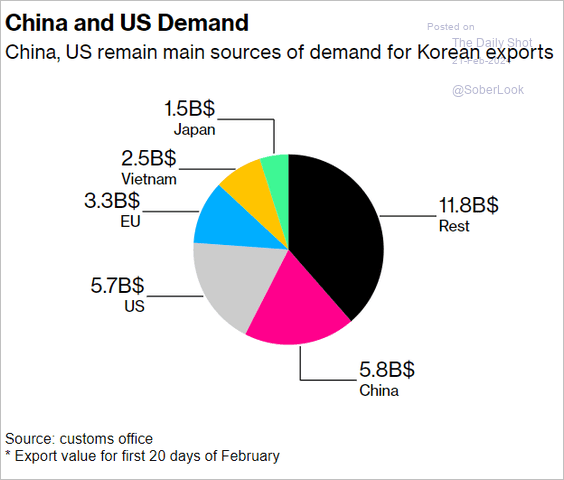 Source: @technology Read full article
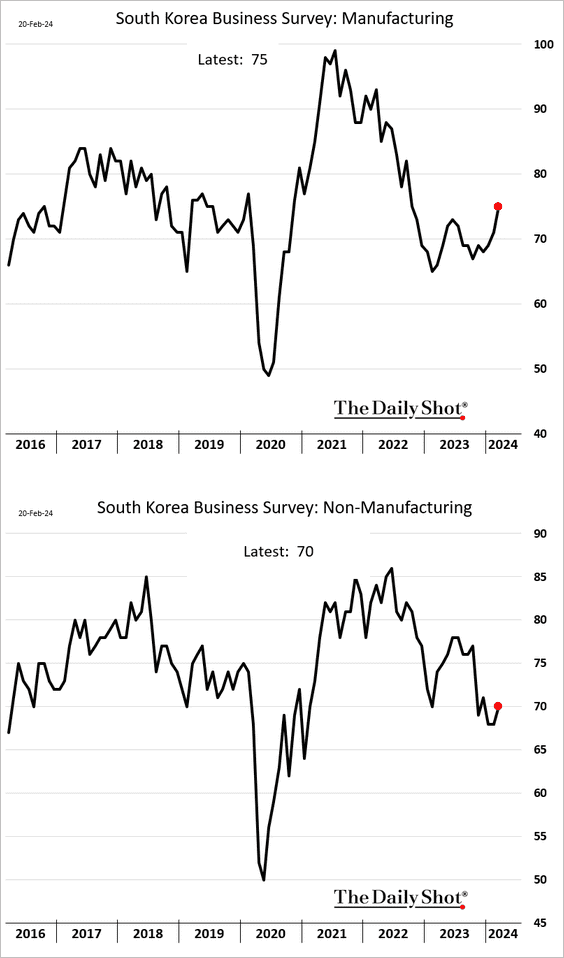
• Manufacturers are becoming more upbeat.
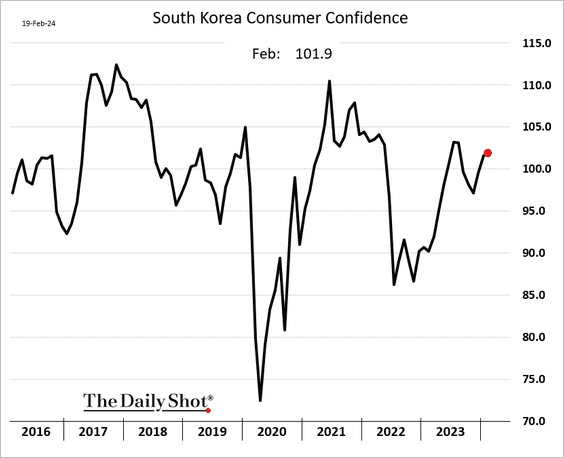
• Consumer sentiment remains robust.
——————–
2. Next, we have some updates on Australia.
• Wage growth remained elevated last quarter.
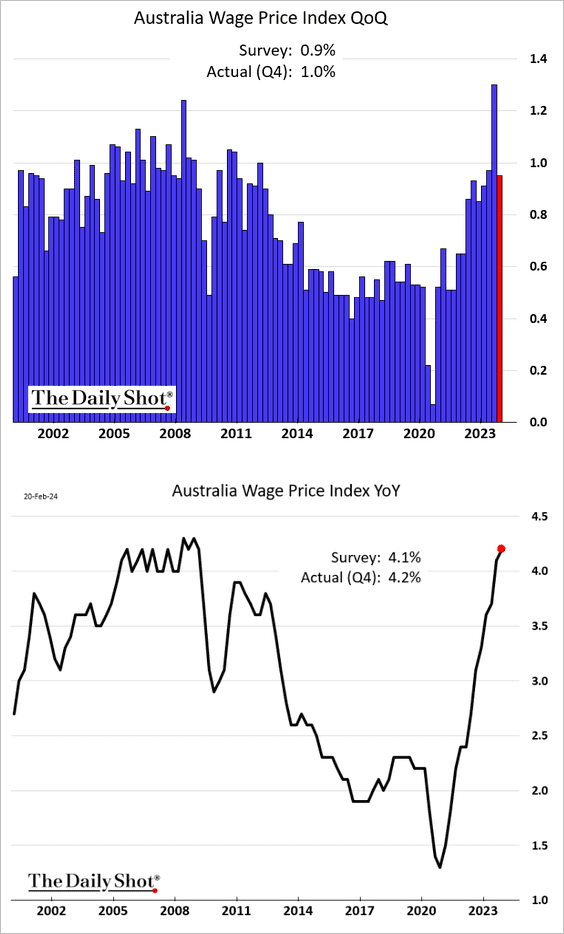
 Source: Reuters Read full article
• Australia’s rate differential with China points to a higher AUD/CNY.
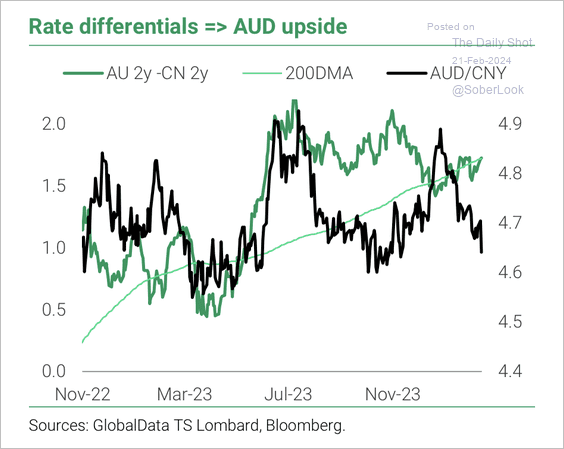 Source: TS Lombard
Back to Index
China
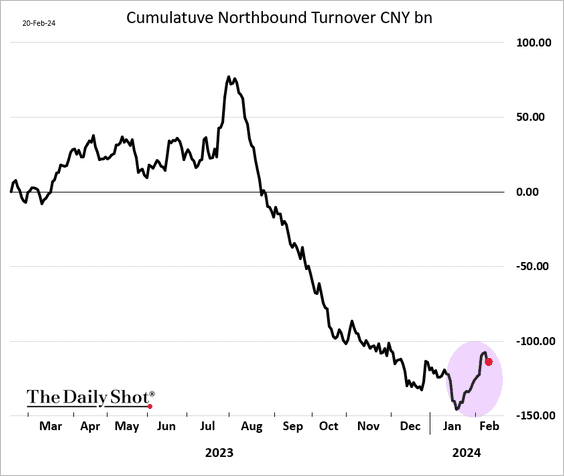
1. Stocks are rebounding as Bejing goes on a buying spree.
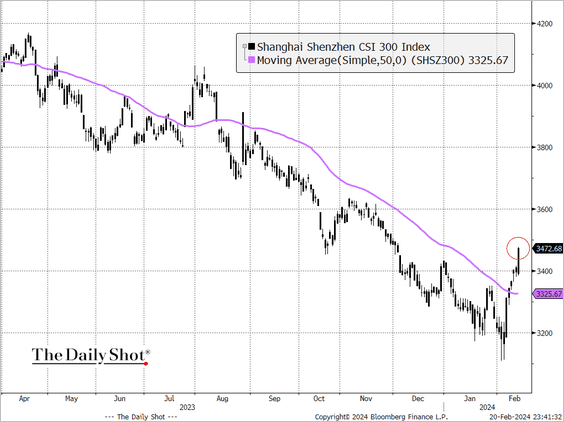
Capital flight from mainland stocks appears to have stopped.
——————–
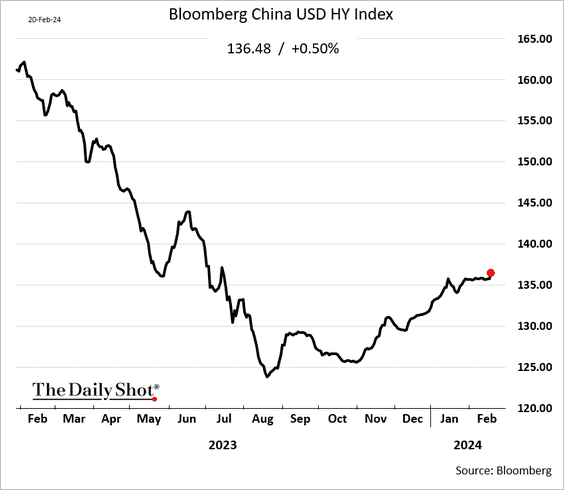
2. Dollar-denominated HY bonds are rebounding.
3. This chart shows real estate investment as a percent of GDP.
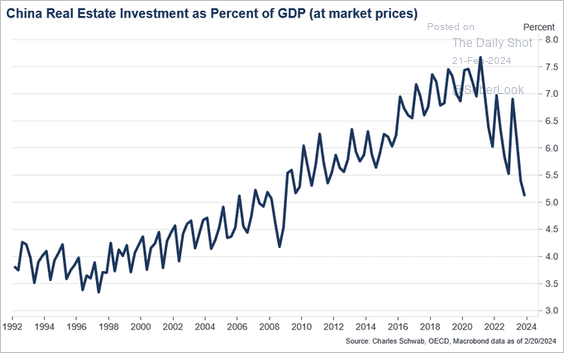 Source: @JeffreyKleintop
Back to Index
Emerging Markets
1. The decline in South Africa’s unemployment stalled last quarter.
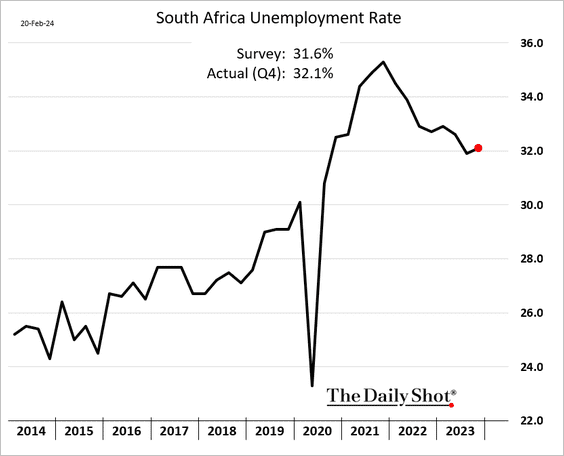
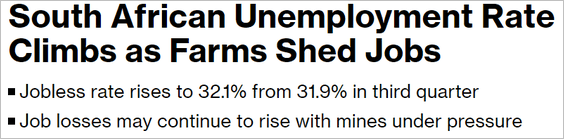 Source: @economics Read full article
——————–
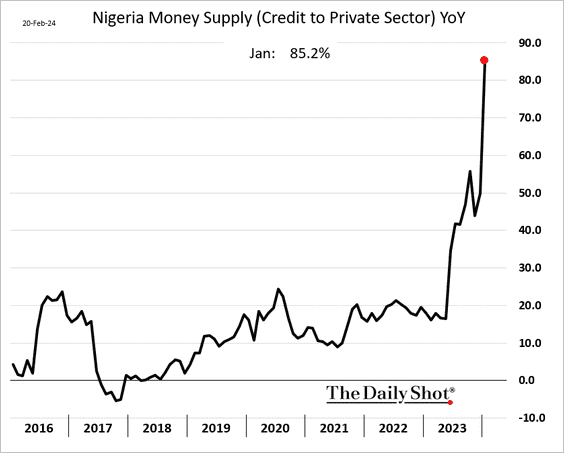
2. The Nigerian naira devaluation has been massive, …
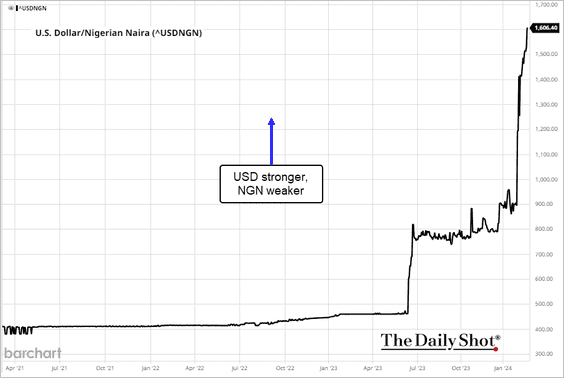
… amid surging money supply. Inflation will accelerate.
——————–
3. Tactically, developed-market equities appear stretched relative to emerging-market equities.
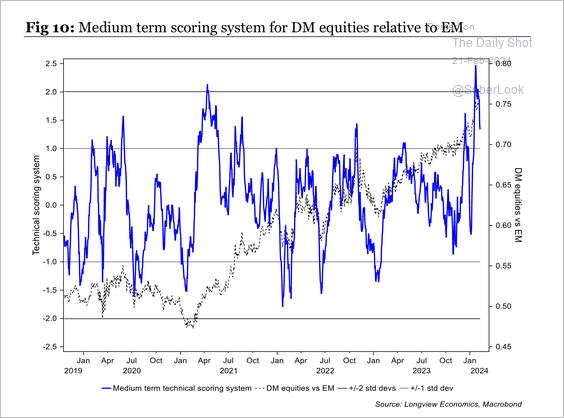 Source: Longview Economics
Back to Index
Cryptocurrency
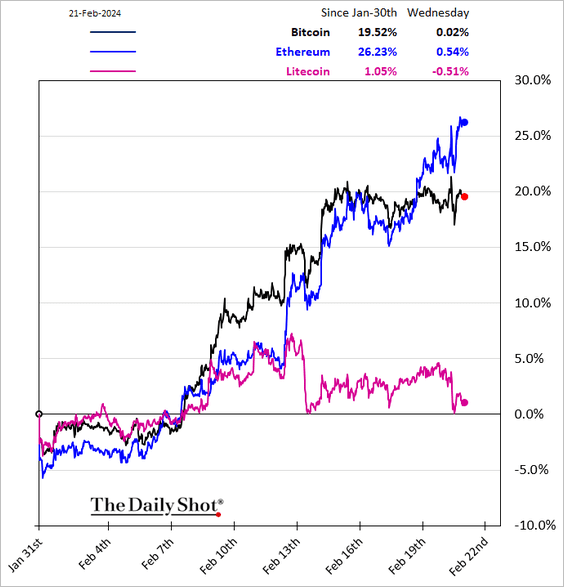
Litecoin has not been participating in the latest crypto rally.
Back to Index
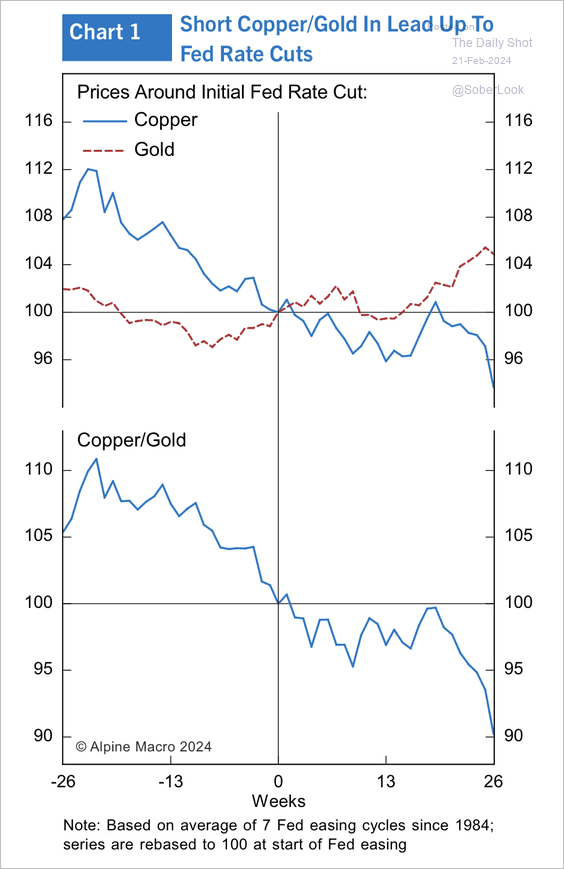
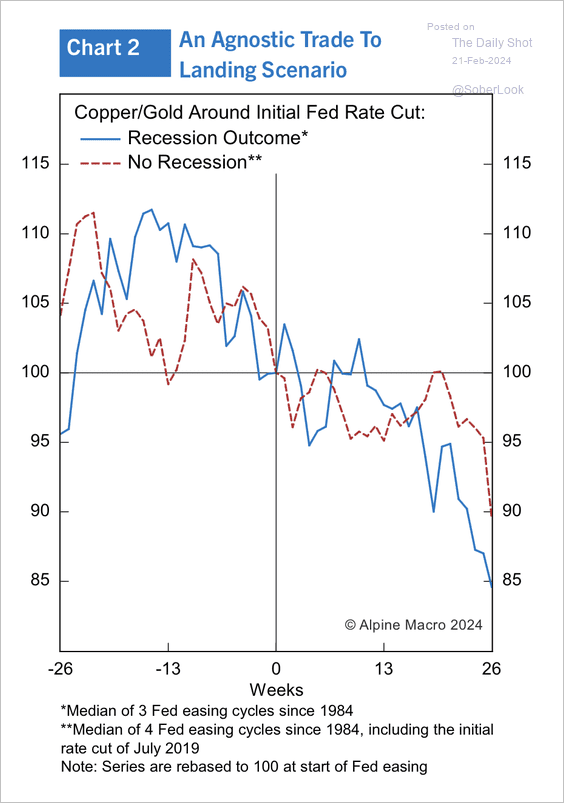
Commodities
1. The copper/gold ratio typically declines around the initial Fed rate cut, regardless of the recession outcome. (2 charts)
 Source: Alpine Macro
 Source: Alpine Macro
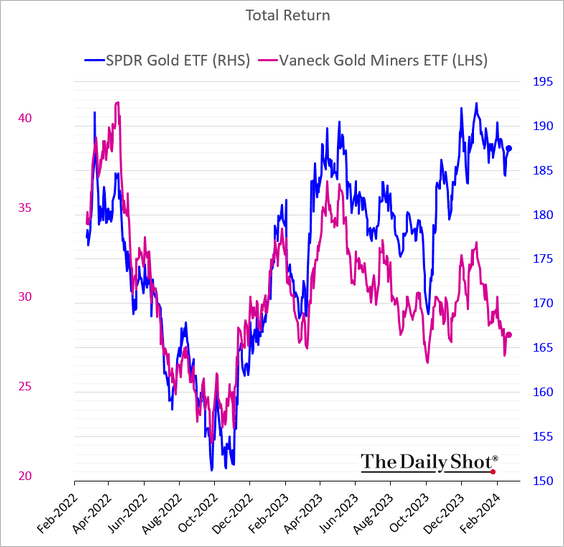
2. Shares of gold miners continue to diverge from gold.
3. The rally in cocoa futures resumed on Tuesday …
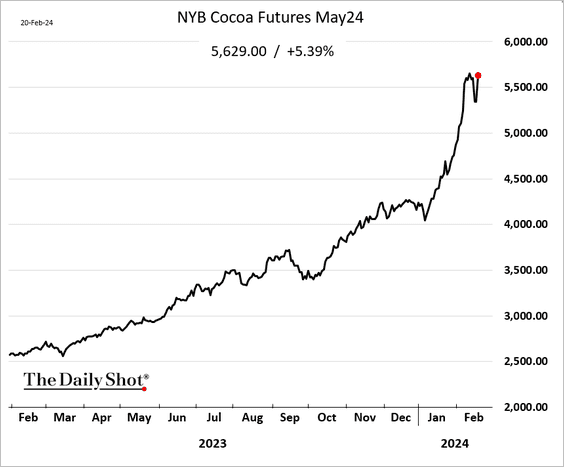
… amid massive market deficit.
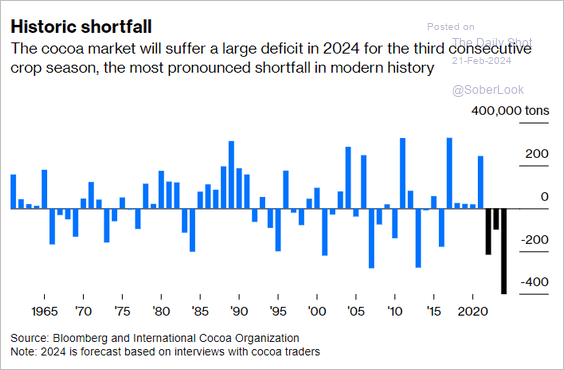 Source: @JavierBlas, @opinion Read full article
Back to Index
Energy
1. US natural gas futures surged following an announcement by Chesapeake Energy, a leading shale driller, detailing plans to reduce production in 2024 after experiencing a significant price drop.
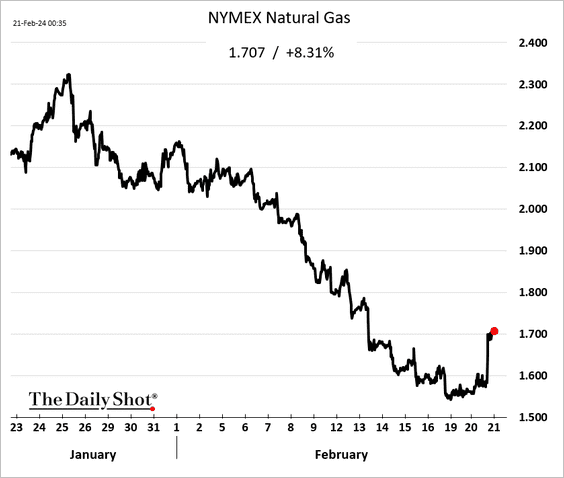
 Source: Reuters Read full article
——————–
2. Is US oil production peaking?
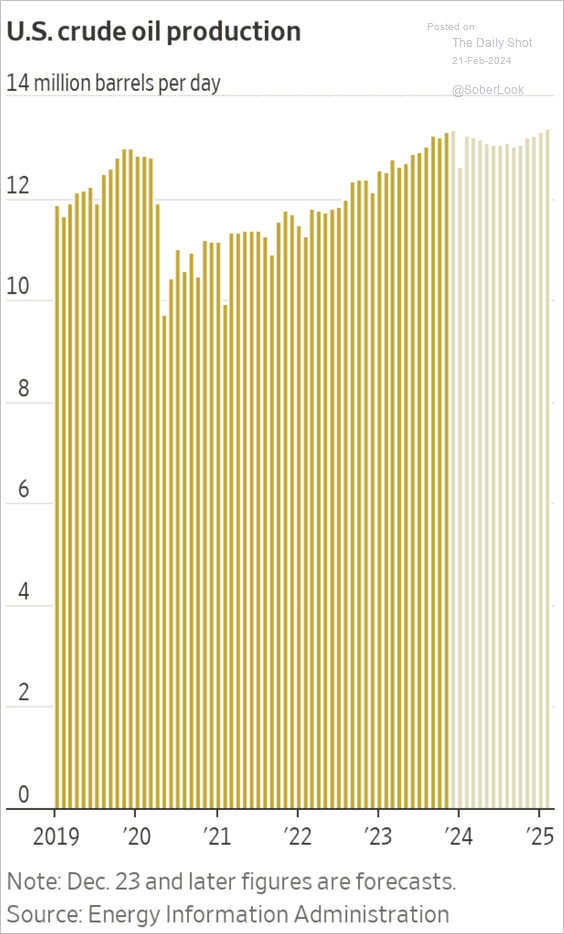 Source: @WSJ Read full article
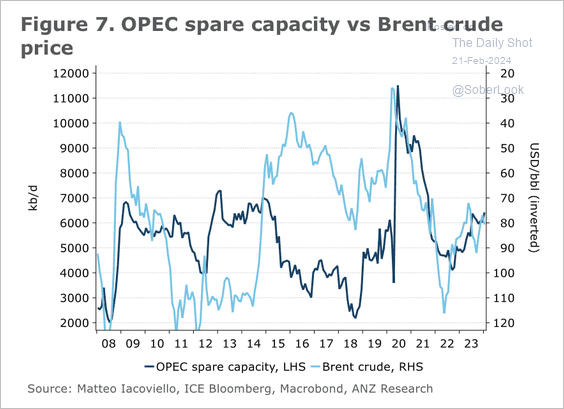
3. OPEC’s spare capacity tends to act as a safeguard against concerns of supply disruption and geopolitical risks. (2 charts)
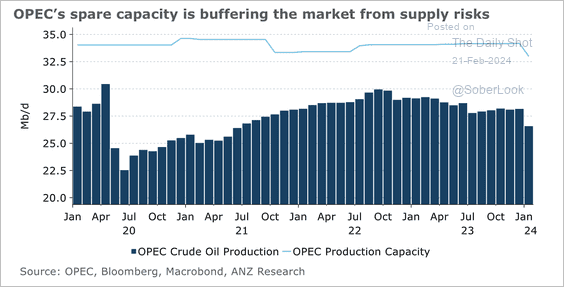 Source: @ANZ_Research
 Source: @ANZ_Research
Back to Index
Equities
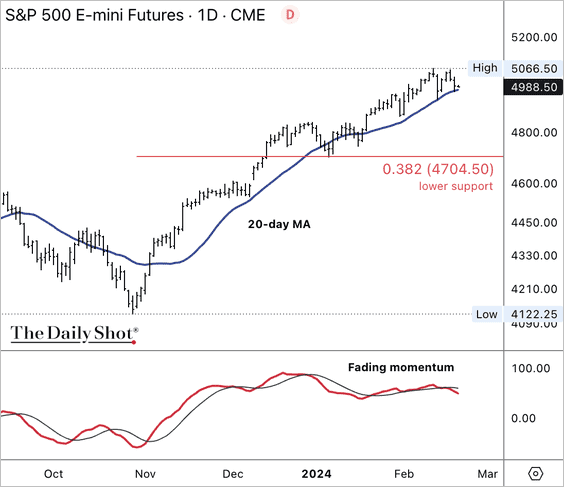
1. The S&P 500’s uptrend from the October 2023 low is losing momentum.
2. S&P 500 bullish sentiment appears stretched.
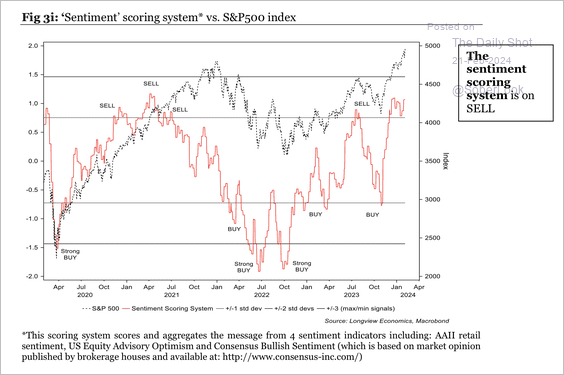 Source: Longview Economics
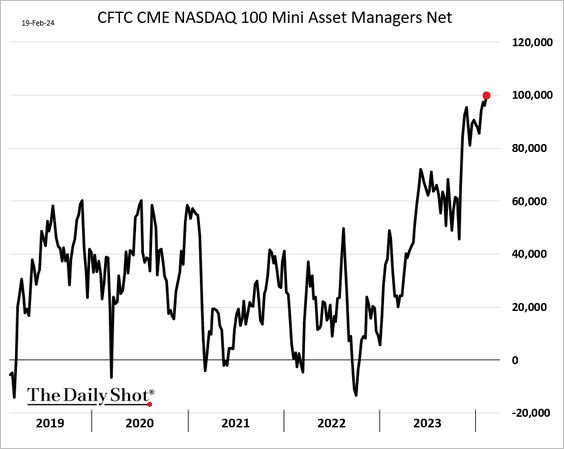
• Asset managers have been boosting their bets on Nasdaq 100 futures.
• Tech options market sentiment signals extreme optimism.
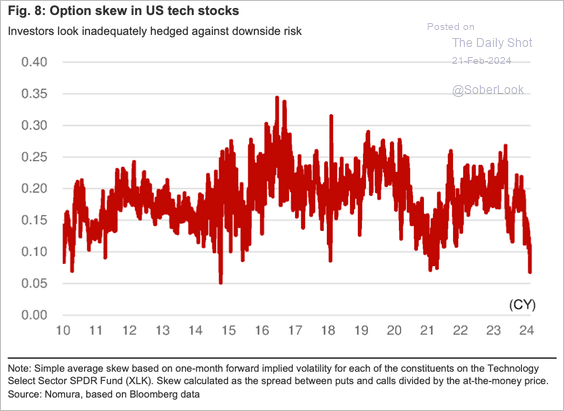 Source: Nomura; @dailychartbook
——————–
3. Earnings momentum for the S&P 500, excluding the ‘Magnificent 7,’ is deteriorating.
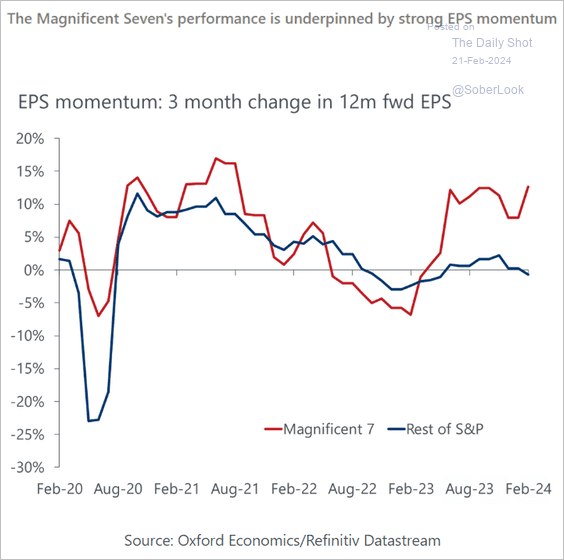 Source: Oxford Economics
4. S&P 500 company guidance has been relatively weak.
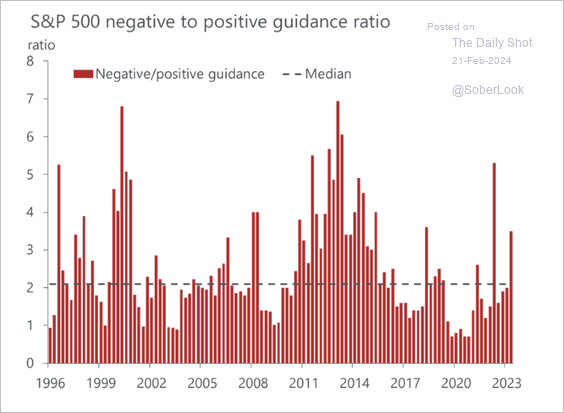 Source: Oxford Economics
5. Here is a look at earnings sentiment globally.
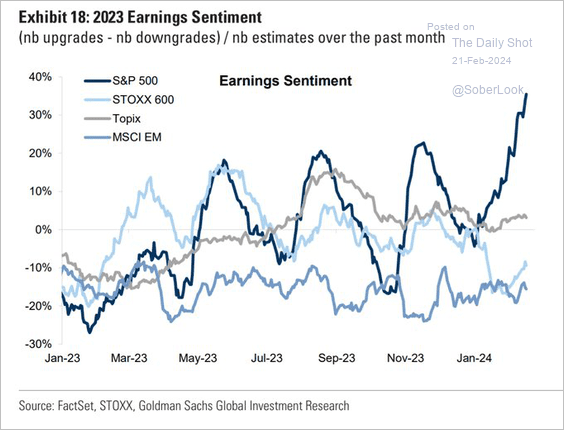 Source: Goldman Sachs; @WallStJesus
6. Passive fund flows are accelerating.
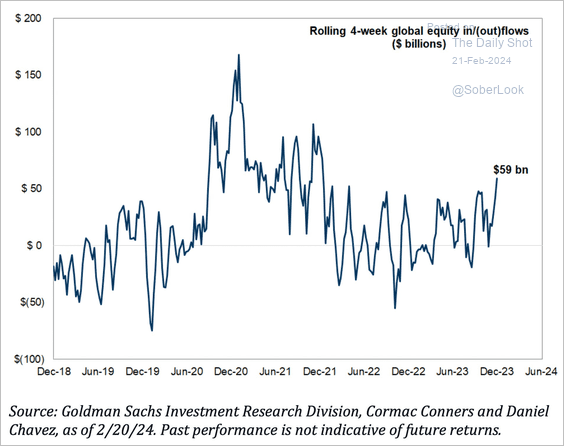 Source: Goldman Sachs; @dailychartbook
7. Short interest across large and small caps continues to trend lower.
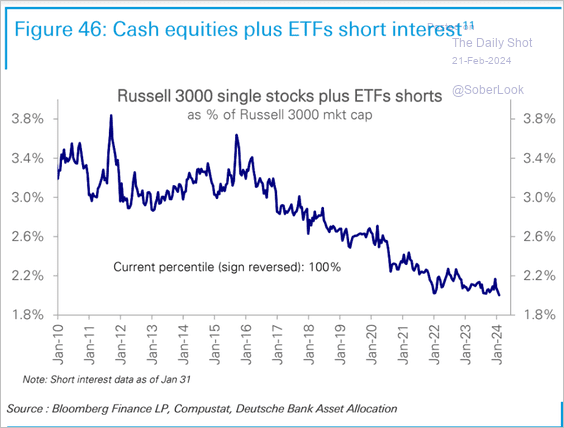 Source: Deutsche Bank Research
Here is the one-month change by sector.
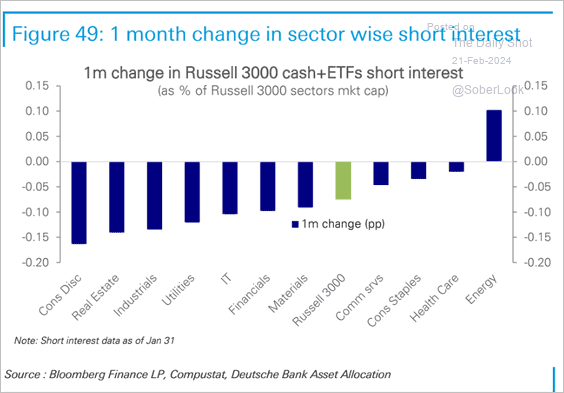 Source: Deutsche Bank Research
——————–
8. Implied volatility for small-cap stocks remains on a divergent path compared to that of large-cap stocks.
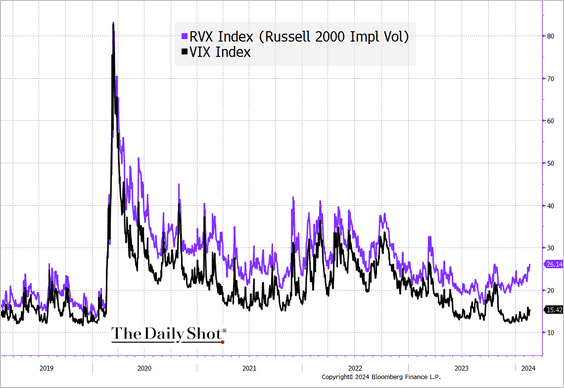 Source: @TheTerminal, Bloomberg Finance L.P.
Back to Index
Credit
1. Bankruptcy filings have been moving lower.
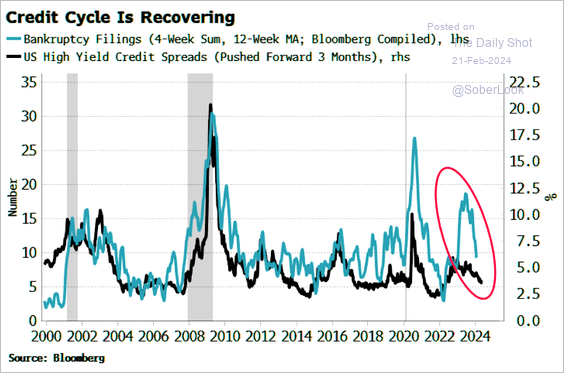 Source: Simon White, Bloomberg Markets Live Blog
2. Corporate credit recovery rates are trending down.
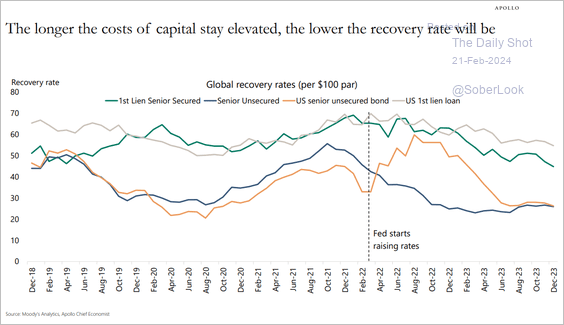 Source: Torsten Slok, Apollo
3. The share of single-B bonds in the high-yield market is increasing, while the proportion of BB-rated bonds is declining.
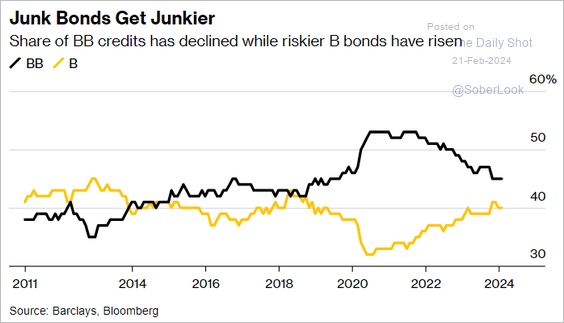 Source: @markets Read full article
4. US CLO issuance remains robust.
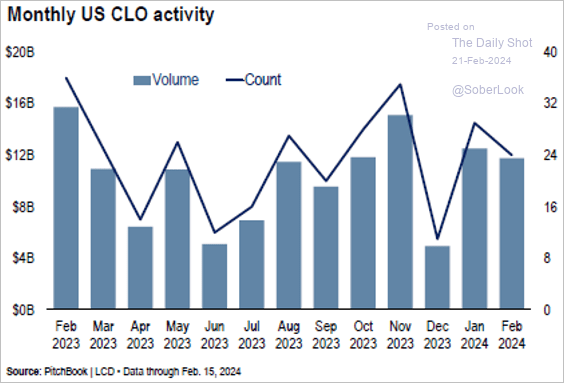 Source: PitchBook
Back to Index
Global Developments
1. There is growing economic divergence within G10 nations.
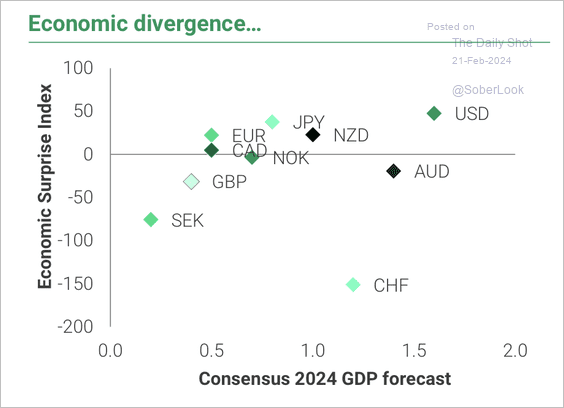 Source: TS Lombard
2. Manufacturing data have been surprising to the upside.
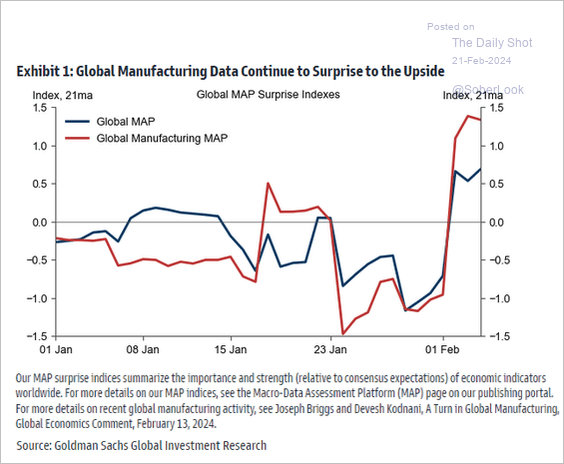 Source: Goldman Sachs; @MikeZaccardi
——————–
Food for Thought
1. Battery prices:
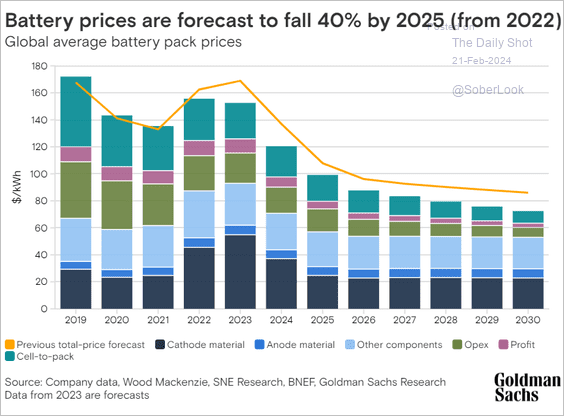 Source: Goldman Sachs
2. Number of debit/credit card transactions per month:
![]() Source: BofA Global Research; @MikeZaccardi
Source: BofA Global Research; @MikeZaccardi
3. Wealth allocation for the top 1% and the bottom 50%:
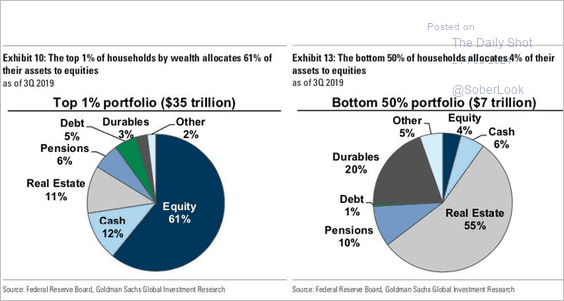 Source: Goldman Sachs; @MikeZaccardi
4. World leaders’ approval ratings:
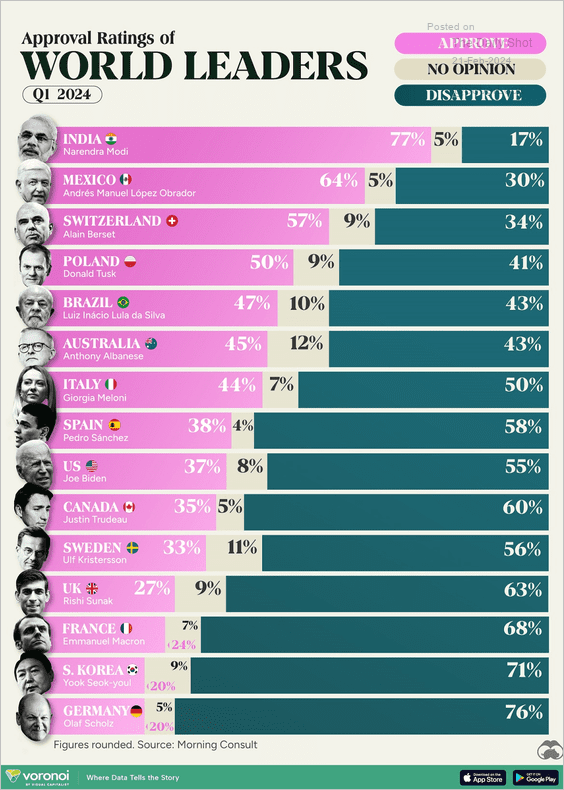 Source: Visual Capitalist Read full article
5. Fertility rates by state:
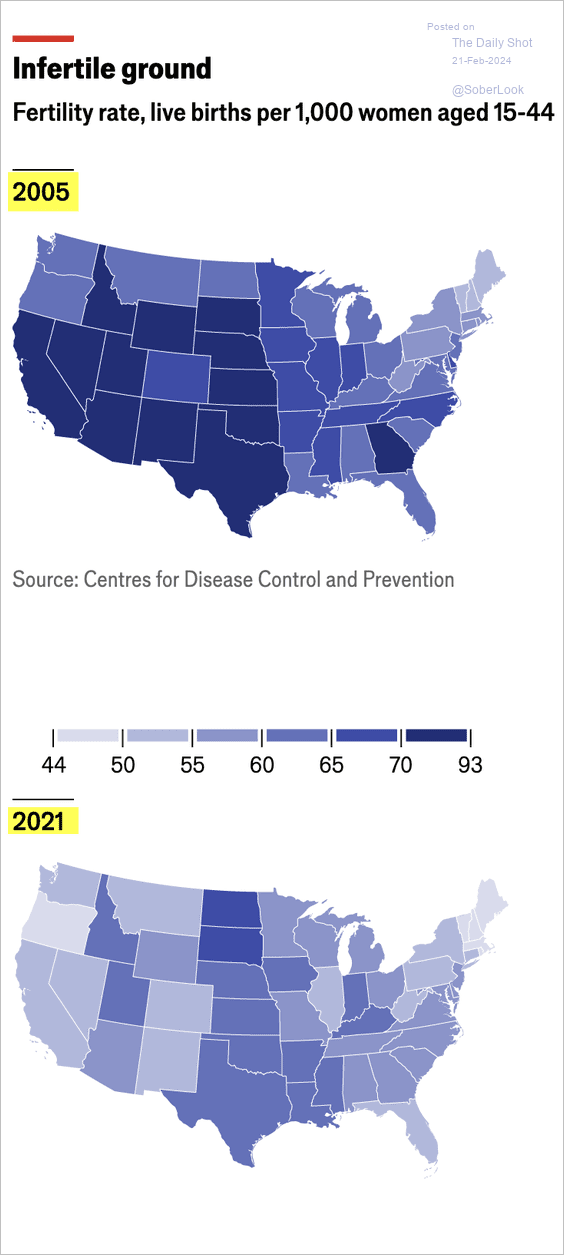 Source: The Economist Read full article
6. What do people choose to forgo during Lent?
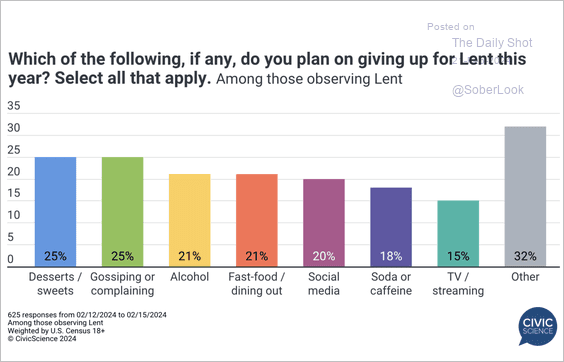 Source: @CivicScience Read full article
——————–
Back to Index