
The Daily Shot: 01-Mar-24
• The United States
• Canada
• The United Kingdom
• The Eurozone
• Europe
• Japan
• Asia-Pacific
• China
• Emerging Markets
• Cryptocurrency
• Commodities
• Equities
• Credit
• Rates
• Global Developments
• Food for Thought
The United States
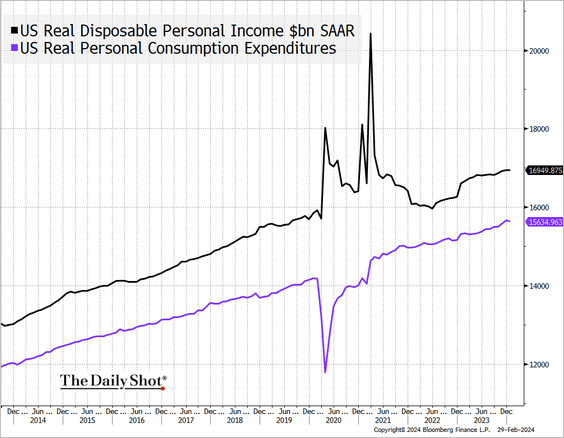
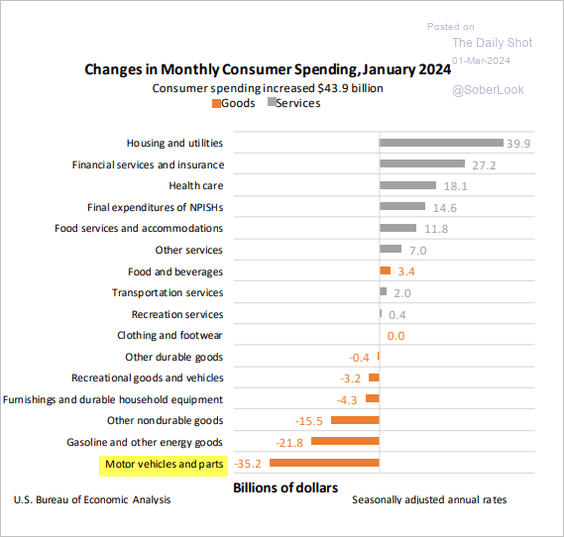
1. Although nominal personal income saw a significant increase in January, …
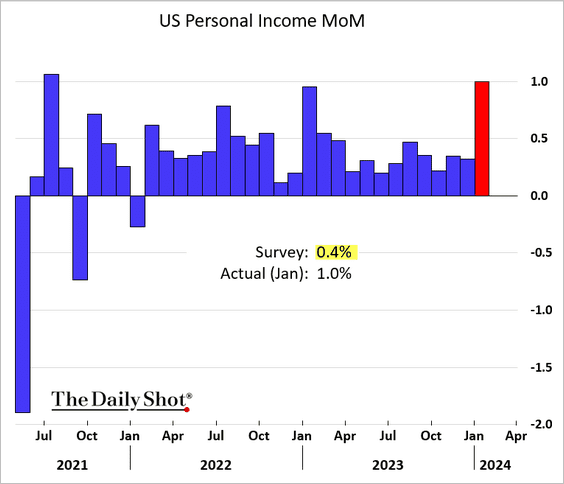
… real disposable personal income remained essentially unchanged (due to a surge in inflation), with real spending experiencing a decline.
 Source: @TheTerminal, Bloomberg Finance L.P.
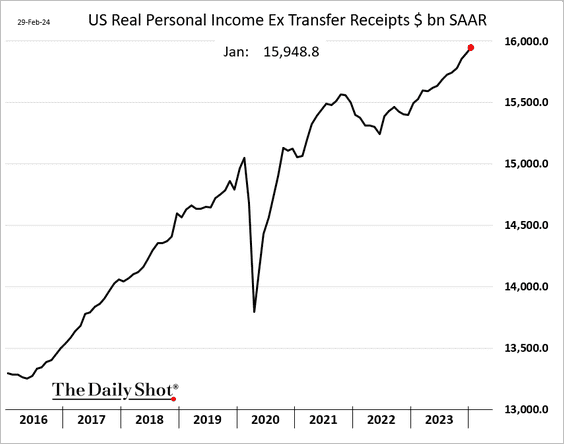
• Real personal income, excluding government payments, continues to climb.
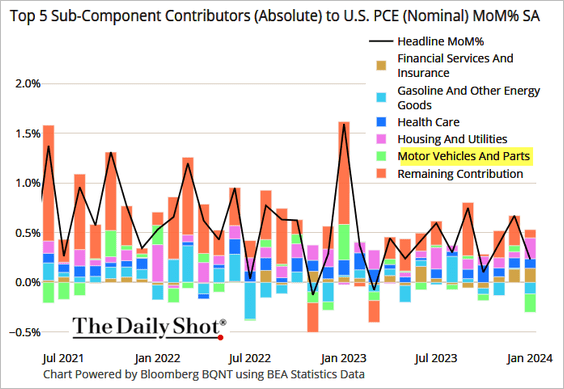
• Weaker vehicle purchases weighed down overall consumer spending, partially attributed to adverse weather conditions in January.
 Source: @TheTerminal, Bloomberg Finance L.P.
 Source: BEA
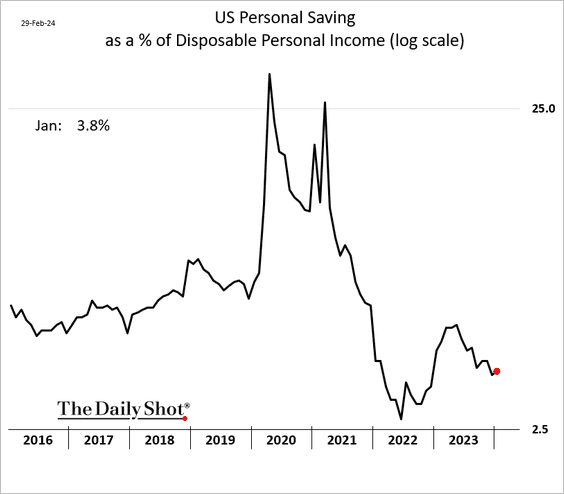
• The personal saving rate, as a percentage of disposable personal income, registered a slight increase.
——————–
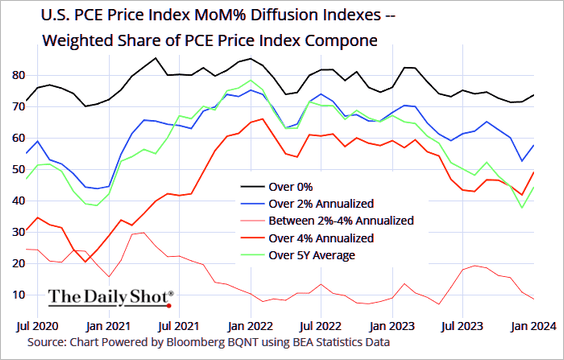
2. As we saw in the CPI and PPI reports, the PCE inflation report showed price increases accelerating in January.
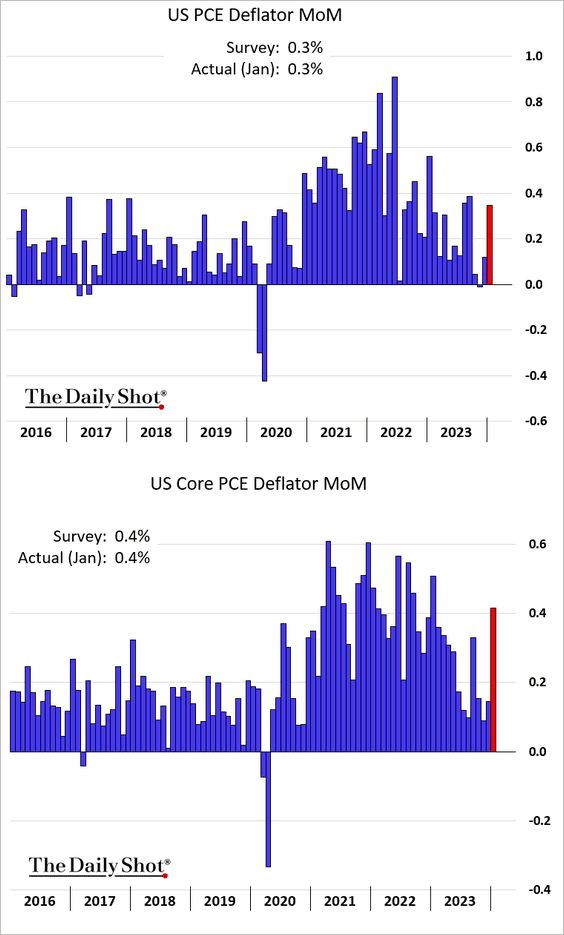
 Source: @TheTerminal, Bloomberg Finance L.P.
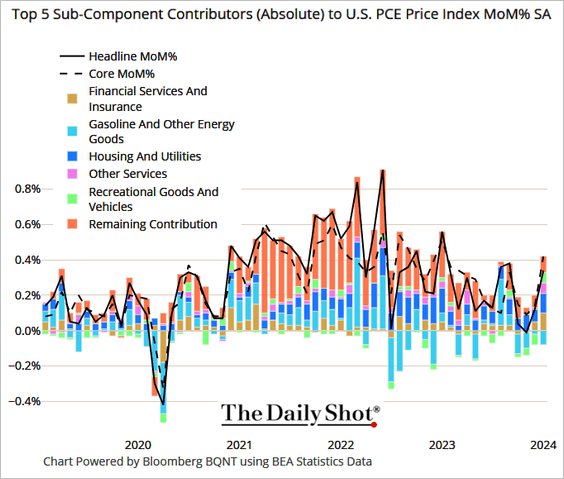
• This chart shows the PCE inflation diffusion index.
 Source: @TheTerminal, Bloomberg Finance L.P.
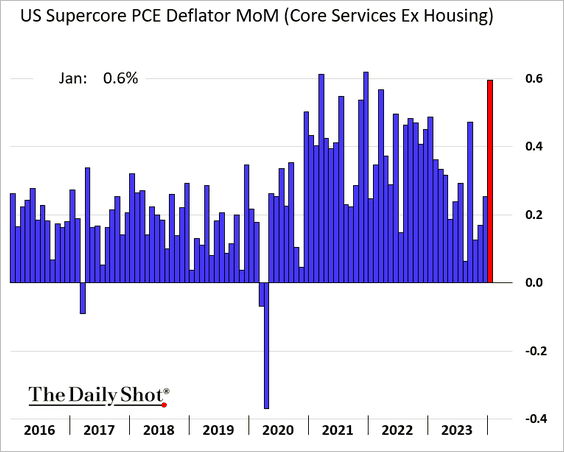
• The supercore PCE inflation, closely monitored by the Fed, surged in January. This picture does not scream “rate cuts.”
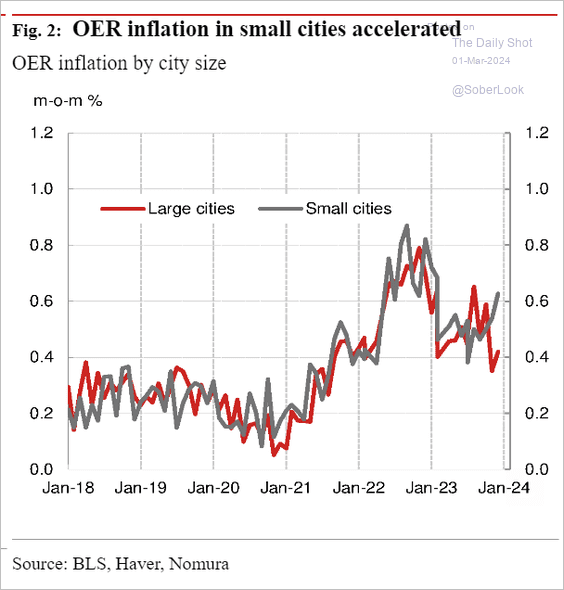
Separately, the Owners’ Equivalent Rent (OER) inflation accelerated in small cities, diverging from large cities.
 Source: Nomura Securities
——————–
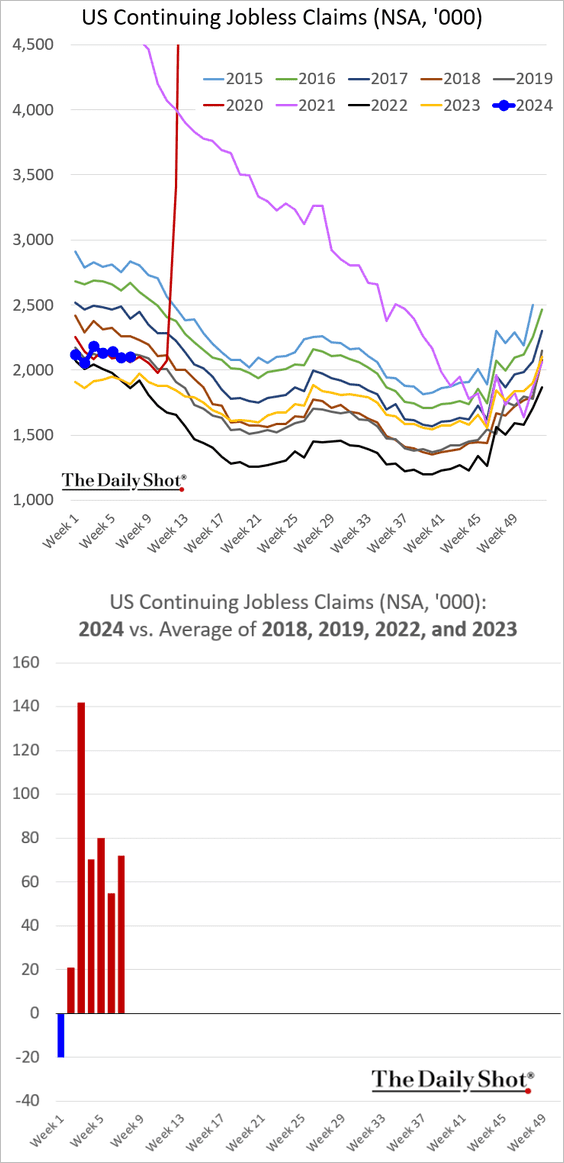
3. Initial jobless claims were again at multi-year lows for this time of the year.
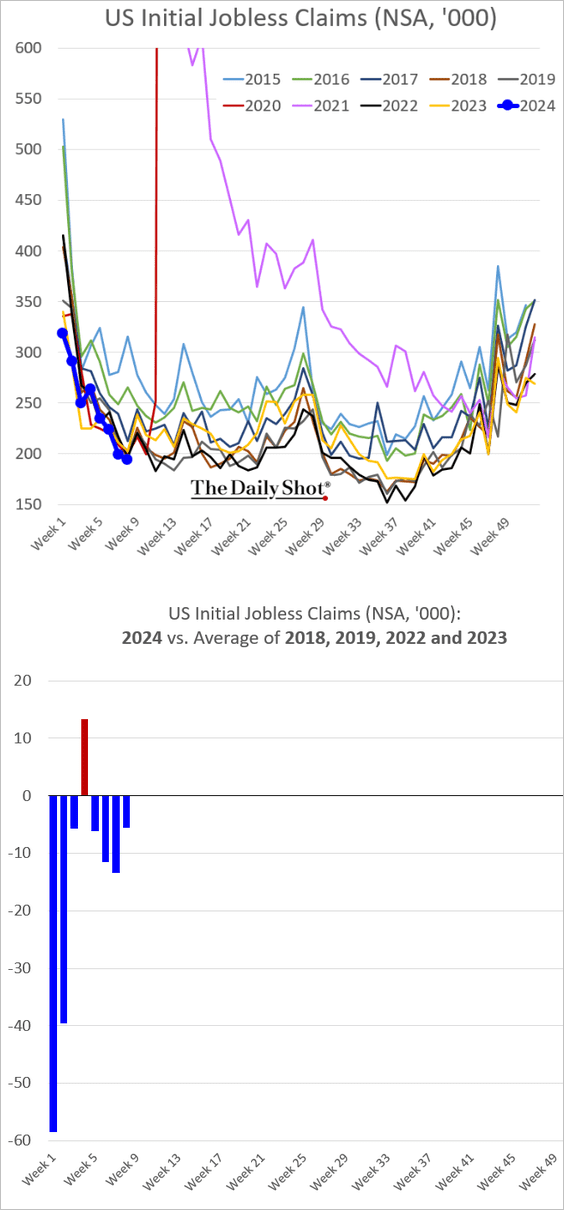
Continuing claims have been following the pre-COVID (2019/2020) trajectory.
• On a separate note, startups considerably slowed hiring while more employees departed (either by choice or layoff) over the past year.
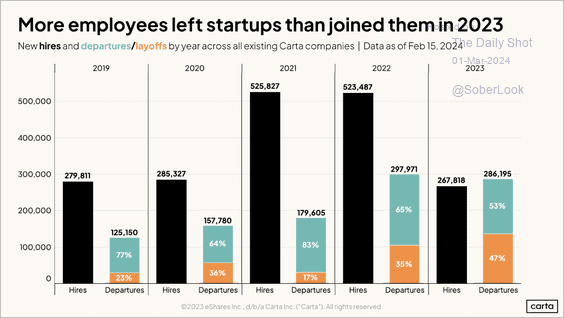 Source: Carta
——————–
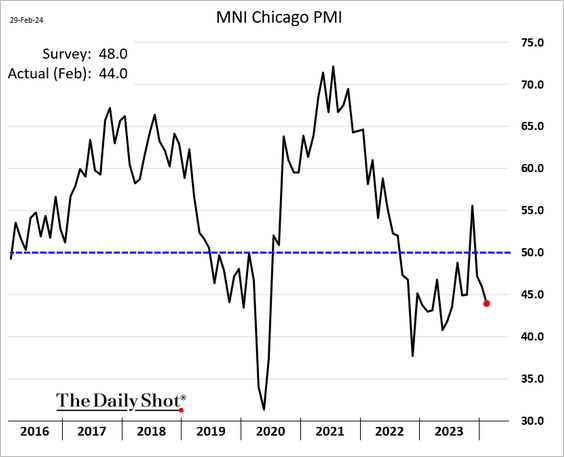
4. The Chicago PMI dipped further into contraction territory. Note that this regional business activity indicator is sensitive to Boeing’s orders.
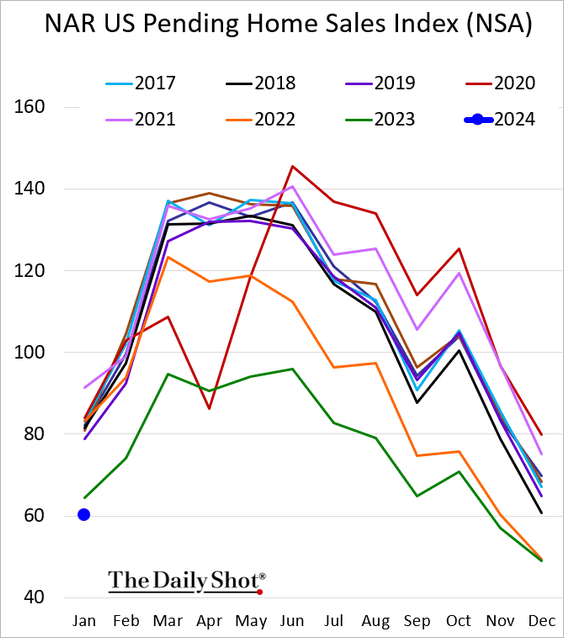
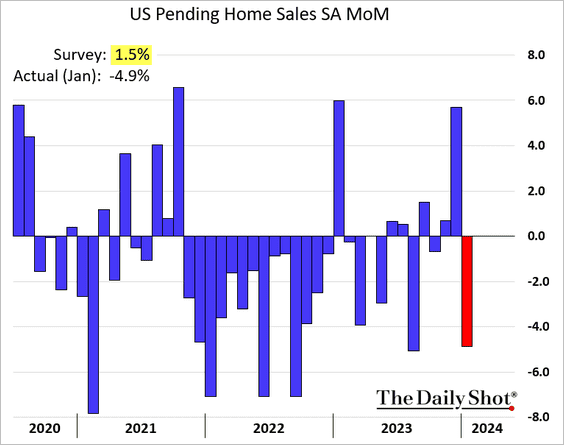
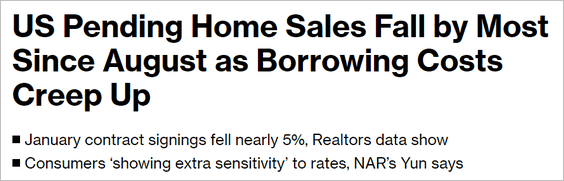
5. Next, we have some updates on the housing market.
• Pending home sales were at multi-year lows in January.
– For context, here’s the seasonally adjusted data (detailing monthly changes), though one should approach seasonal adjustments in the housing market with caution.
 Source: @economics Read full article
• The pipeline of uncompleted homes remains elevated.
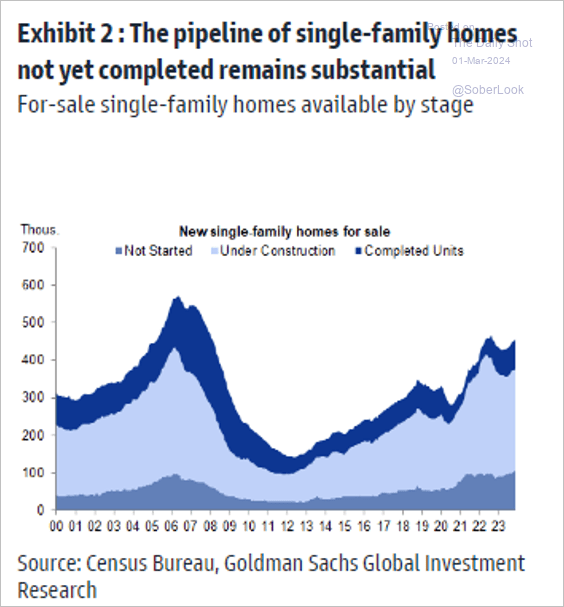 Source: Goldman Sachs; @MikeZaccardi
Back to Index
Canada
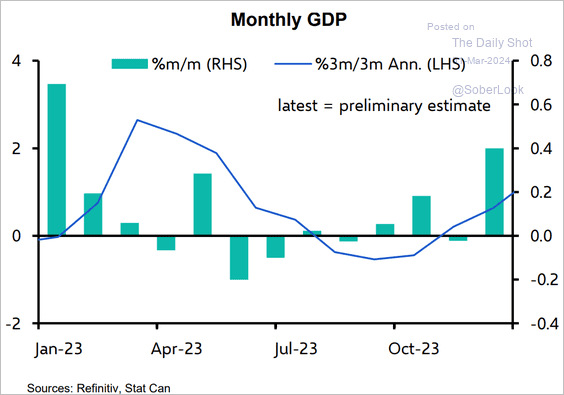
1. The monthly GDP index was flat in December, …
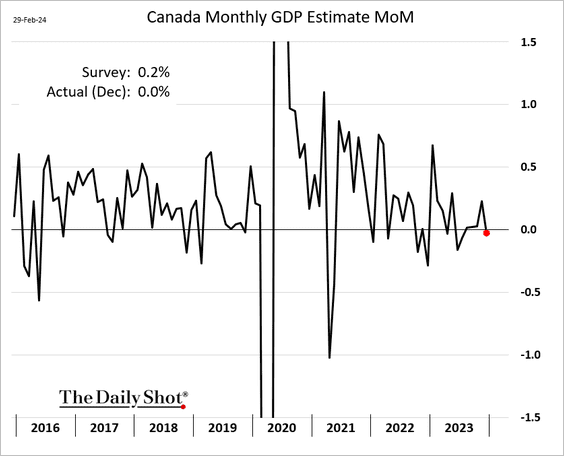
… but estimates point to a rebound in January.
 Source: Capital Economics
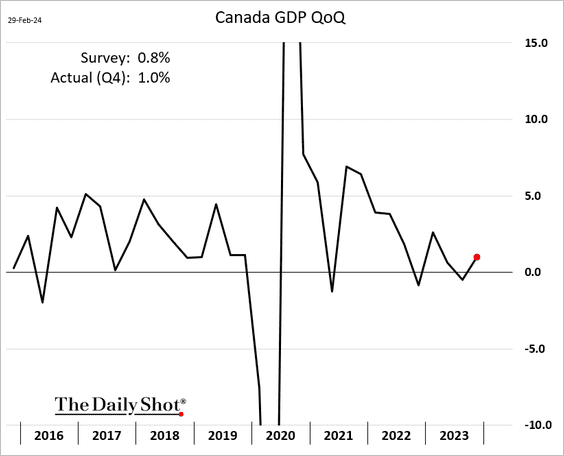
• The Q4 GDP growth was above estimates.
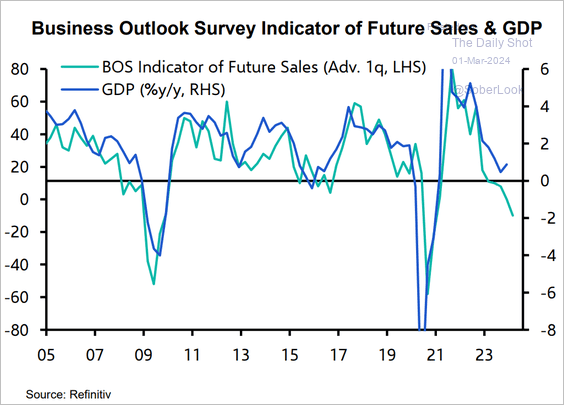
• Canada’s GDP has defied the pessimistic business outlook.
 Source: Capital Economics
——————–
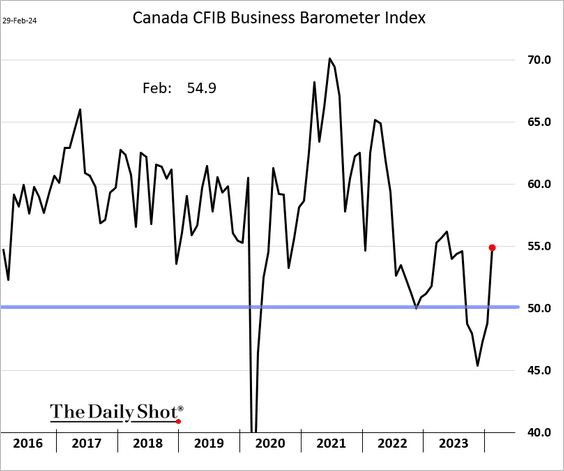
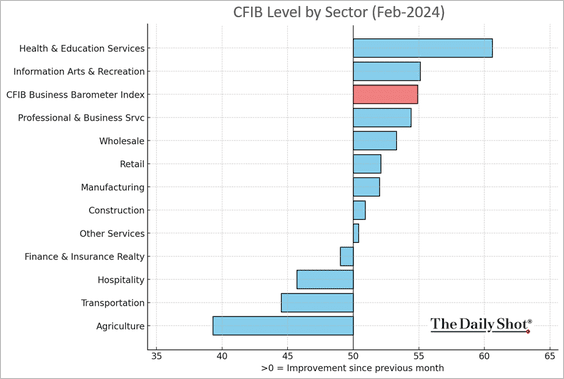
2. The CFIB small/medium-size business indicator rebounded sharply in February.
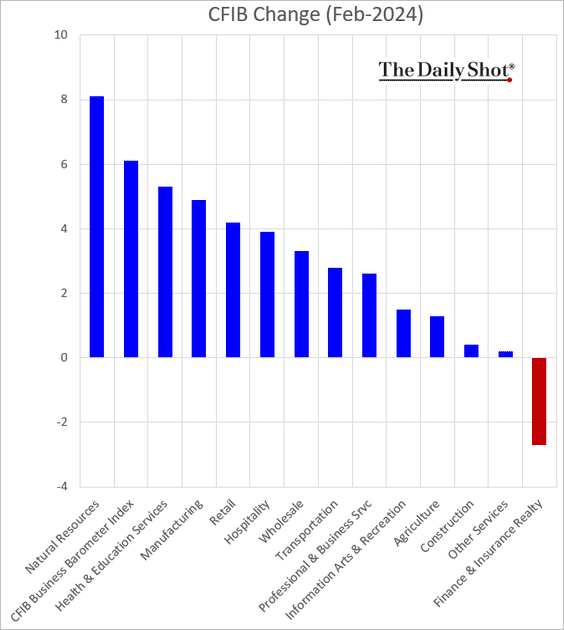
• Here is a look at the CFIB index by sector.
And these are the changes from January.
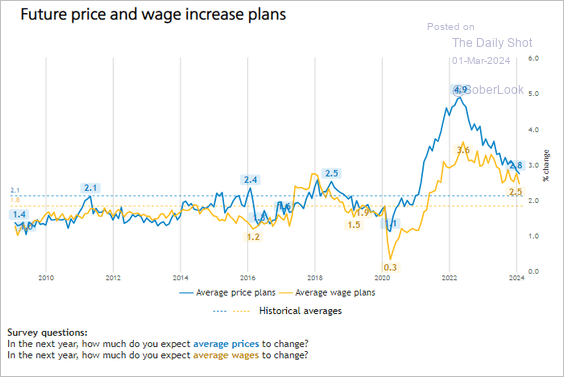
• Fewer businesses plan to raise prices and wages.
 Source: CFIB
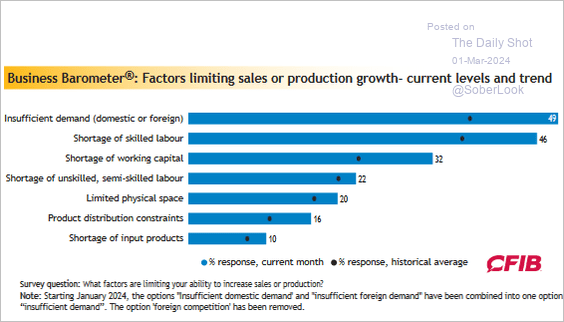
• Businesses are still struggling with soft demand.
 Source: CFIB
——————–
3. The surge in foreign student population has been remarkable, …
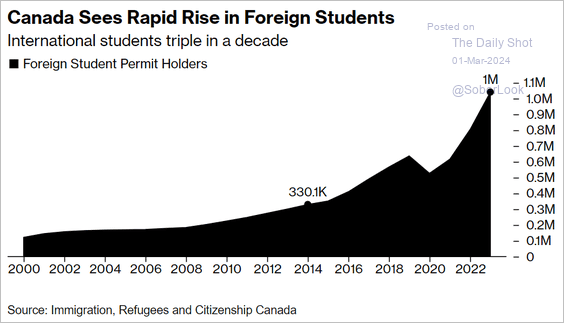 Source: @business Read full article
… pushing up rents.
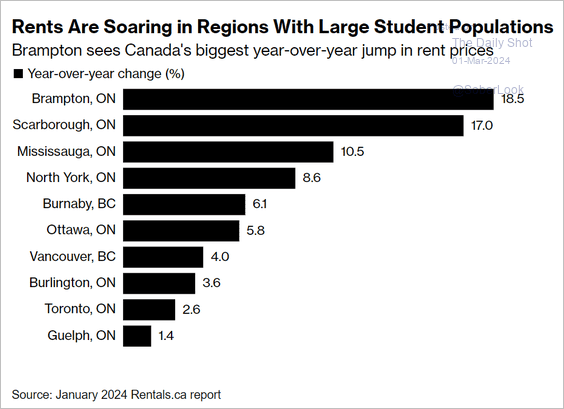 Source: @business Read full article
But Canada’s population growth is expected to slow.
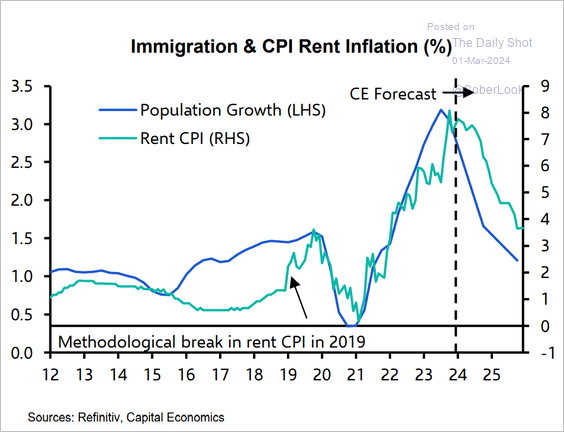 Source: Capital Economics
Back to Index
The United Kingdom
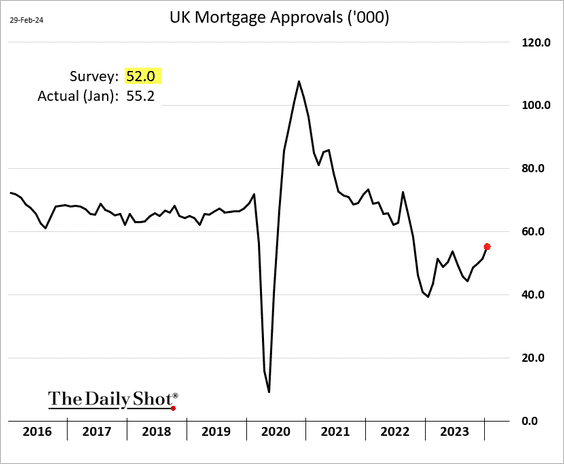
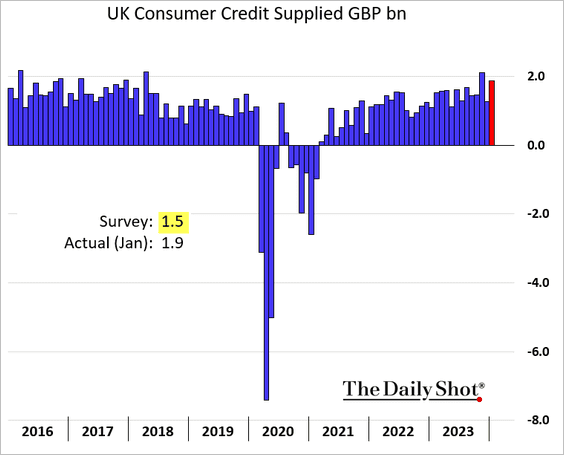
1. Household credit showed improvement in January, exceeding forecasts.
– Mortgage approvals:
– Consumer credit:
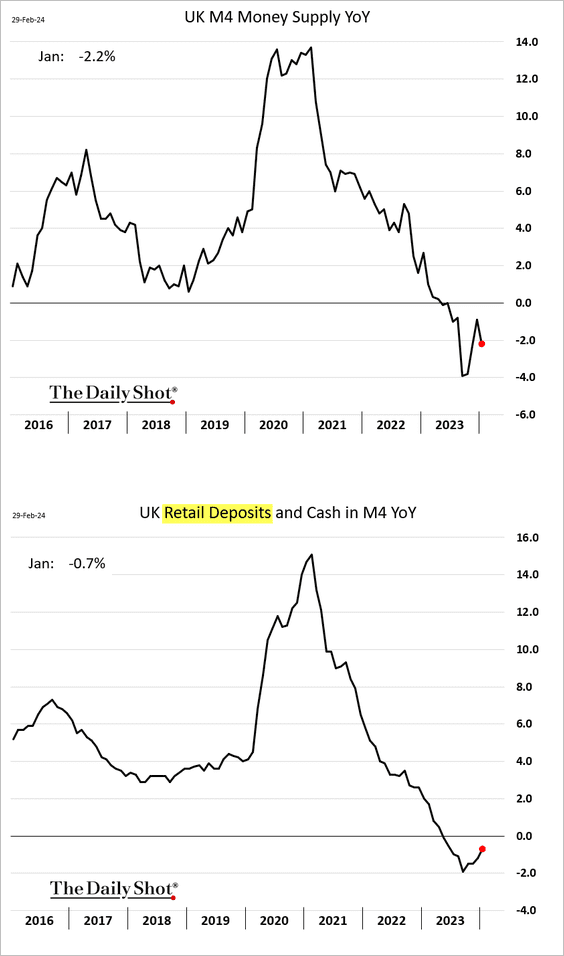
• While the broad money supply contraction accelerated in January, retail deposits appear to be stabilizing.
——————–
2. Is the housing market rebound stalling?
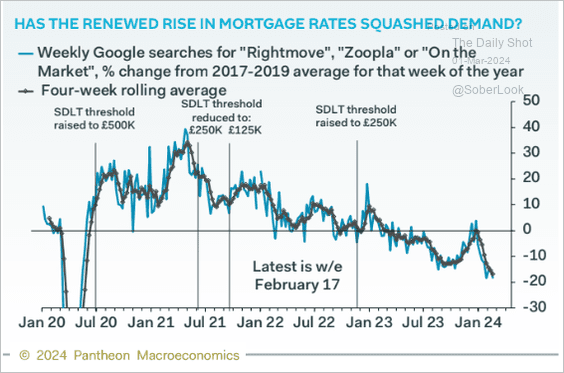 Source: Pantheon Macroeconomics
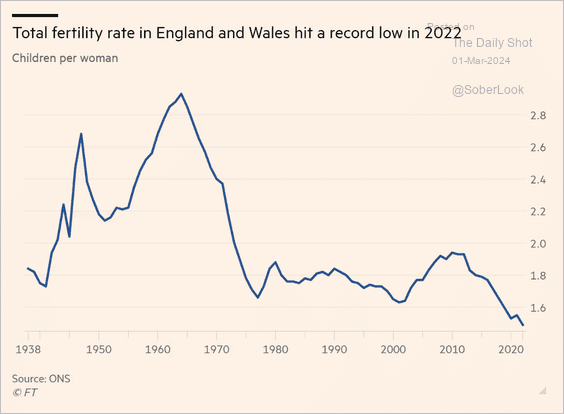
3. This chart shows the fertility rate in England and Wales.
 Source: @financialtimes Read full article
Back to Index
The Eurozone
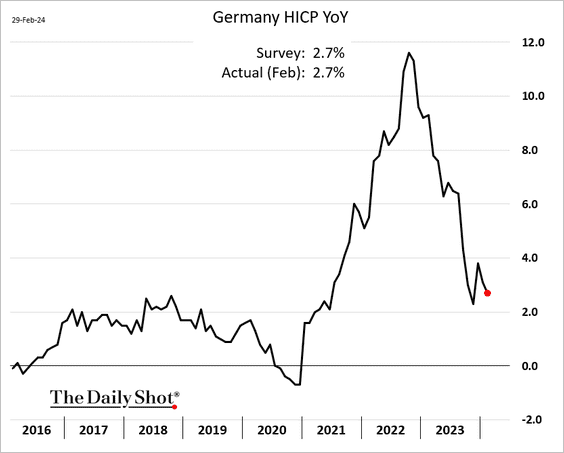
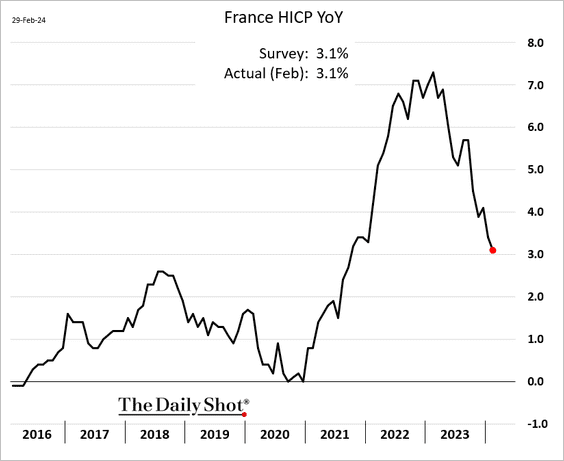
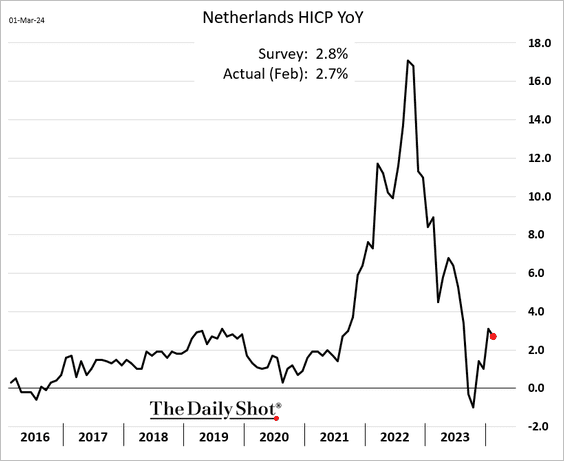
1. Inflation continued to trend lower in February.
• Germany:
• France:
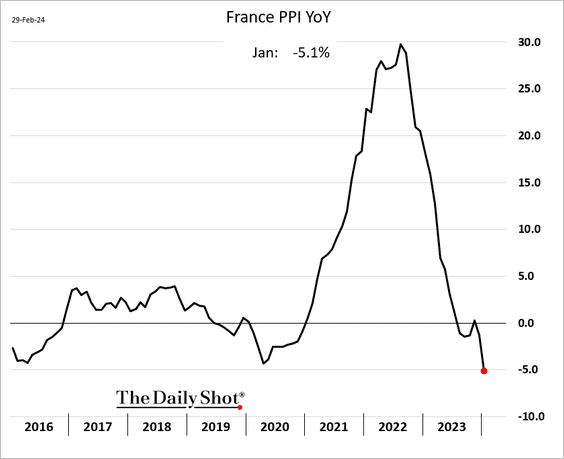
By the way, here is the French PPI.
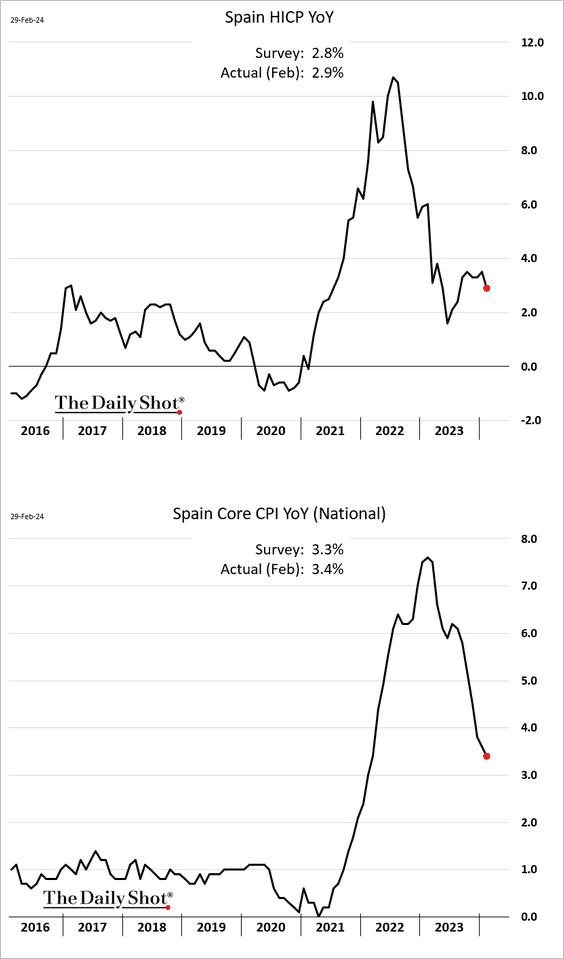
• Spain (slightly above forecasts):
• The Netherlands:
——————–
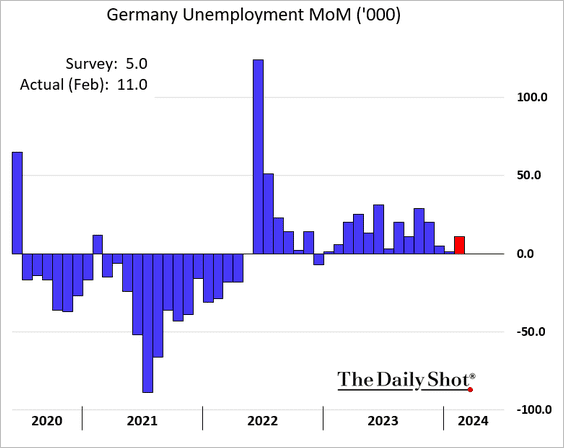
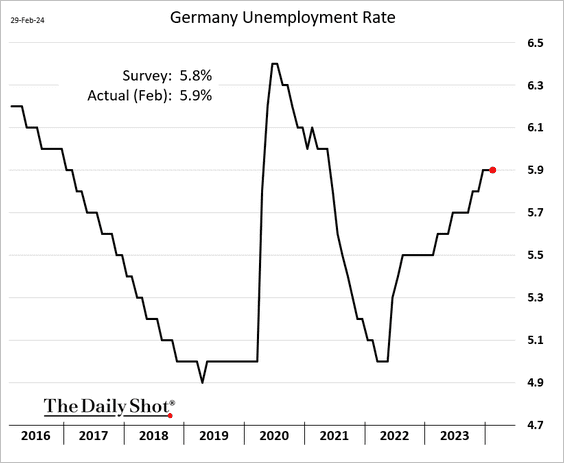
2. Germany’s unemployment increased more than expected in February.
The unemployment rate held steady.
——————–
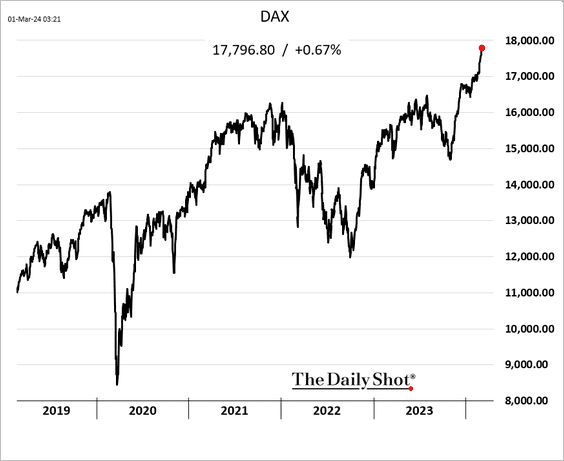
3. German stocks continue to surge.
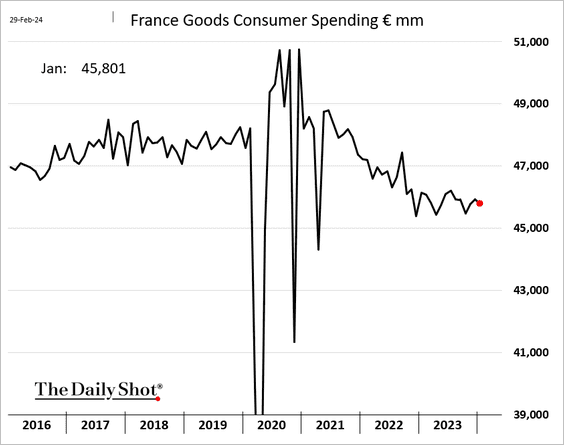
4. French consumer spending on goods edged lower in January.
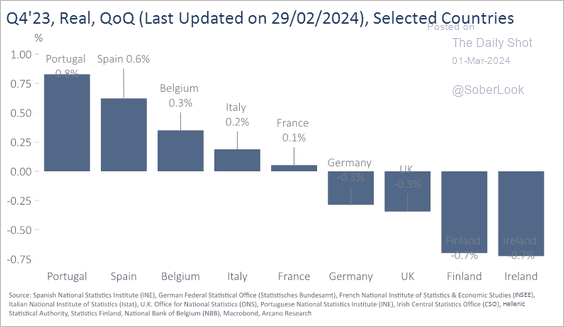
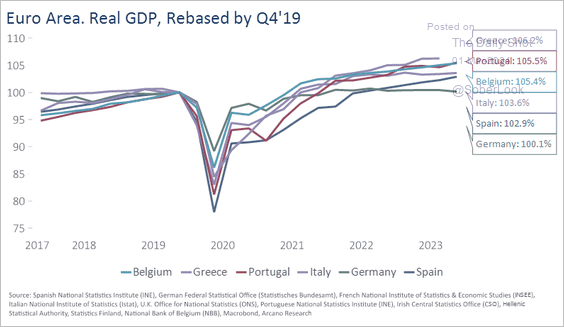
5. The next two charts show the GDP trends in the Eurozone (with the UK included for comparison).
 Source: Arcano Economics
 Source: Arcano Economics
——————–
6. Investment spending in the euro area could see a turnaround.
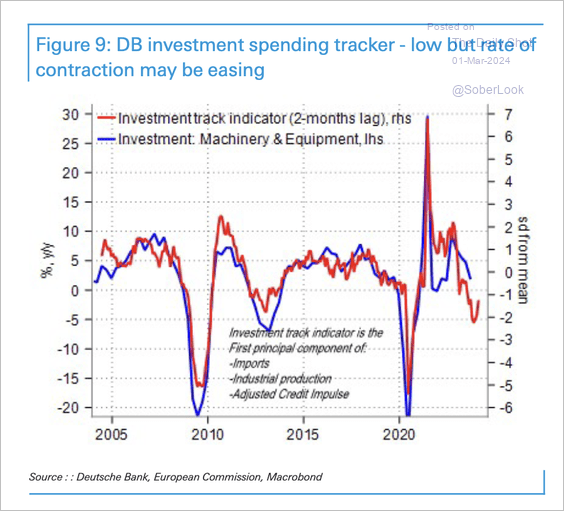 Source: Deutsche Bank Research
Back to Index
Europe
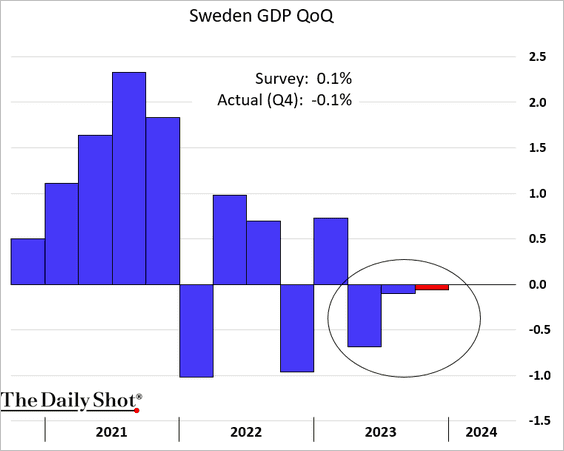
1. Sweden’s GDP unexpectedly declined last quarter.
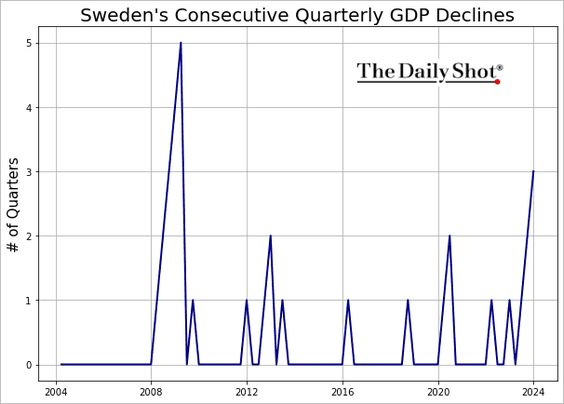
It’s been a while since Sweden saw three consecutive quarters of GDP contraction.
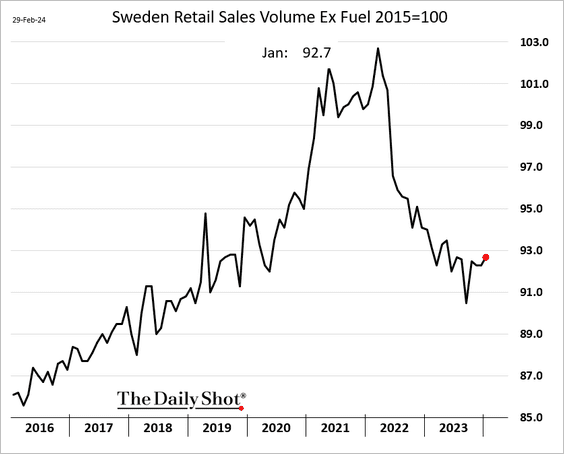
• Retail sales are starting to rebound.
——————–
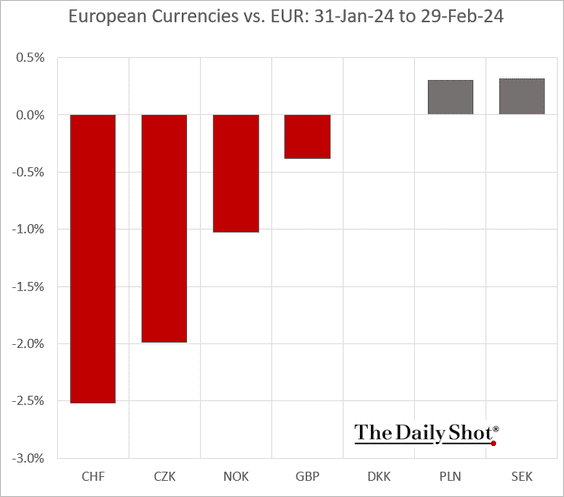
2. The Swiss franc underperformed in February.
Back to Index
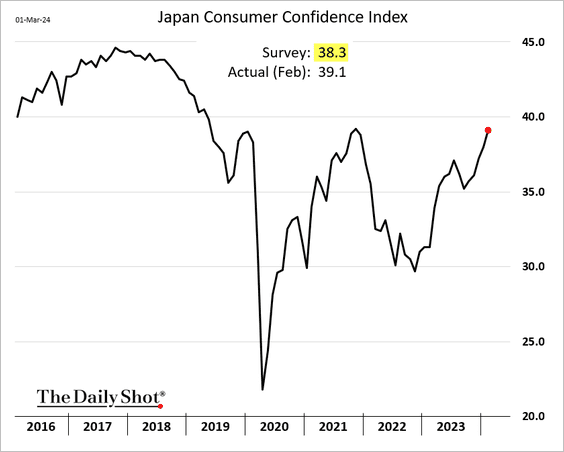
Japan
1. Consumer confidence is surging.
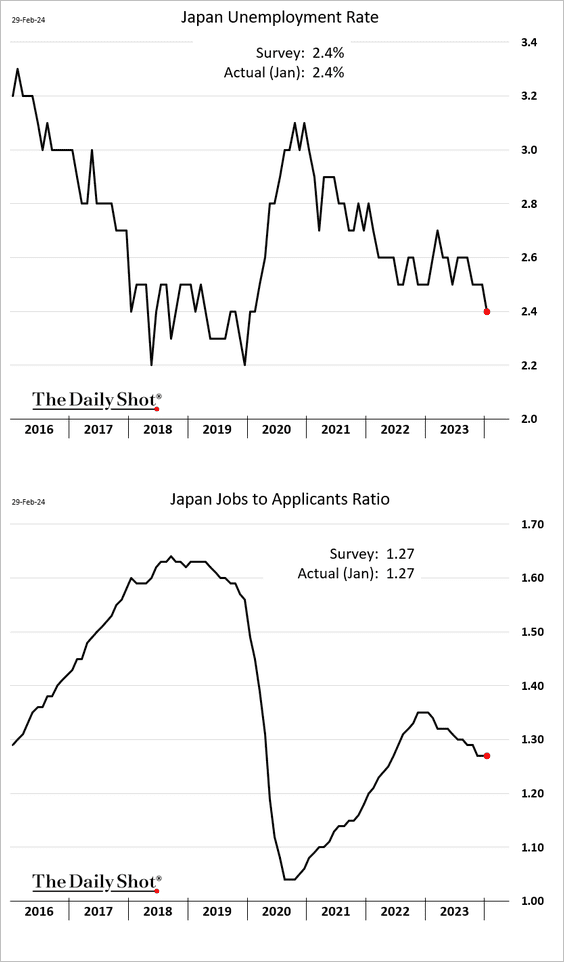
2. The unemployment rate declined in January.
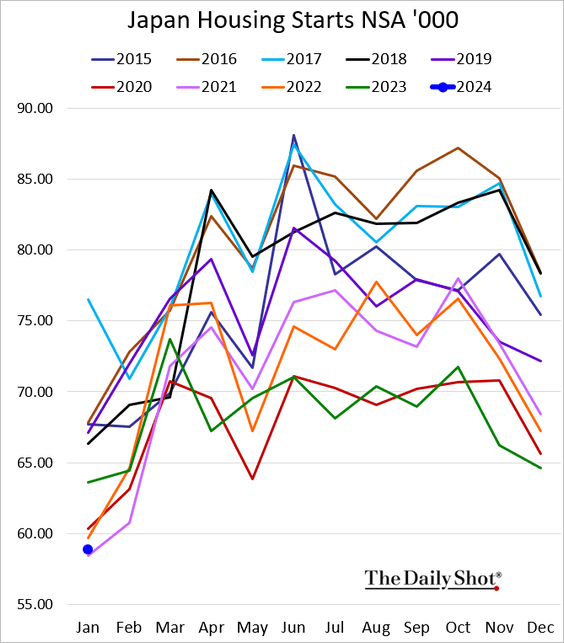
3. Housing starts remain depressed.
Back to Index
Asia-Pacific
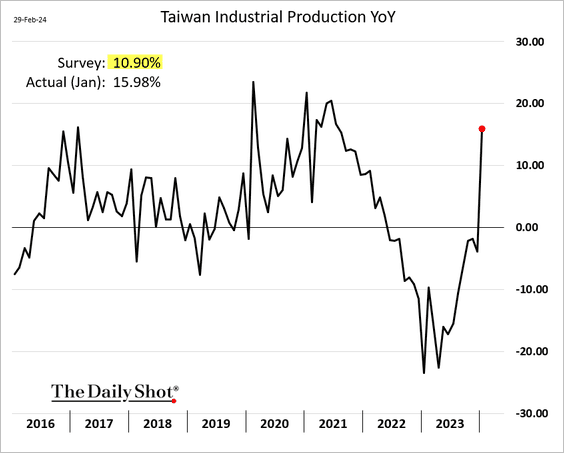
1. Let’s begin with Taiwan.
• Industrial production is rebounding.
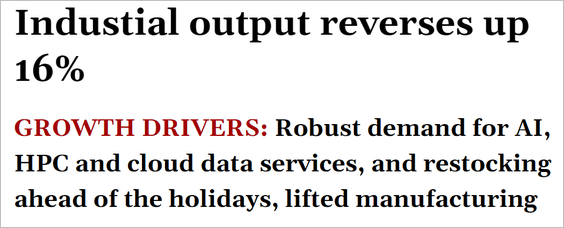 Source: The Taipei Times. Read full article
• The manufacturing PMI still shows a slight contraction.
 Source: S&P Global PMI
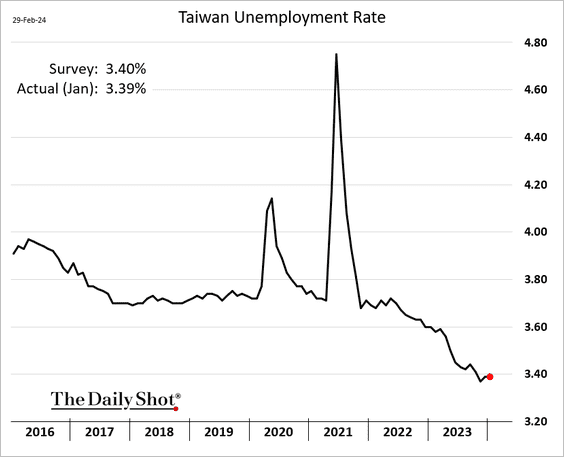
• The unemployment rate is very low.
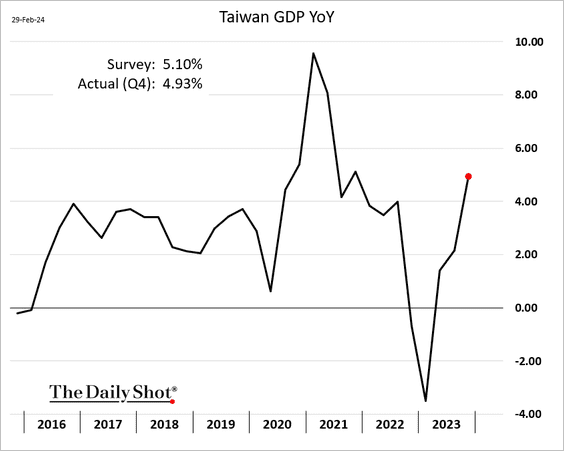
• The GDP growth was a touch softer than expected in Q4.
——————–
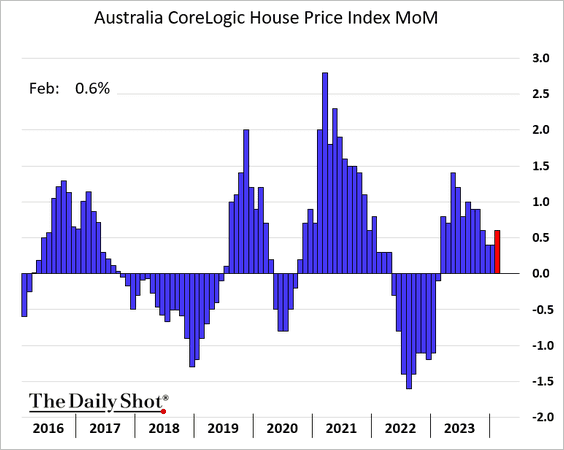
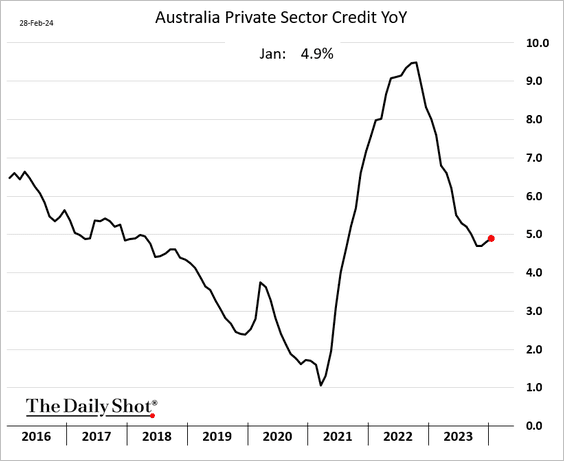
2. Australia’s home price appreciation accelerated in February.
• Prive-sector credit growth has bottomed.
Back to Index
China
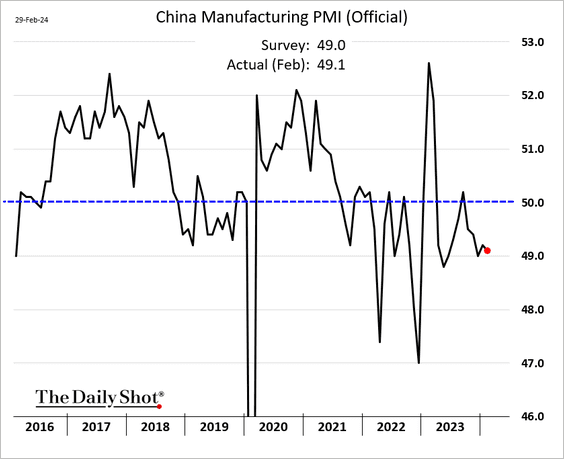
1. The official PMI report showed persistent contraction in China’s manufacturing sector.
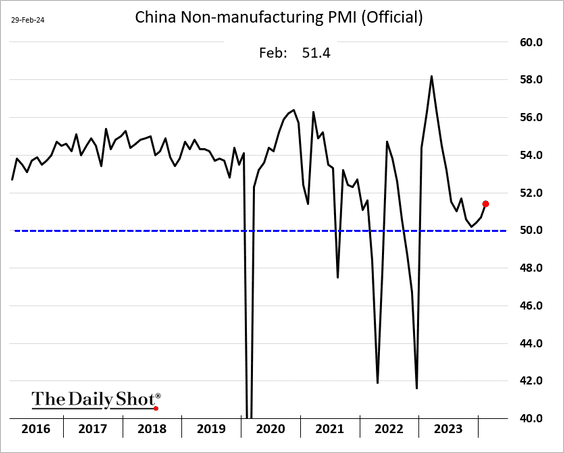
The non-manufacturing index remains in growth territory.
——————–
2. China-focused funds are seeing some ouflows.
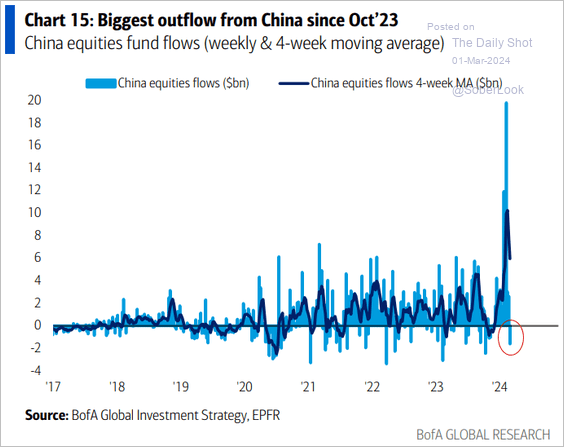 Source: BofA Global Research
3. Here is a look at China’s share of exports to EM economies.
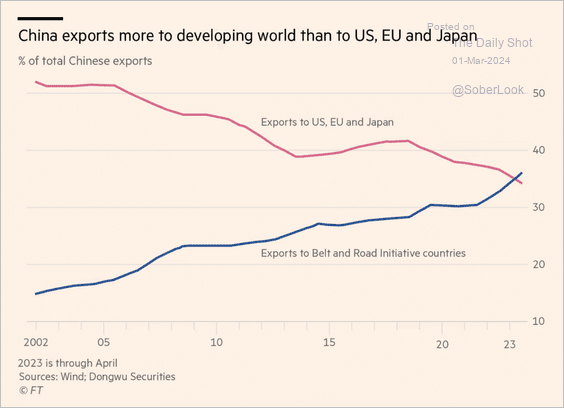 Source: @financialtimes Read full article
Back to Index
Emerging Markets
1. India’s Q4 GDP topped forecasts.
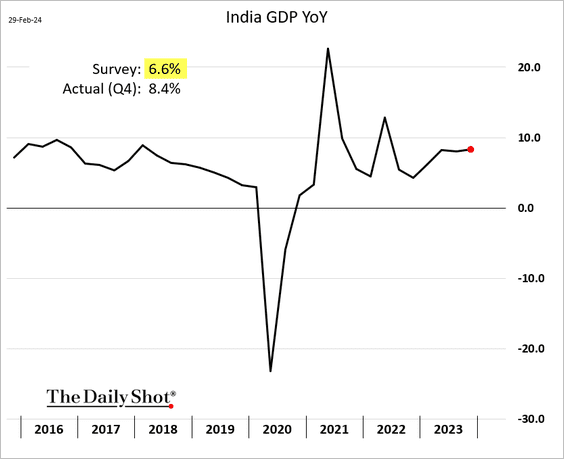
 Source: CNBC Read full article
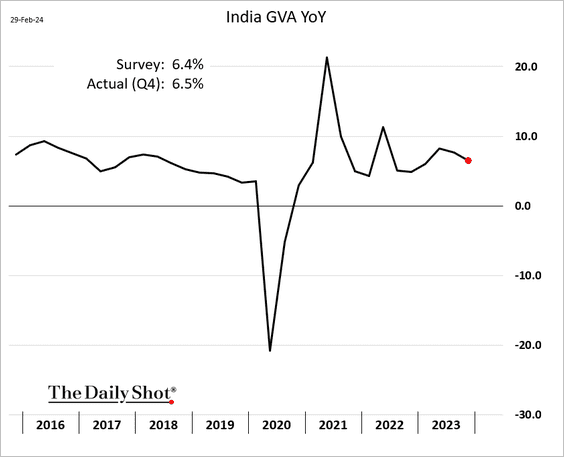
However, the GVA has been slowing.
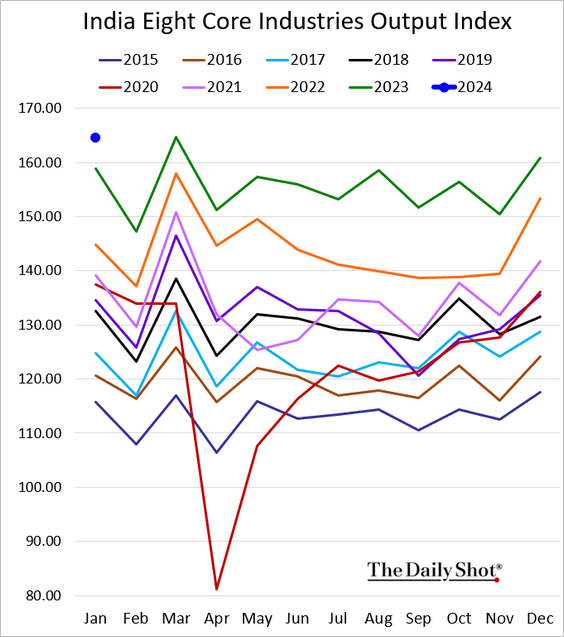
• Industrial output remains strong.
• The manufacturing PMI shows rapid growth.
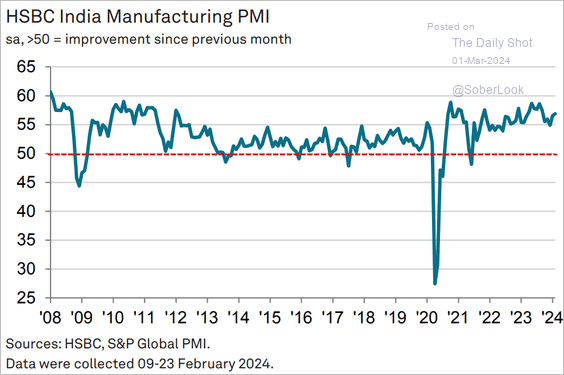 Source: S&P Global PMI
——————–
2. Next, let’s run through Asian PMI trends for February.
• ASEAN (slow growth):
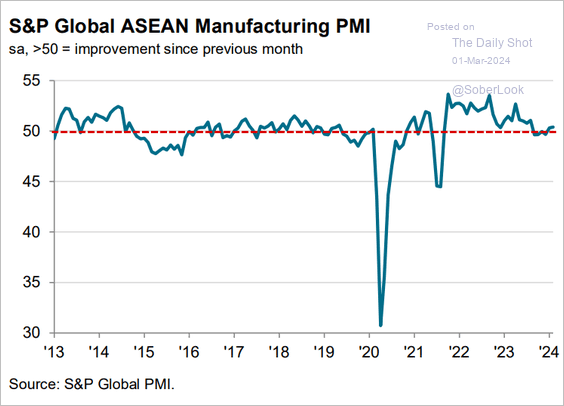 Source: S&P Global PMI
• Indonesia (strong):
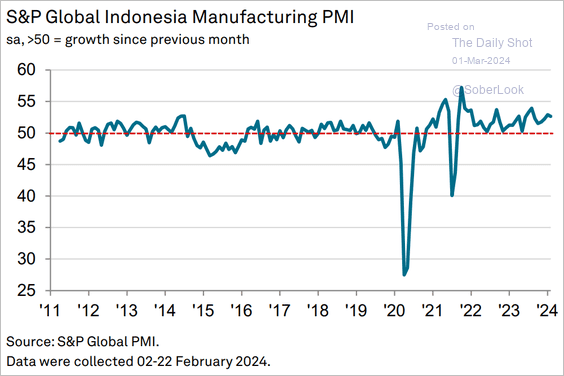 Source: S&P Global PMI
• Malaysia (stabilizing):
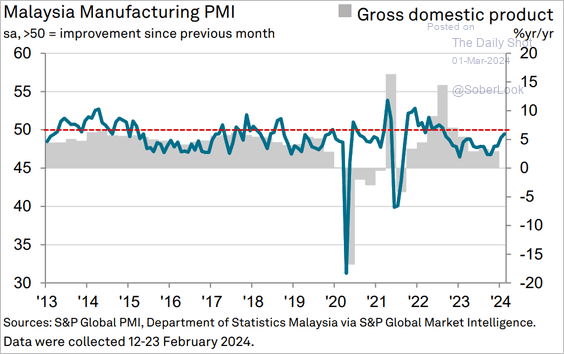 Source: S&P Global PMI
• The Philippines (slow growth):
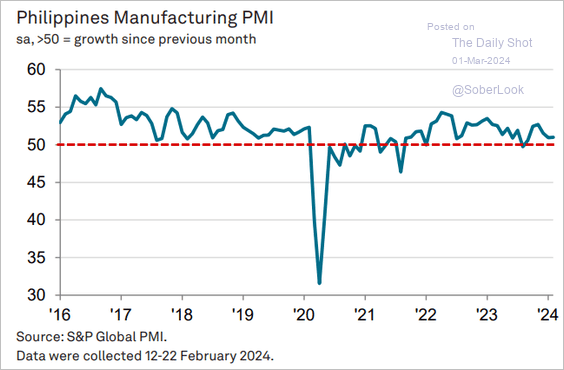 Source: S&P Global PMI
• Thailand (a disaster):
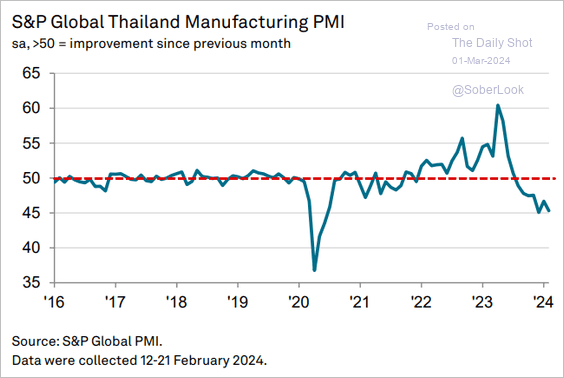 Source: S&P Global PMI
• Vietnam (very slow growth):
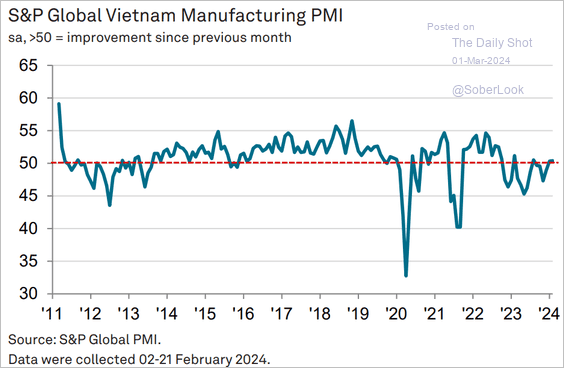 Source: S&P Global PMI
——————–
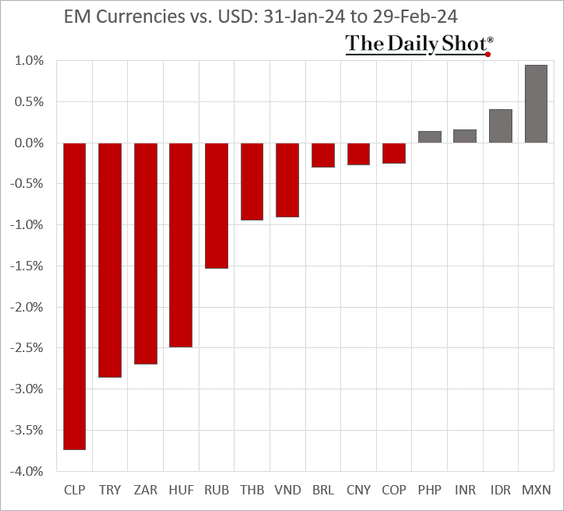
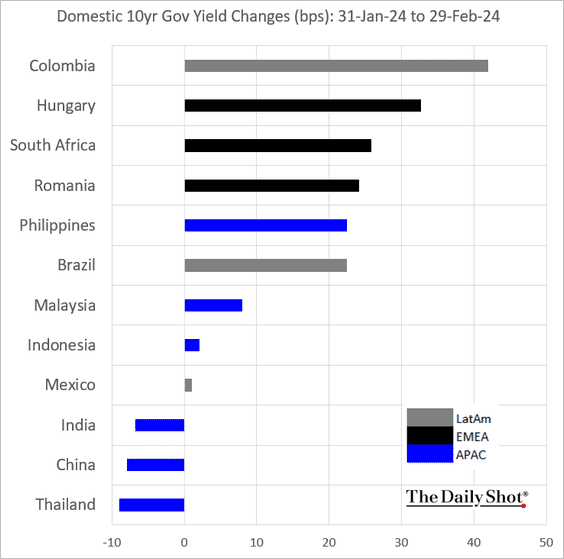
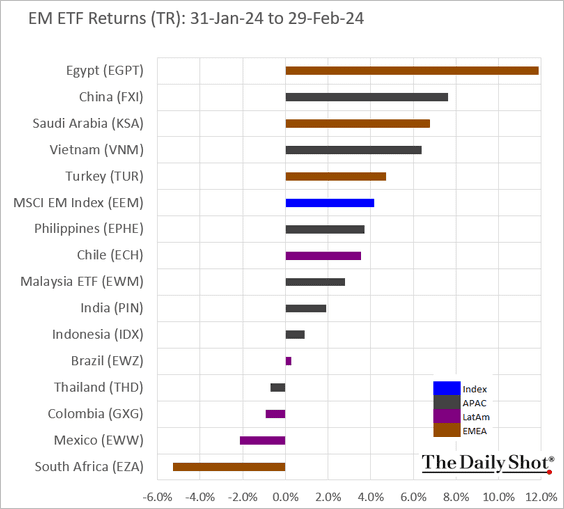
3. Next, let’s take a look at February’s performance data.
• Currencies:
• Bond yields:
• Equity ETFs:
Back to Index
Cryptocurrency
1. Crypto funds have been seeing record inflows.
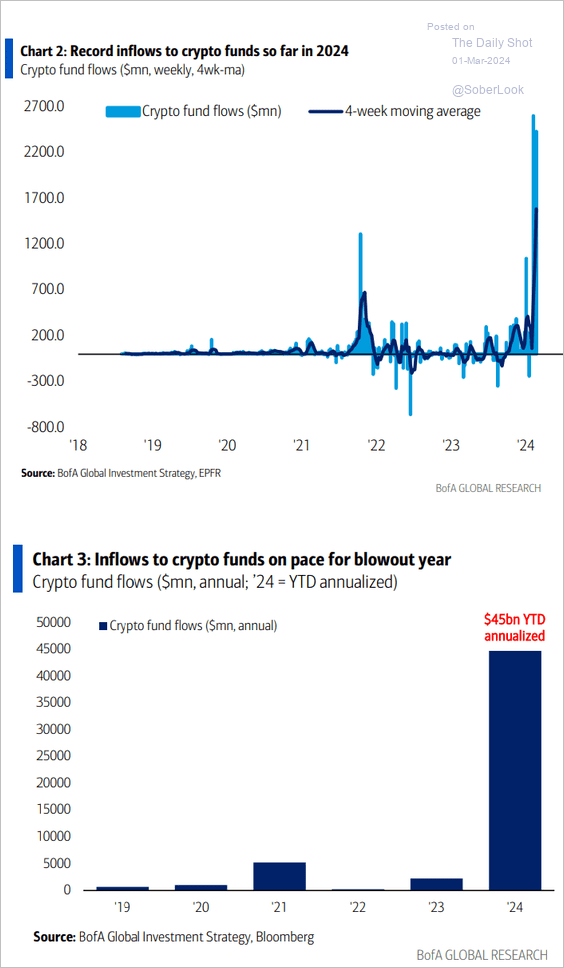 Source: BofA Global Research
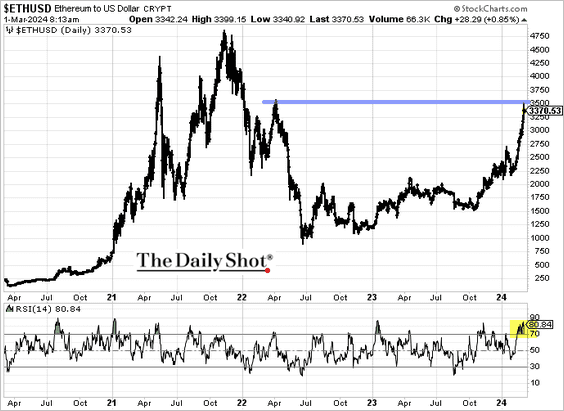
2. Ether hit resistance at $3,500.
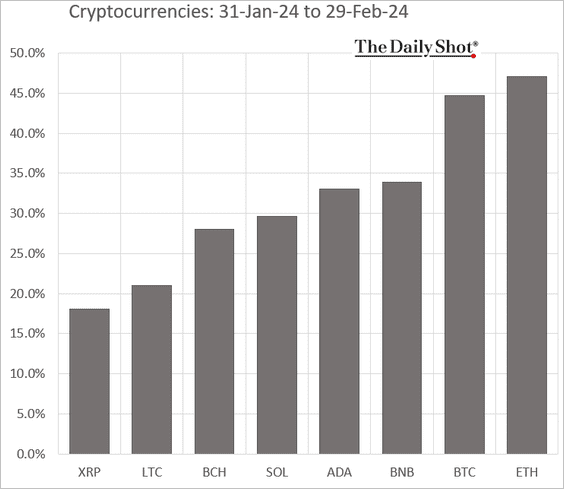
3. Here is the performance data for February.
Back to Index
Commodities
1. China holds a dominant share of the world mineral supply chain.
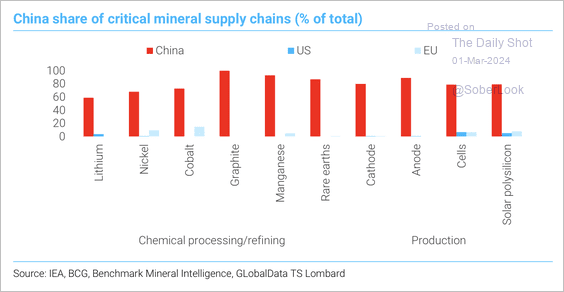 Source: TS Lombard
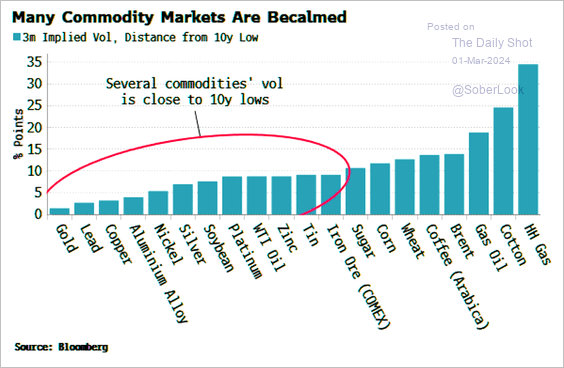
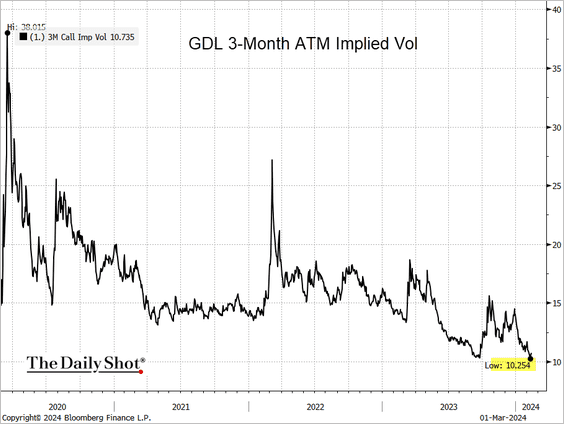
2. Metals implied volatility has been sinking (3 charts).
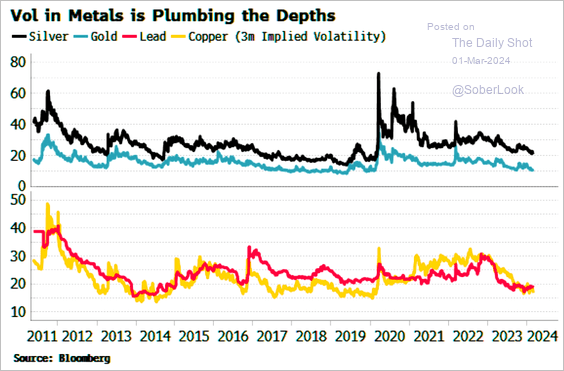 Source: Simon White, Bloomberg Markets Live Blog
 Source: Simon White, Bloomberg Markets Live Blog
 Source: @TheTerminal, Bloomberg Finance L.P.
——————–
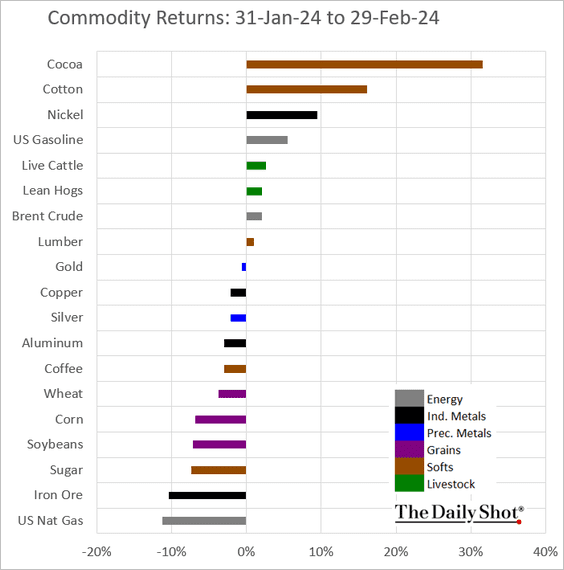
3. Here is the performance data for February.
Back to Index
Equities
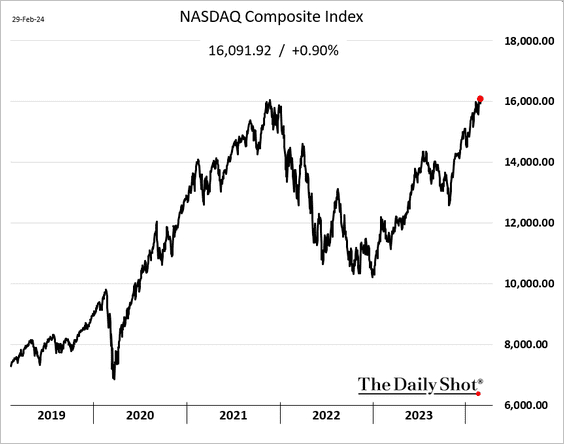
1. The Nasdaq Composite finally took out the 2021 peak.
2. February saw robust inflows.
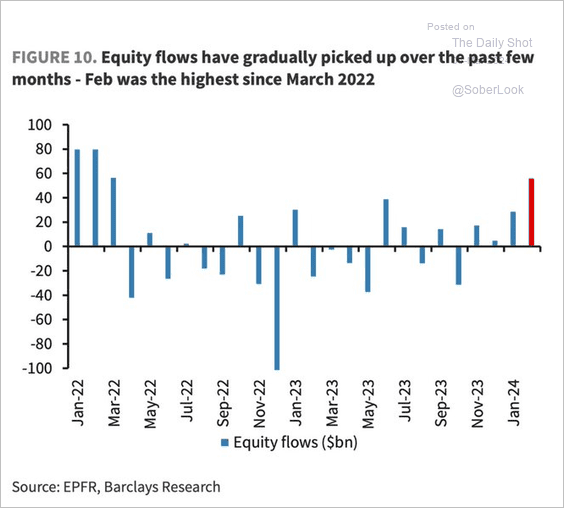 Source: Barclays Research
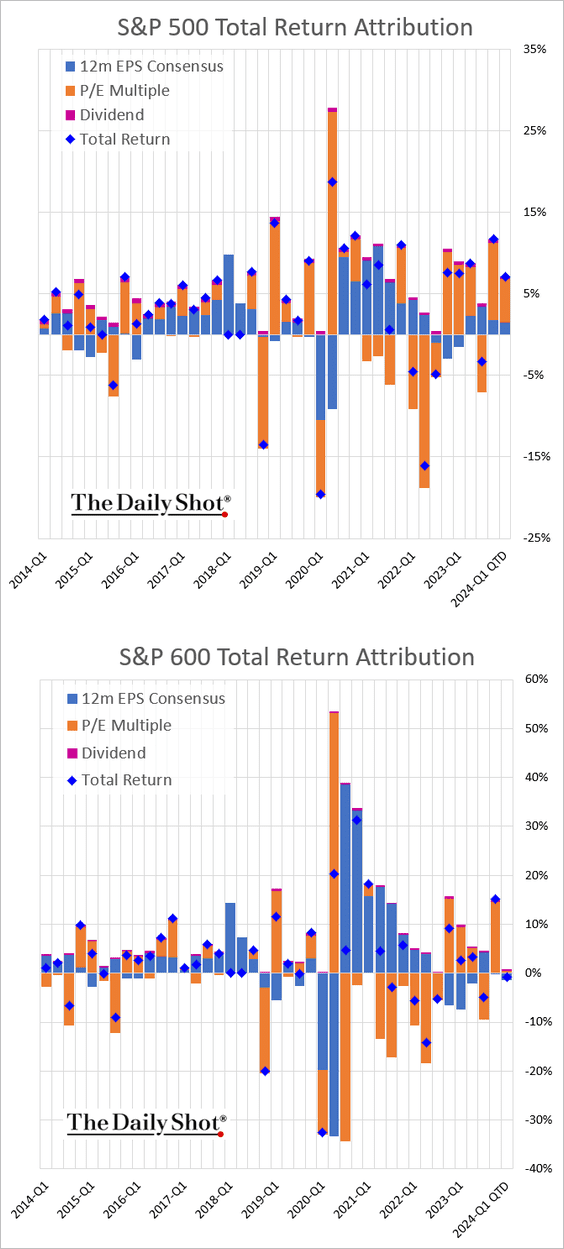
3. Next, we have the quarterly attribution data for the S&P 500 and the S&P 600.
3. Asset-heavy companies are trading at deep discounts to asset-light firms due to the high cost of capital.
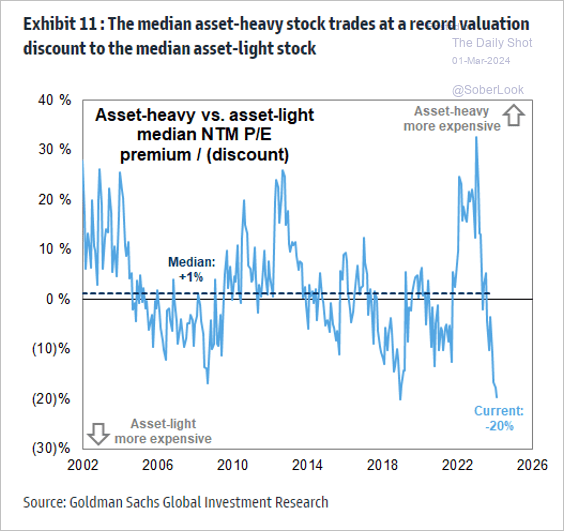 Source: Goldman Sachs; @MikeZaccardi
Below is the relative performance.
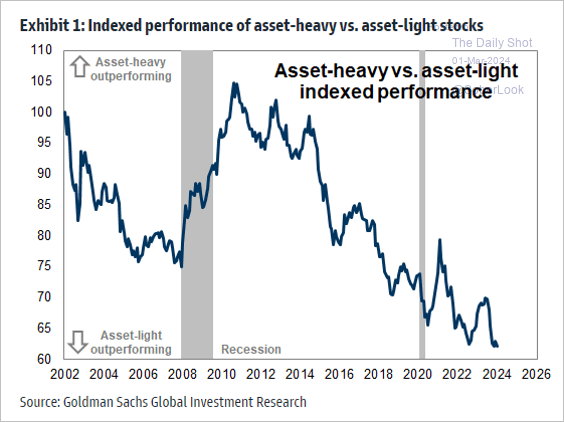 Source: Goldman Sachs; @MikeZaccardi
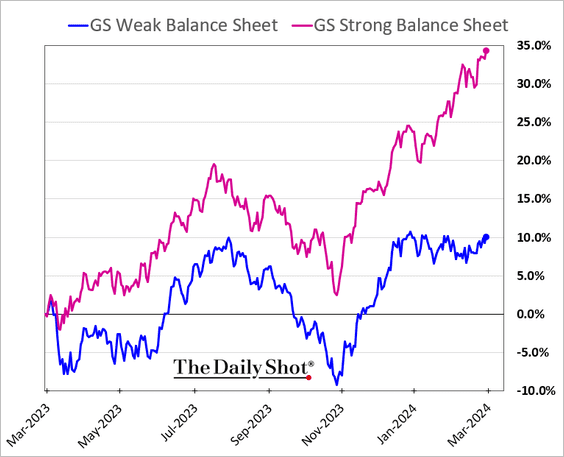
Related to the above, here is a look at the relative performance of companies with strong and weak balance sheets.
——————–
4. Large-cap growth shares have been outperforming small-cap growth.
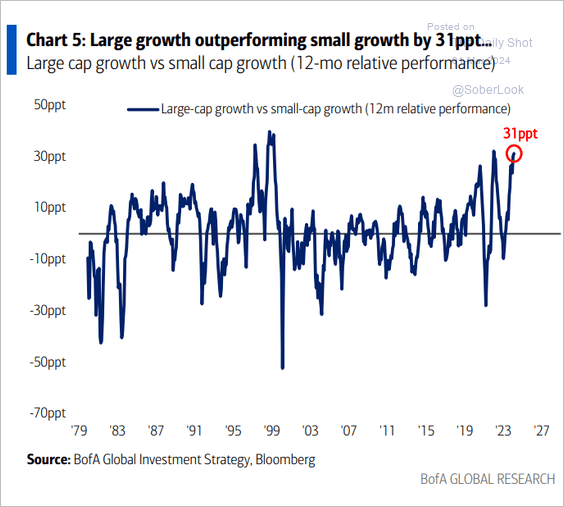 Source: BofA Global Research
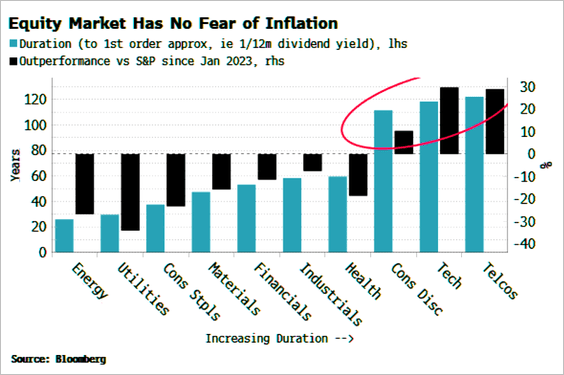
5. High-duration stocks have been outperforming despite inflation risks.
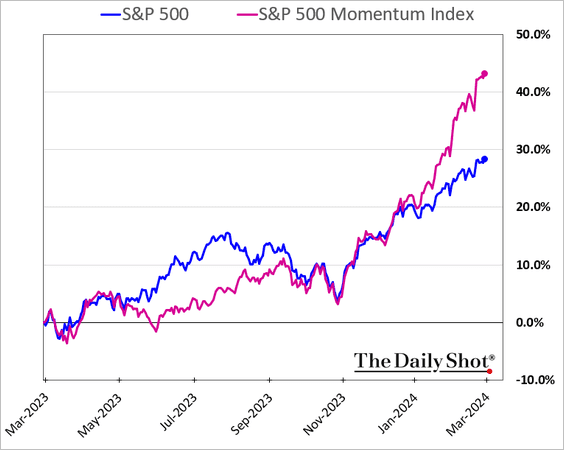
6. The momentum factor continues to outperform.
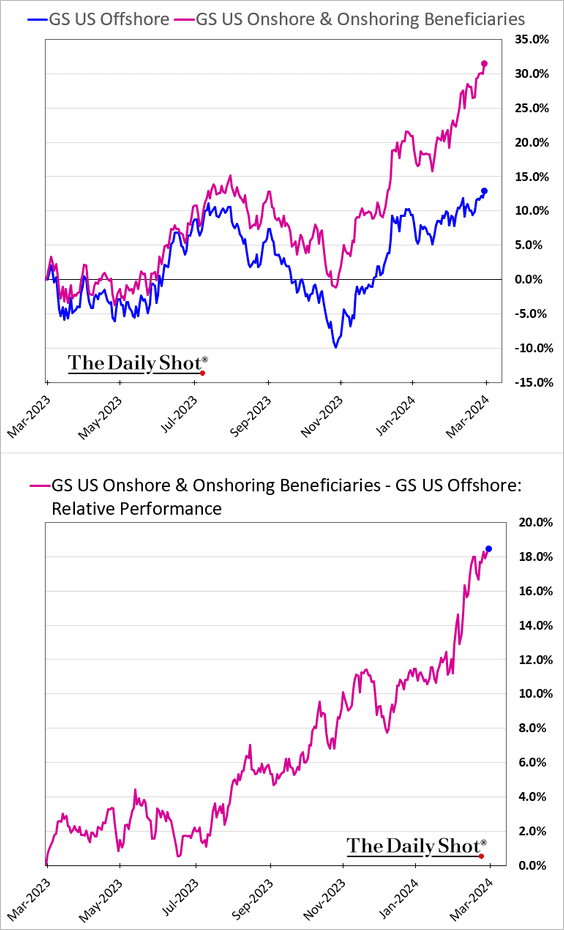
7. The market consistently favors companies that concentrate on onshoring or those that gain advantages from the process.
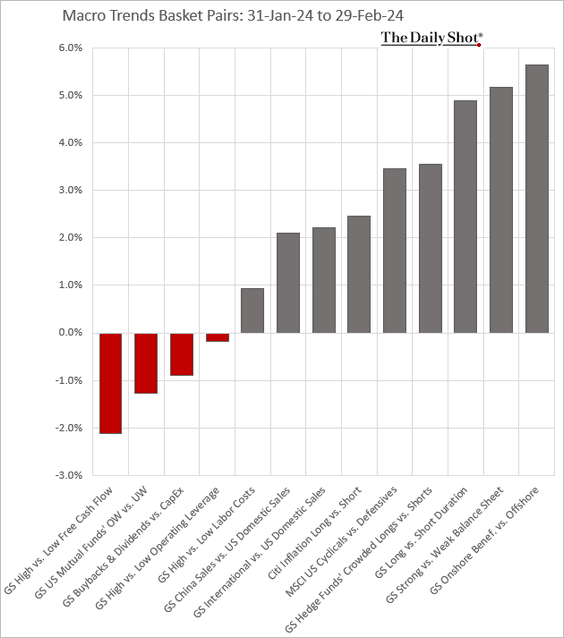
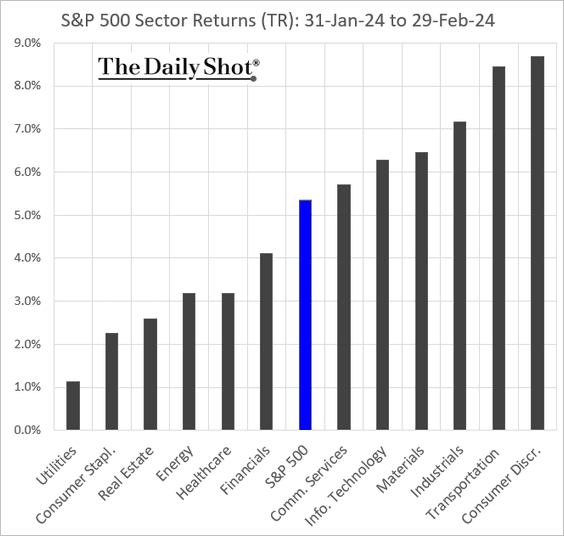
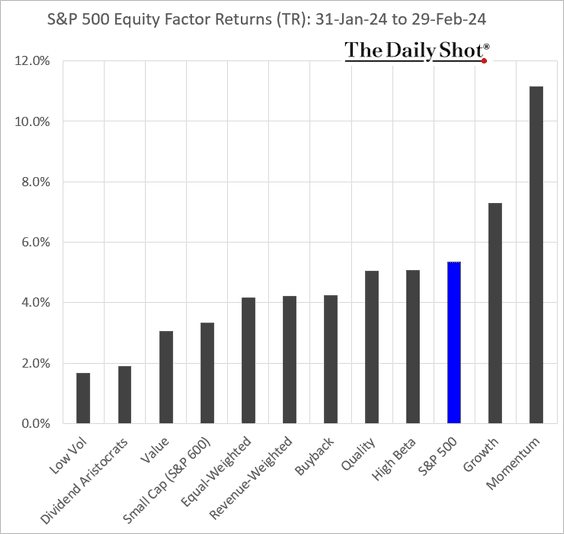
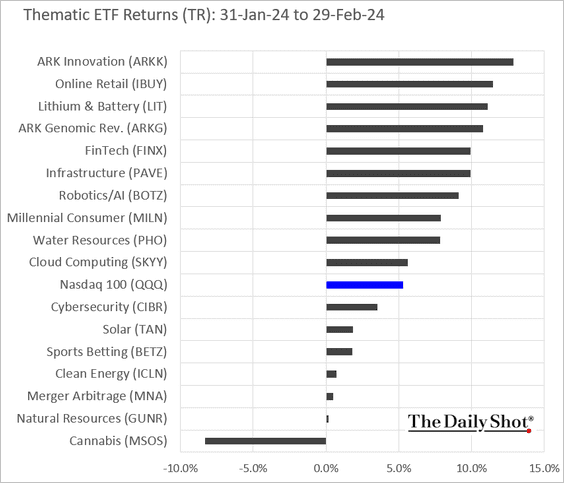
8. Finally, we have some performance data for February.
• Macro basket pairs’ relative performance (summarizing some of the charts above).
• Sectors:
• Equity factors:
• Thematic ETFs:
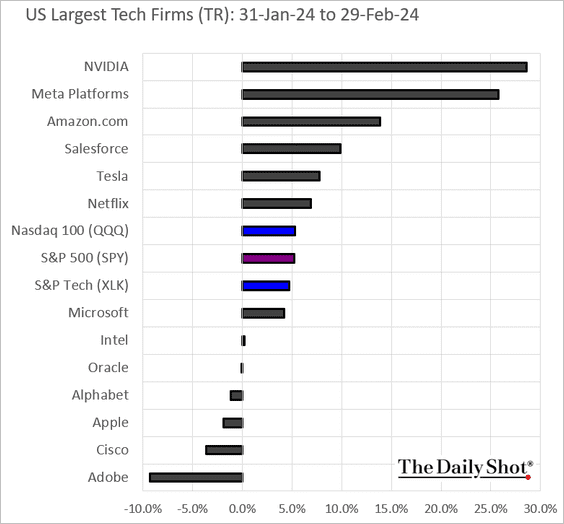
• Largest US tech firms:
Back to Index
Credit
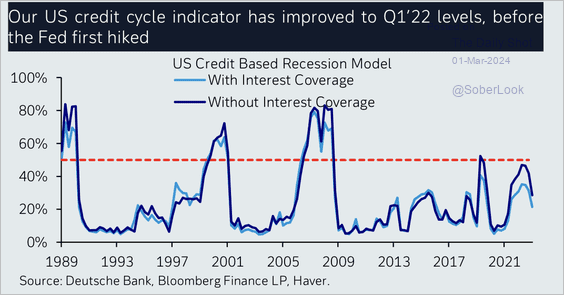
1. Deutsche Bank’s credit cycle indicator is improving.
 Source: Deutsche Bank Research
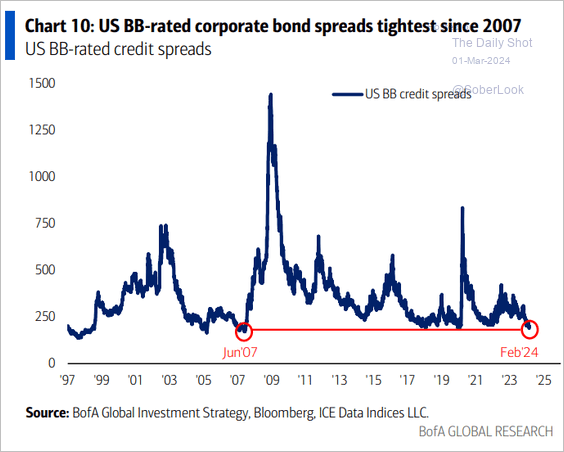
2. BB-rated bond spreads are extremely tight.
 Source: BofA Global Research
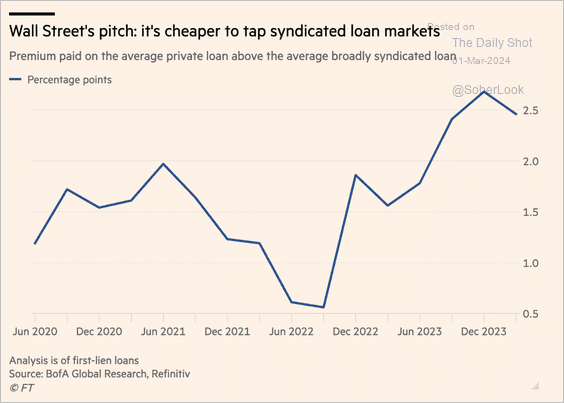
3. Private loans tend to pay much higher rates than syndicated loans.
 Source: @financialtimes Read full article
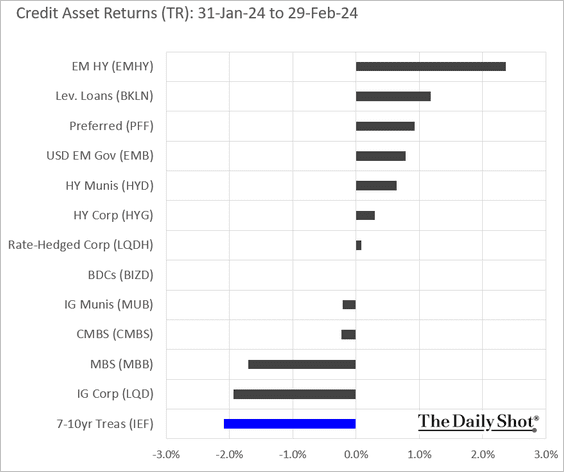
4. Here is a look at credit market performance in February.
Back to Index
Rates
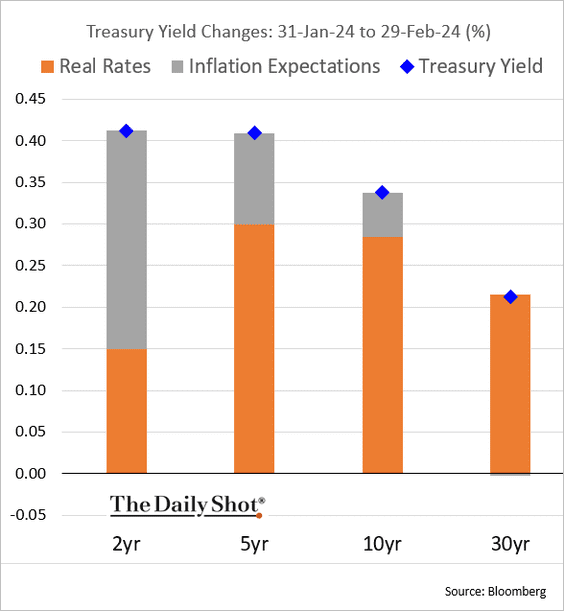
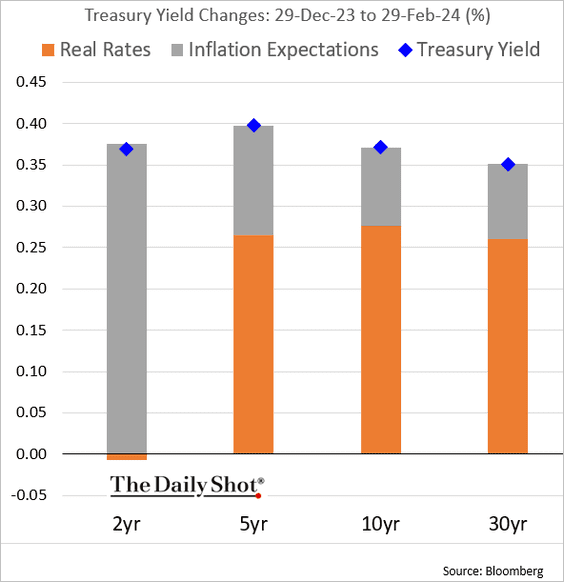
1. Below is the Treasury yield change attribution.
• February:
• Year-to-date:
——————–
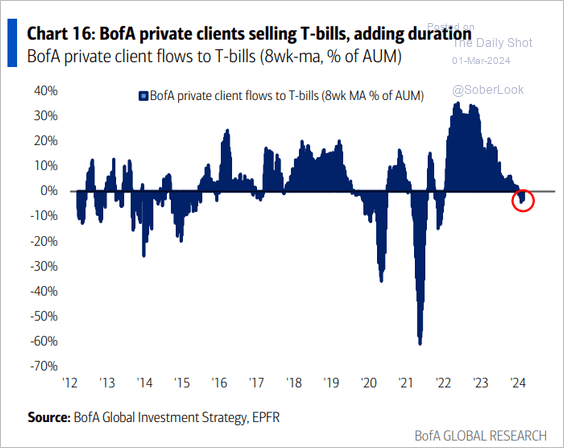
2. BofA’s clients are selling bills and adding duration.
 Source: BofA Global Research
3. JP Morgan’s clients are not increasing duration.
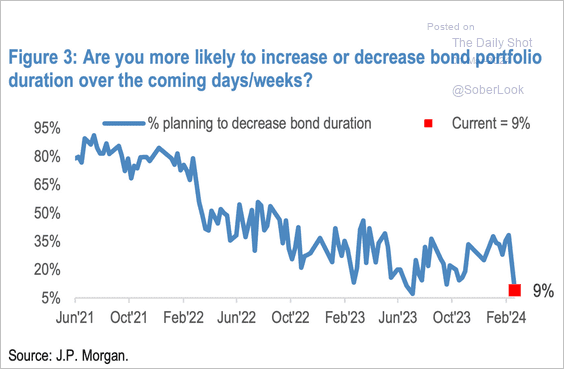 Source: JP Morgan Research; @dailychartbook
But very few of JP Morgan’s clients are short Treasuries.
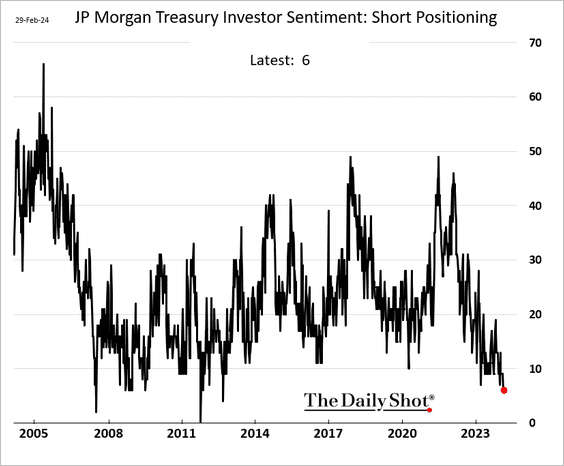 h/t Simon White, Bloomberg Markets Live Blog
Back to Index
Global Developments
1. Asian countries, particularly China, have captured a growing share of world merchandise export volume.
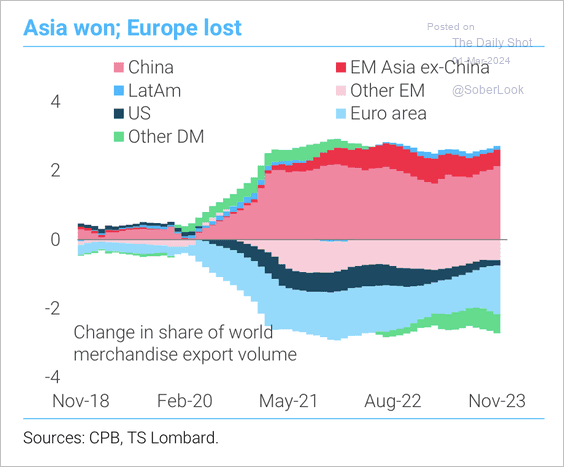 Source: TS Lombard
2. This chart shows real household disposable income trends in select economies.
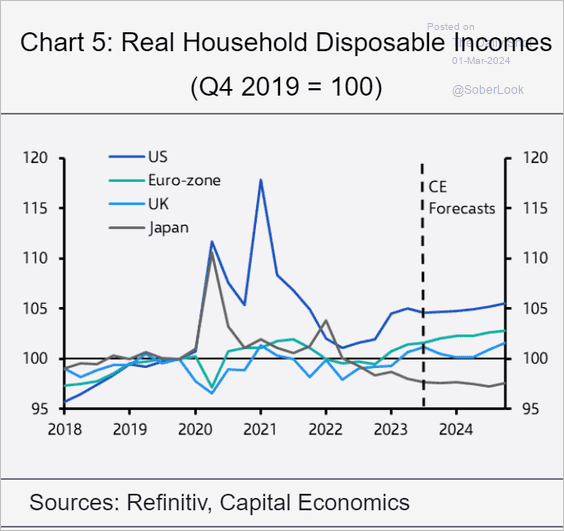 Source: Capital Economics
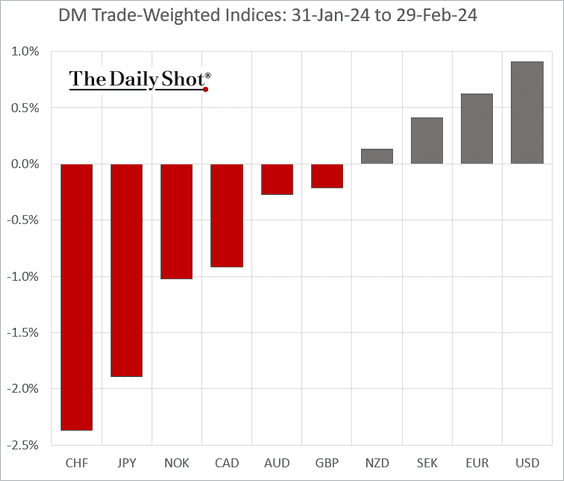
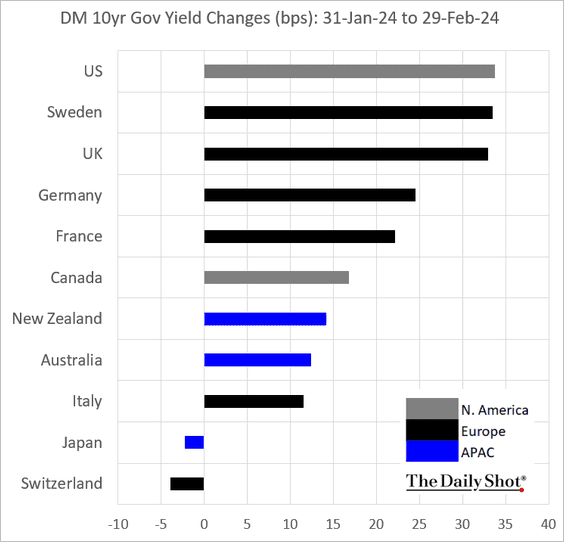
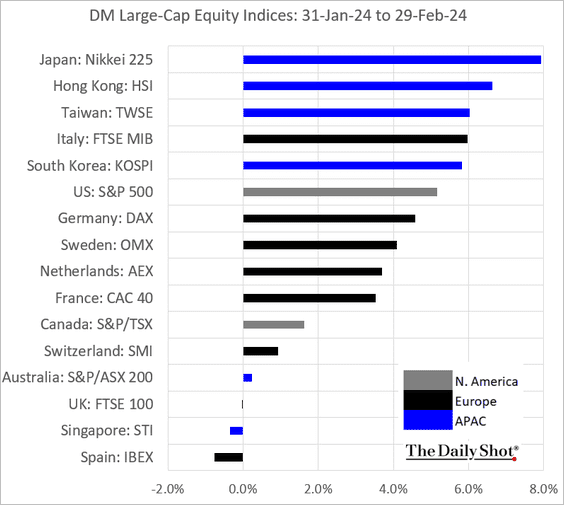
3. Next, we have the February performance data for advanced economies.
• Currencies:
• Bond yields:
• Equities:
Back to Index
Food for Thought
1. Defining a middle-class lifestyle:
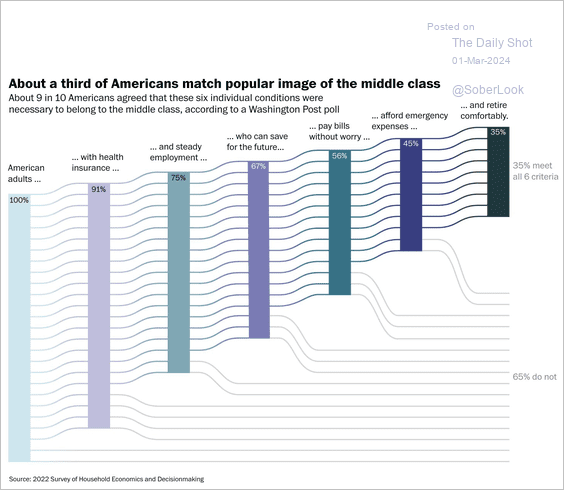 Source: The Washington Post Read full article
2. Combat tanks:
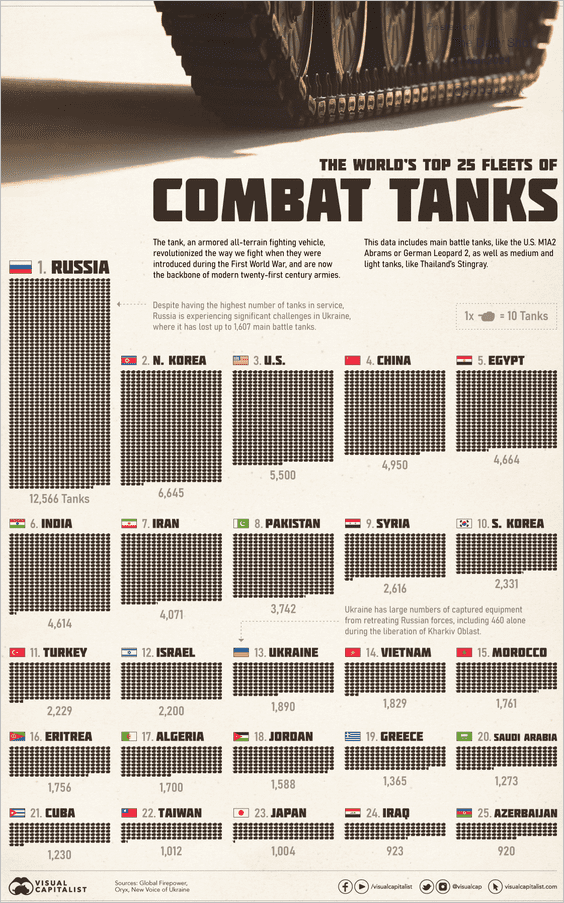 Source: Visual Capitalist Read full article
3. Frozen embryo personhood:
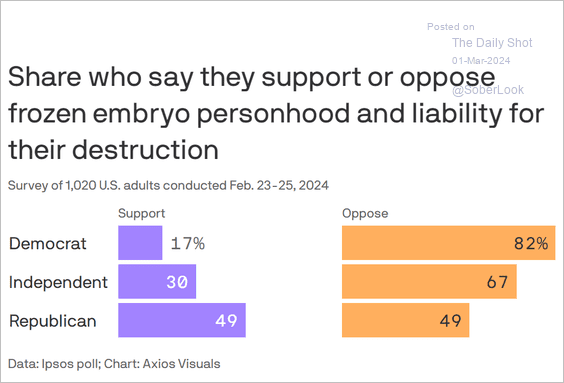 Source: @axios Read full article
4. Social media usage:
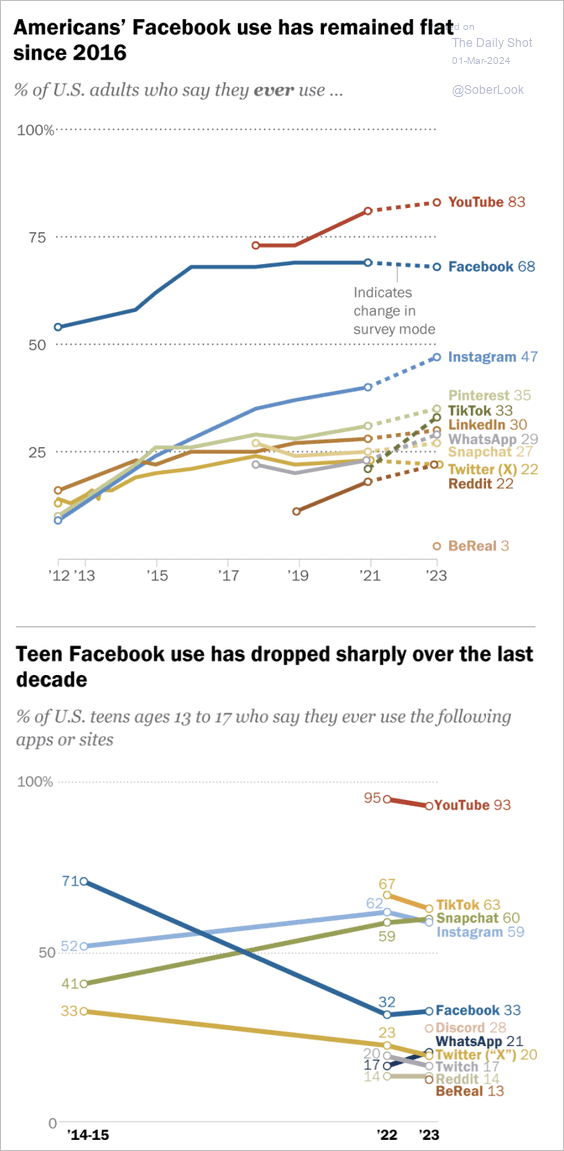 Source: Pew Research Center Read full article
5. Most common types of cancer in the US:
 Source: Statista
6. Best-selling global recording artists:
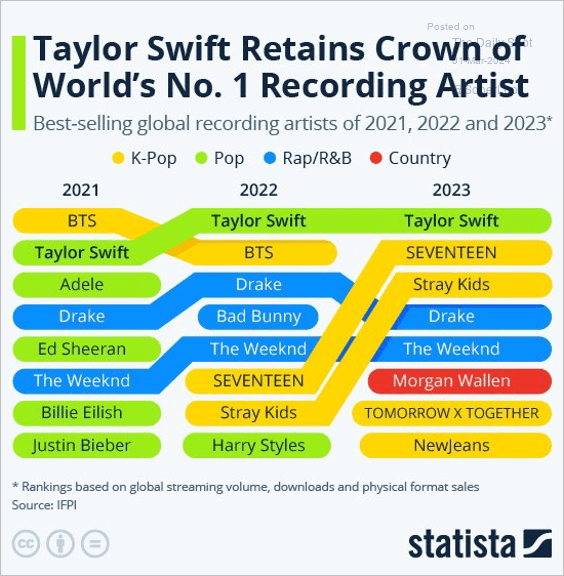 Source: Statista
——————–
Have a great weekend!
Back to Index