
The Daily Shot: 05-Mar-24
• The United States
• The Eurozone
• Europe
• Japan
• Asia-Pacific
• China
• Emerging Markets
• Cryptocurrency
• Commodities
• Energy
• Equities
• Credit
• Global Developments
• Food for Thought
The United States
1. Let’s begin with consumer spending trends.
• Goods spending remains elevated relative to services.
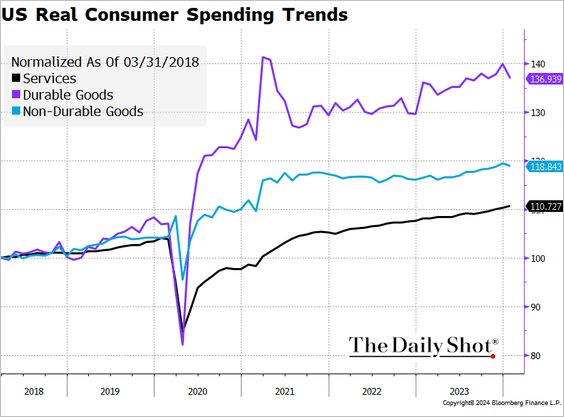 Source: @TheTerminal, Bloomberg Finance L.P.
Here is the goods share of total spending compared to the pre-COVID trend.
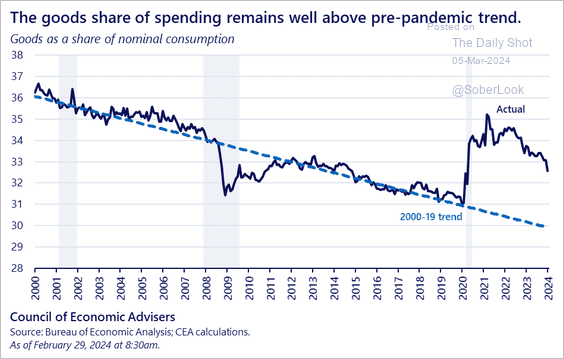 Source: @WhiteHouseCEA
• There is a weak/negative relationship between household cash balances and spending.
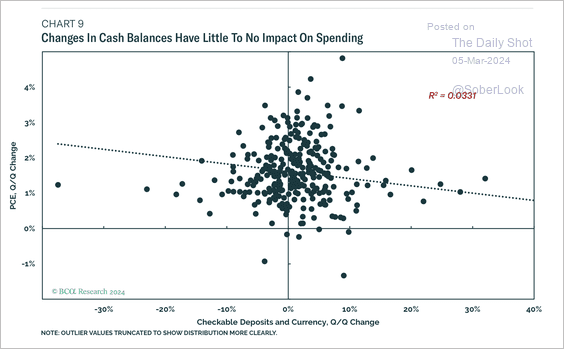 Source: BCA Research
• Higher income earners are more aggressive adopters of buy now, pay later mostly because of its convenience.
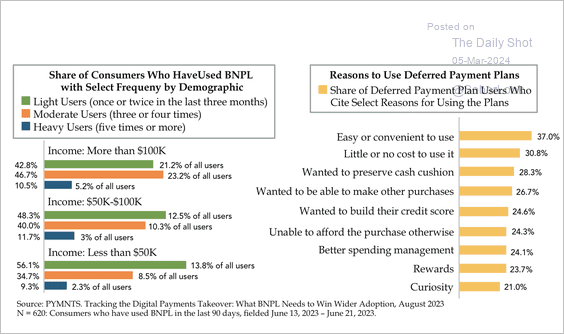 Source: Quill Intelligence
——————–
2. Next, we have some updates on the labor market.
• WARN notices continue to signal higher unemployment claims ahead.
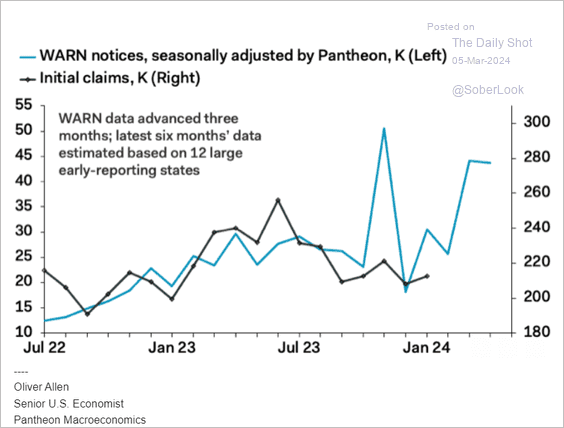 Source: Pantheon Macroeconomics
• A tighter labor market often acts as a catalyst for enhancing productivity levels.
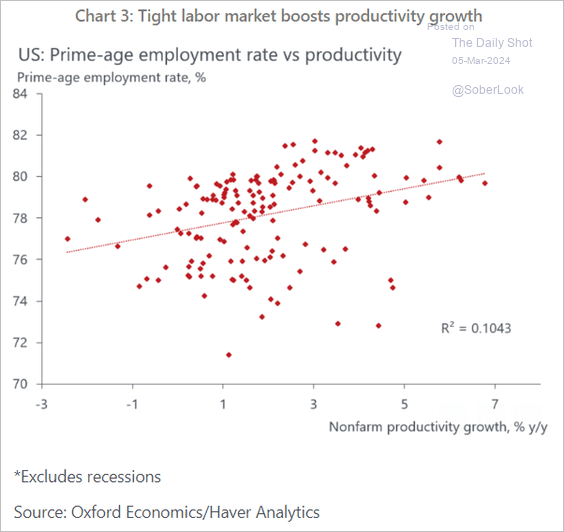 Source: Oxford Economics
• This chart shows growth in private employment by company age.
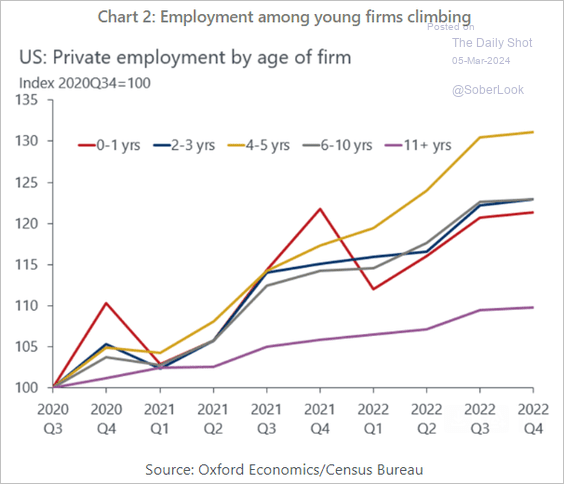 Source: Oxford Economics
——————–
3. Here is the expected number of rate cuts by unemployment rate, according to Numera Analytics.
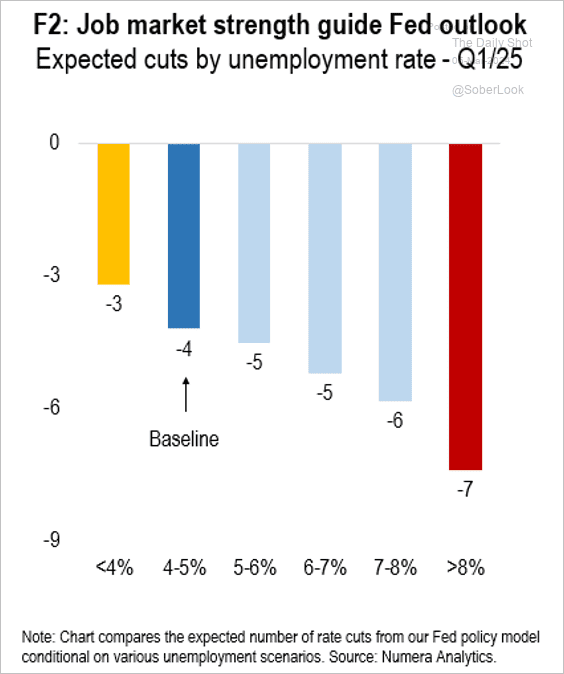 Source: Numera Analytics (@NumeraAnalytics)
• US financial conditions have not tightened so much in such a short period in recent history.
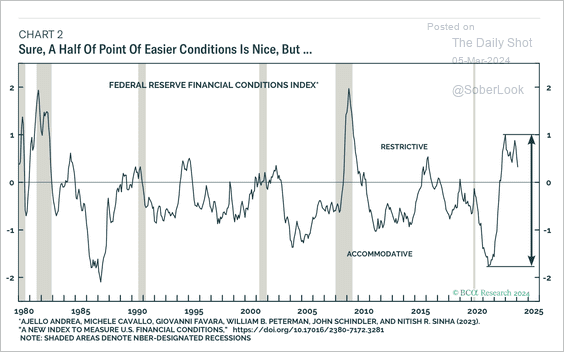 Source: BCA Research
——————–
4. Here is a look at the contributions to US private non-residential real estate spending.
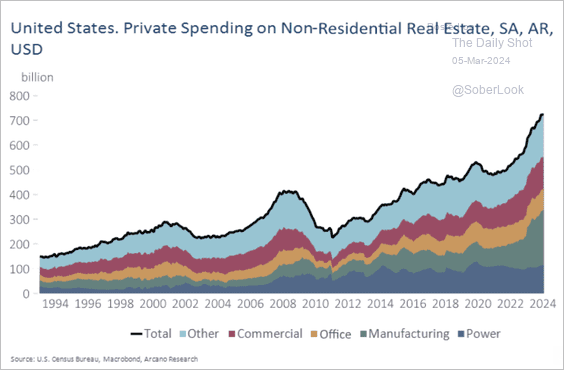 Source: Arcano Economics
Back to Index
The Eurozone
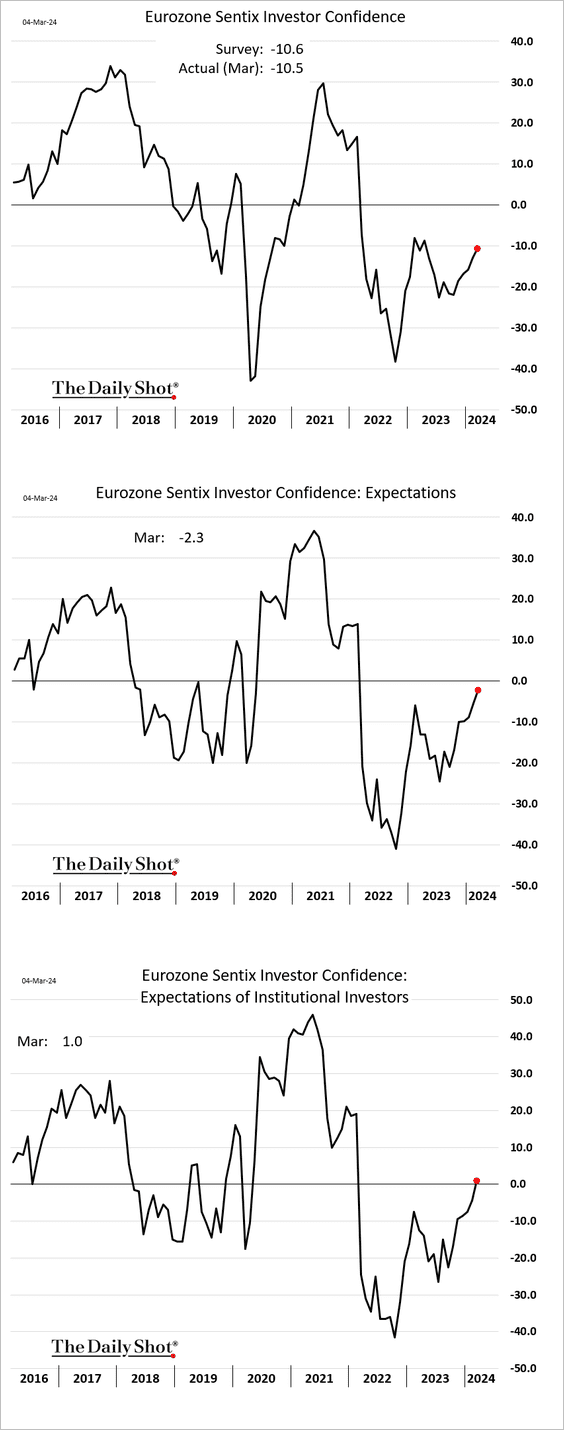
1. Euro-area investor sentiment continues to improve.
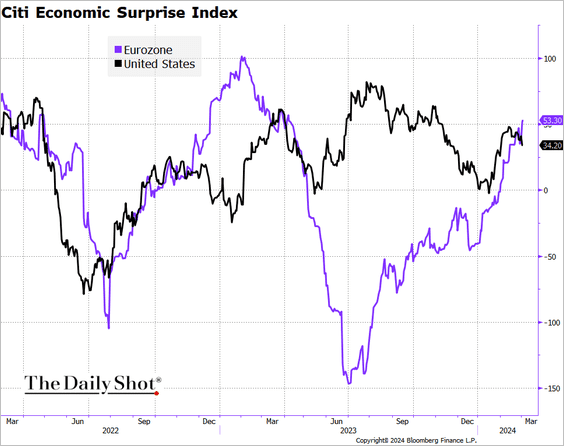
2. The Citi Economic Surprise Index for the Eurozone is now above that of the US.
 Source: @TheTerminal, Bloomberg Finance L.P.
3. Here is a look at the ECB monetary policy transmission relative to previous hiking cycles.
![]() Source: ECB Read full article
Source: ECB Read full article
4. Germany’s energy-intensive sectors have exerted a significant downward pressure on economic growth.
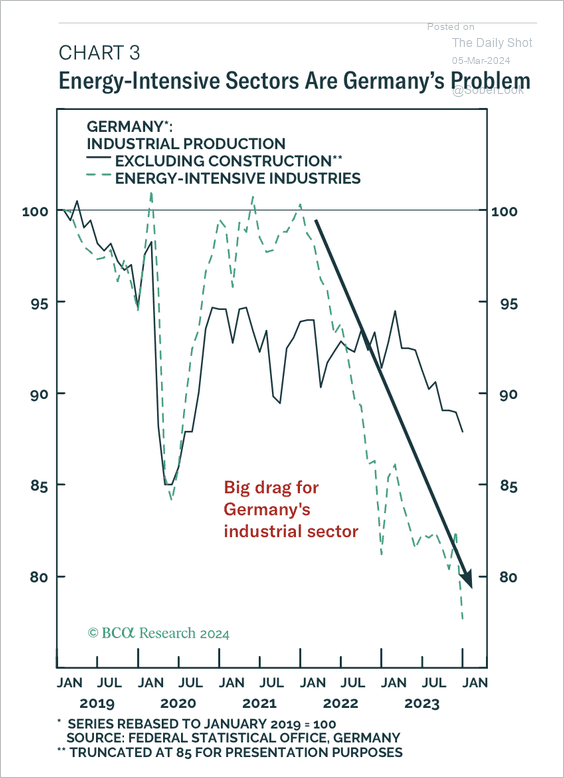 Source: BCA Research
Back to Index
Europe
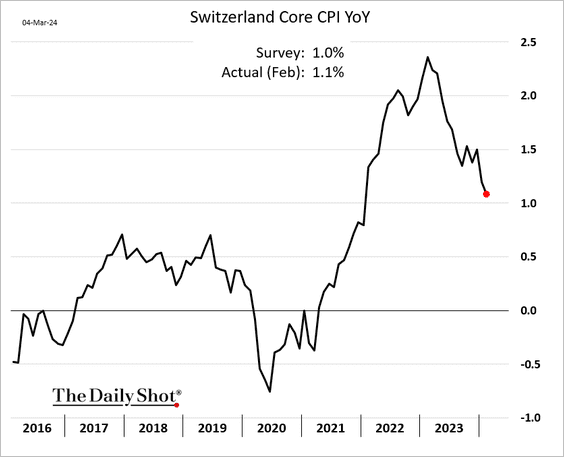
1. Swiss core inflation is nearing 1%.
2. Next, we have some data on energy sources in Europe.
• Share of energy from renewables:
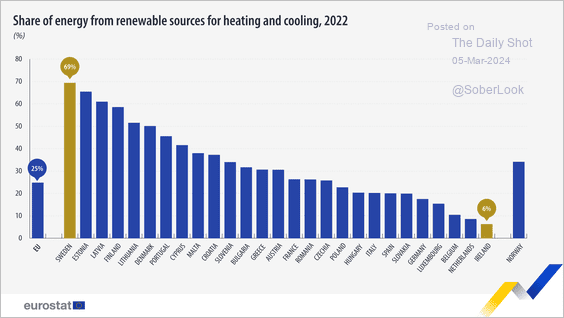 Source: @EU_Eurostat Read full article
• New wind capacity installed:
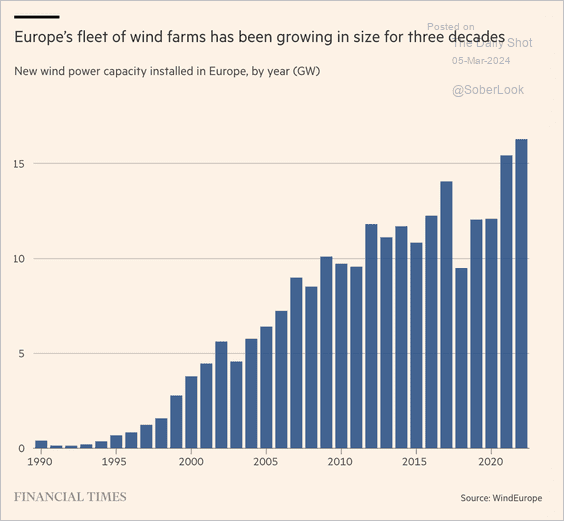 Source: @financialtimes Read full article
• Electricity generation by technology:
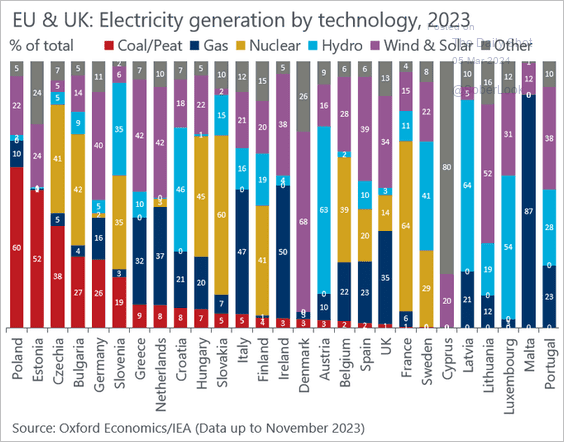 Source: @DanielKral1, @OxfordEconomics
– Year-over-year changes:
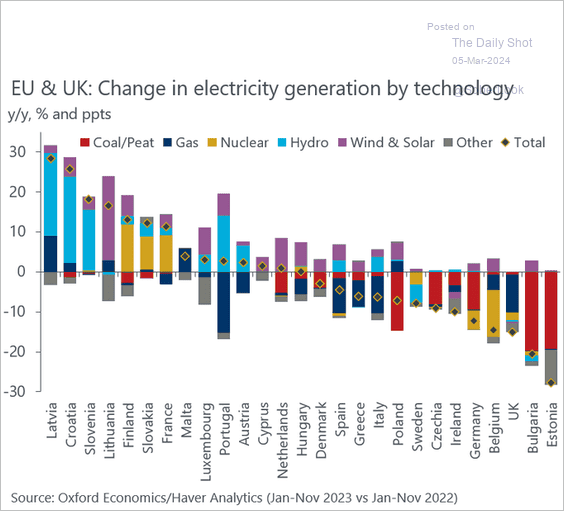 Source: @DanielKral1, @OxfordEconomics
Back to Index
Japan
1. Tokyo CPI strengthened last month.
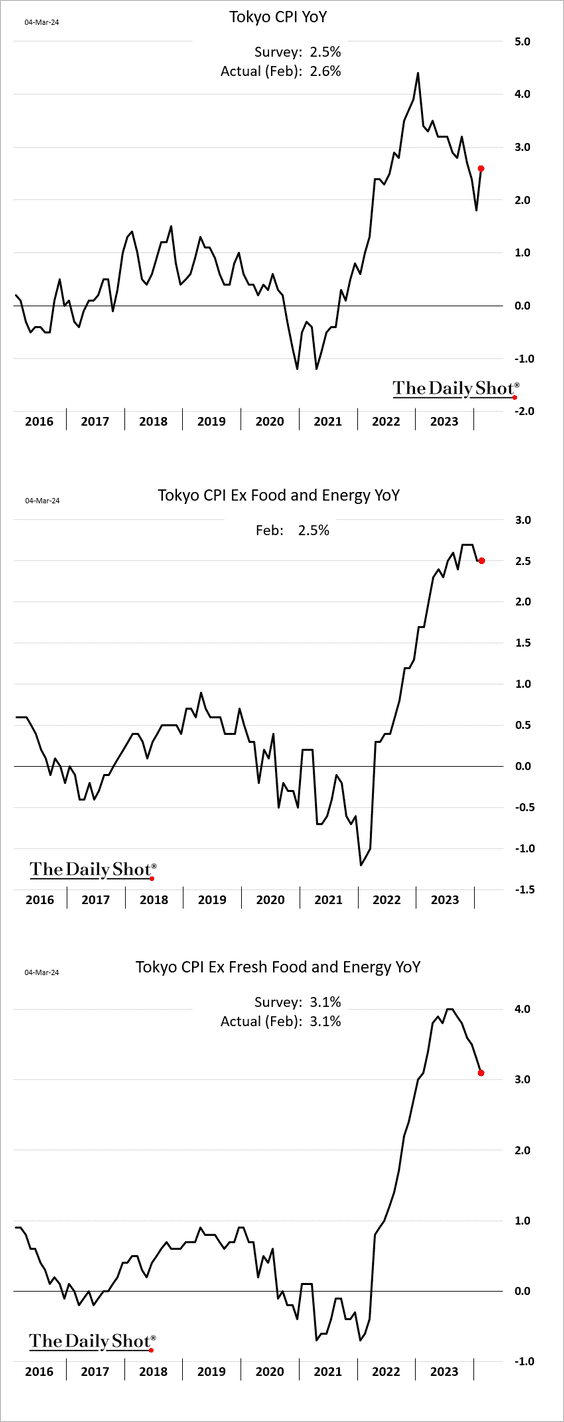
 Source: @economics Read full article
——————–
2. Earnings growth has been outpacing the US.
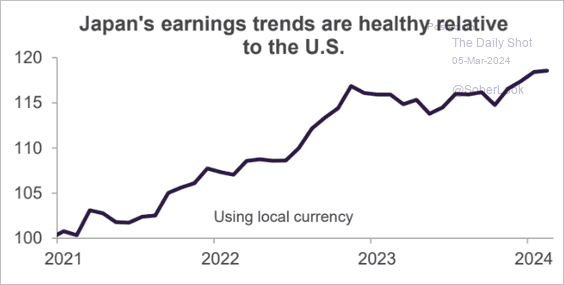 Source: Truist Advisory Services
3. Japan faces increasingly challenging demographic trends.
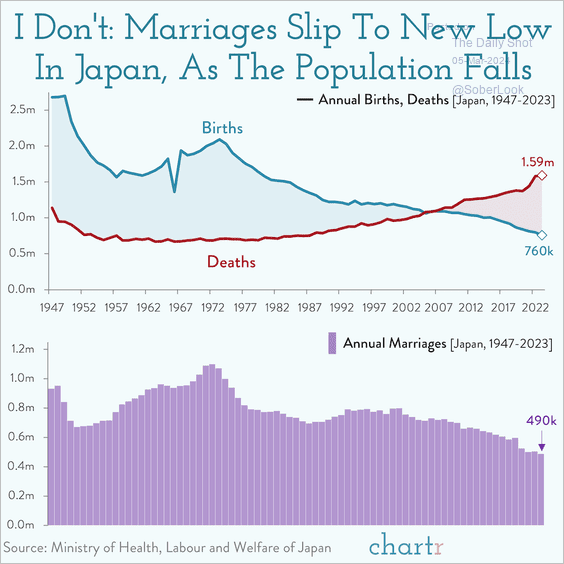 Source: @chartrdaily
Back to Index
Asia-Pacific
1. Singapore’s business activity accelerated further last month.
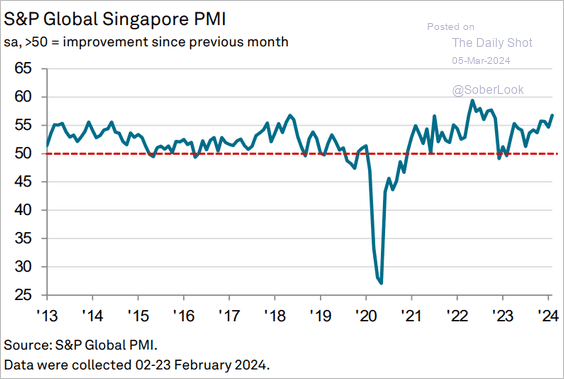 Source: S&P Global PMI
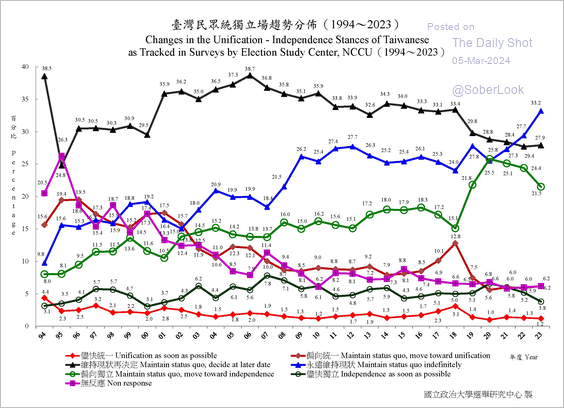
2. An increasing number of Taiwanese individuals favor indefinitely maintaining the current status quo regarding relations with China.
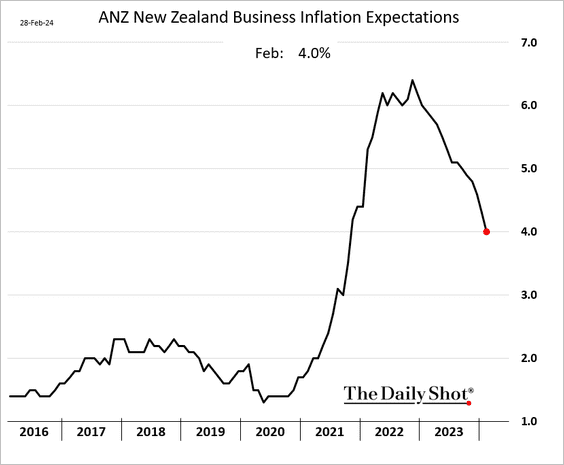
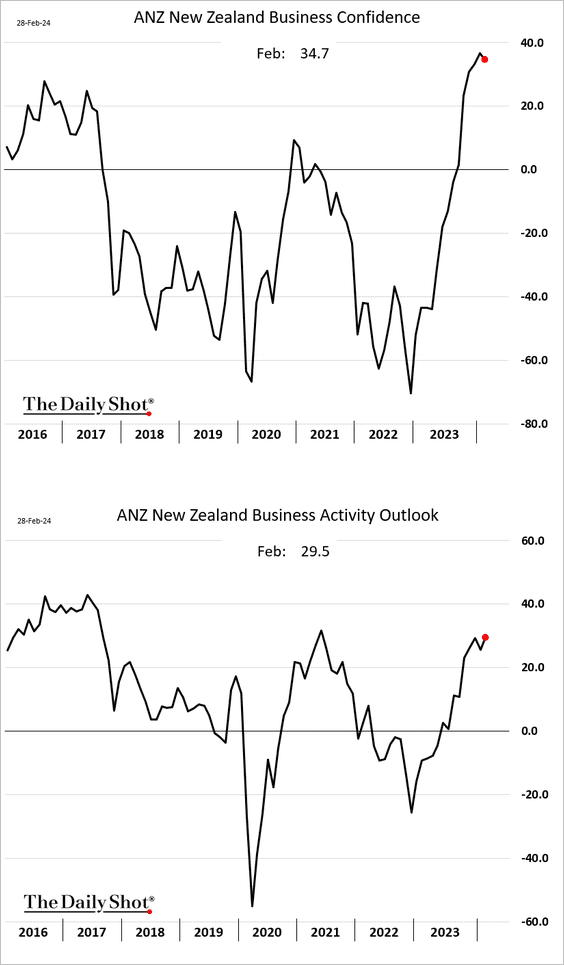
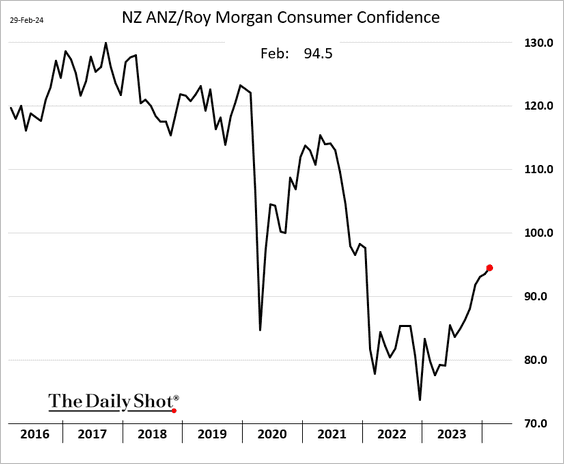
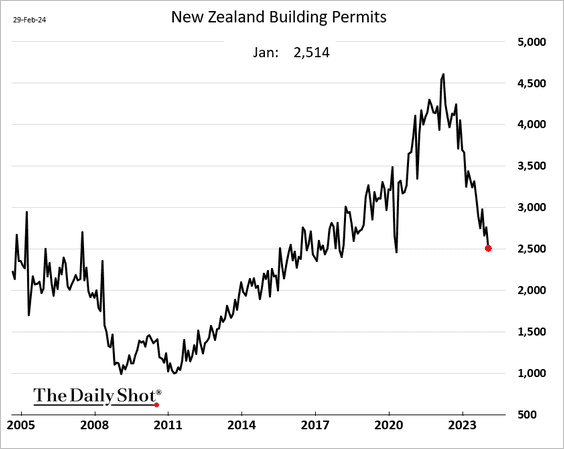
3. Next, we have some updates on New Zealand.
• Businesses’ expectations for inflation, while still at a high level, have been showing signs of easing.
• Business sentiment has been robust.
• Consumer confidence is rebounding.
• Building permits continue to slow.
Back to Index
China
1. Growing concerns surround China’s real estate behemoth Venke as the company’s bond prices tumble.
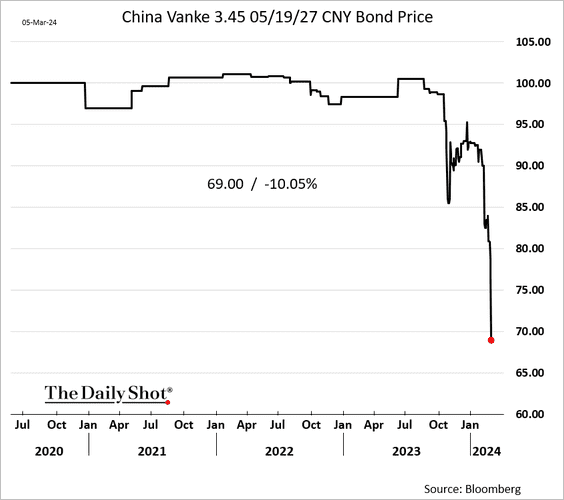
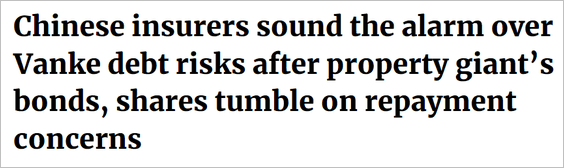 Source: South China Morning Post Read full article
Here is the share price in Hong Kong.
——————–
2. Trading activity in mainland shares has risen as Beijing initiated massive purchases by state-affiliated entities.
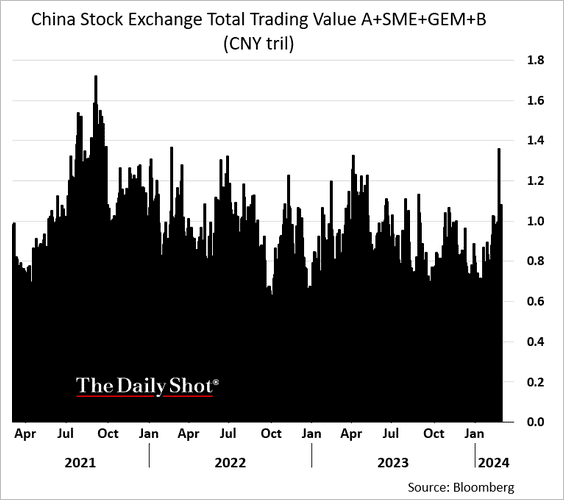 h/t Lin Zhu
• Shares are trading at deep discounts to global peers.
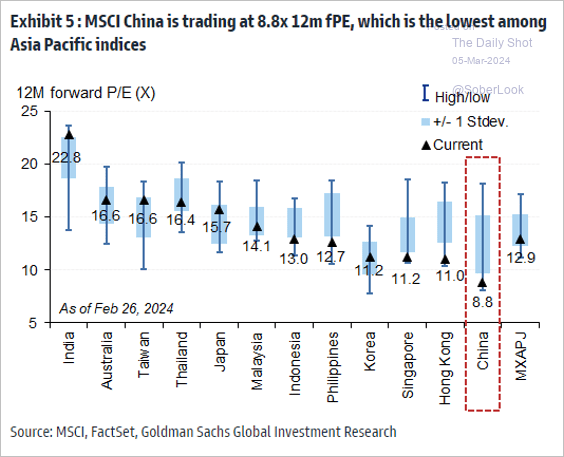 Source: Goldman Sachs; @MikeZaccardi
• Allocators are not rushing into China, preferring India and Japan instead.
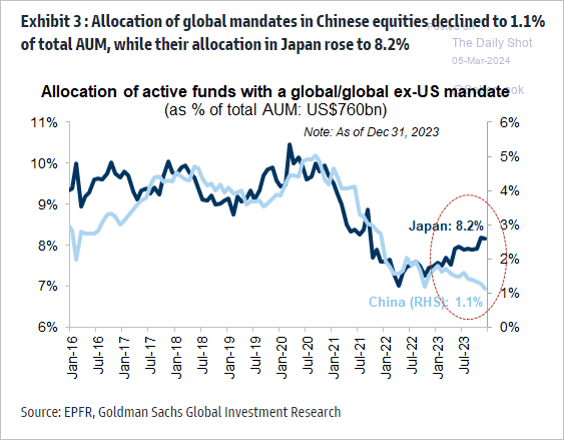 Source: Goldman Sachs; @MikeZaccardi
• The Hang Seng Index is rolling over, with tech and property shares under pressure.
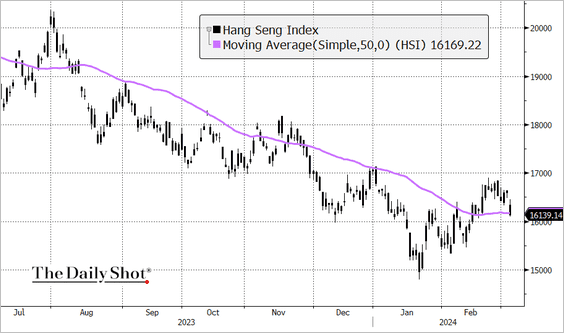 Source: @TheTerminal, Bloomberg Finance L.P.
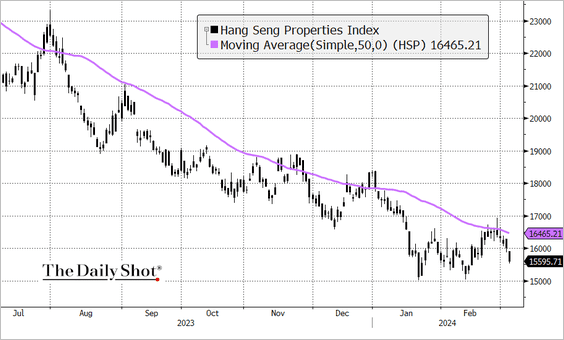 Source: @TheTerminal, Bloomberg Finance L.P.
——————–
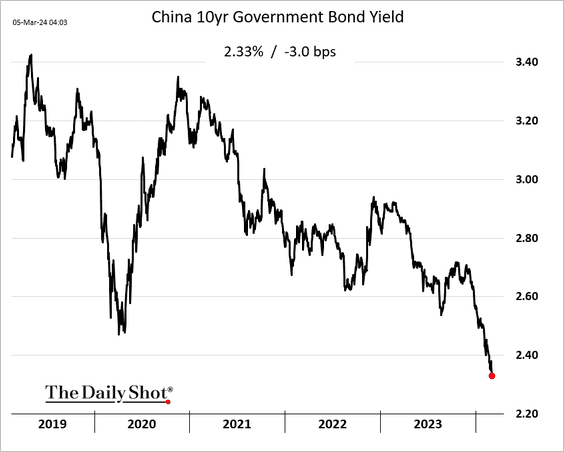
3. Bond yields continue to sink.
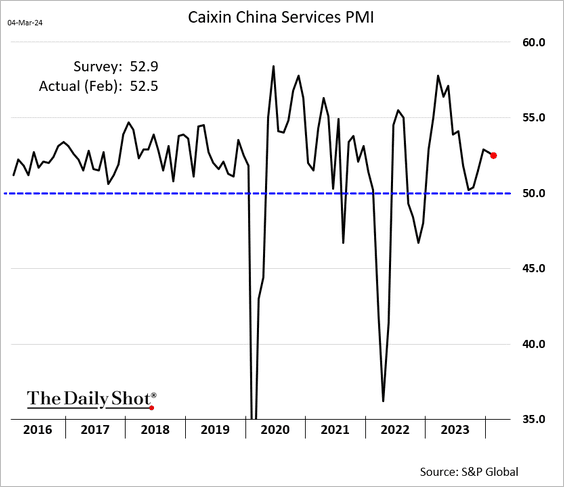
4. Services PMI remained well in growth territory last month.
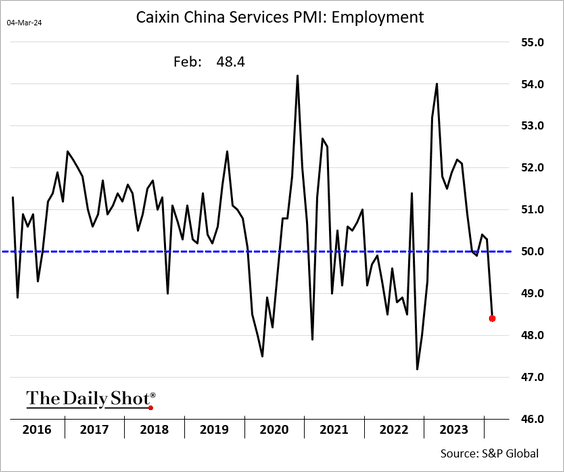
But employment in services appears to be declining.
——————–
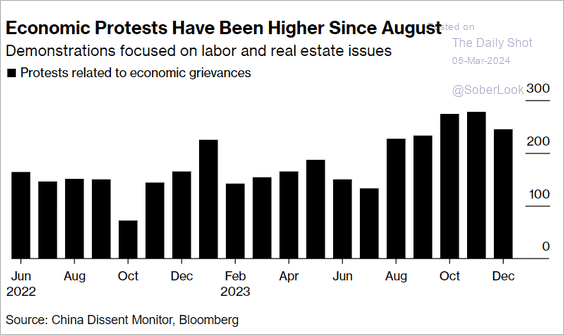
5. Economic protests picked up last year.
 Source: @business Read full article
Back to Index
Emerging Markets
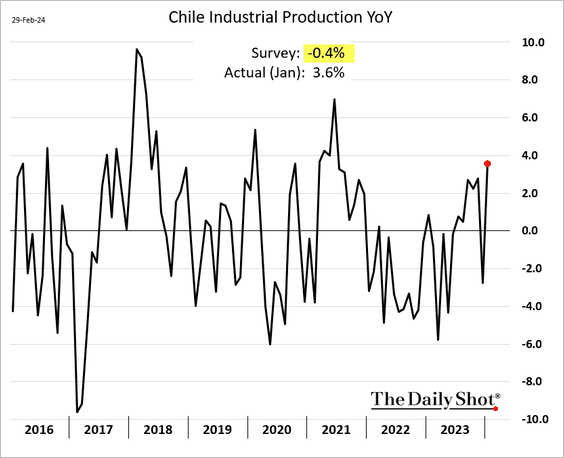
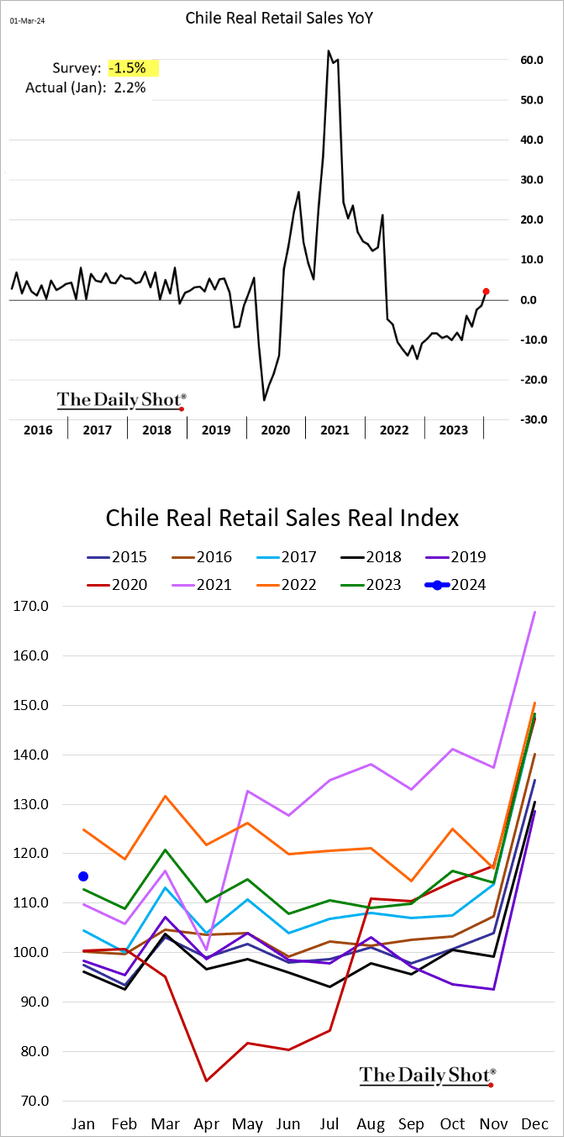
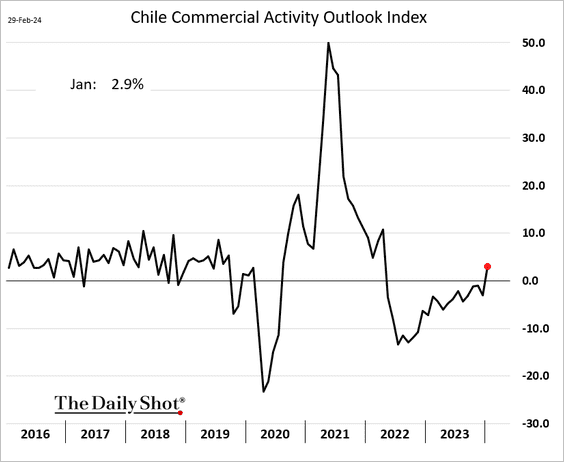
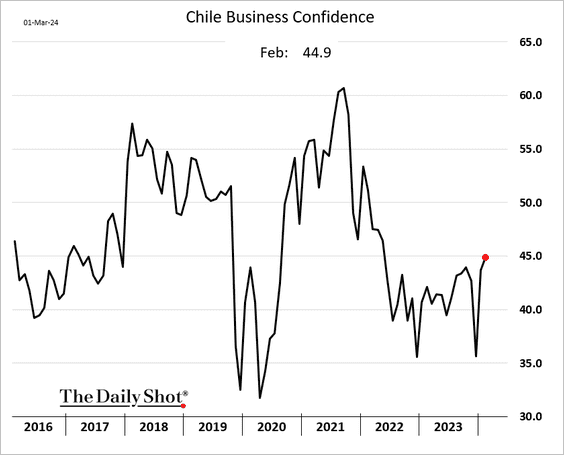
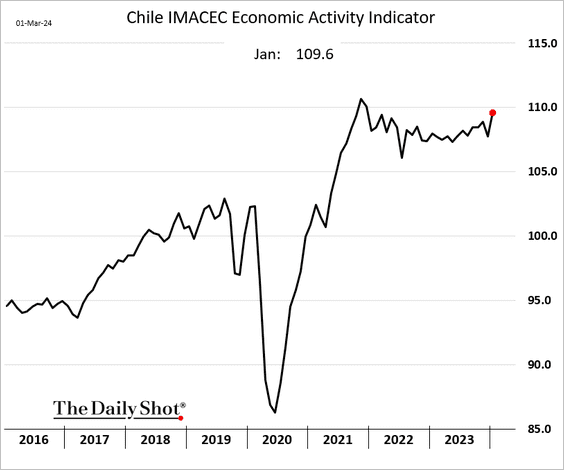
1. Let’s begin with Chile, where economic activity is rebounding.
• Industrial production (upside surprise):
• Retail sales (above last year’s levels):
• Commercial activity outlook:
• Business confidence:
• Economic activity:
——————–
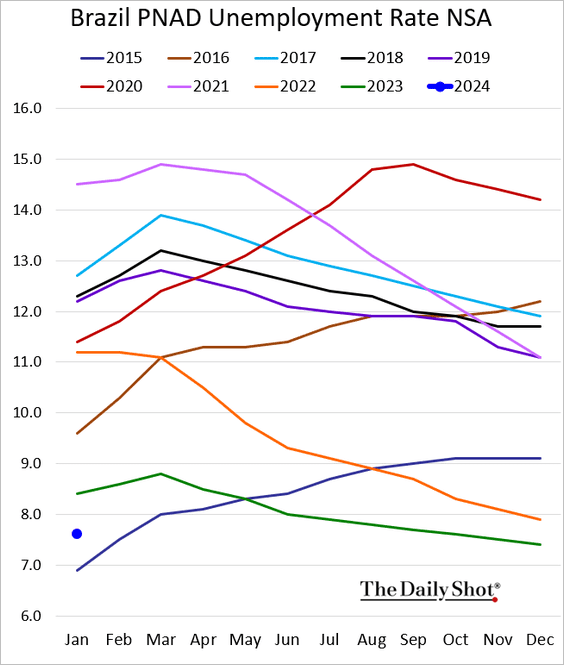
2. Brazil’s unemployment rate was well below 2023 levels in January.
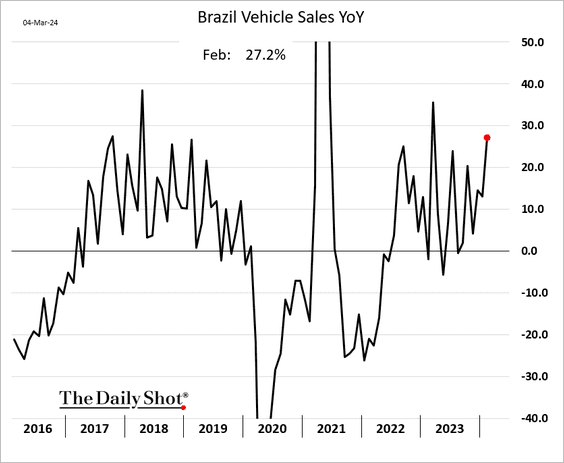
• Vehicle sales are rising.
——————–
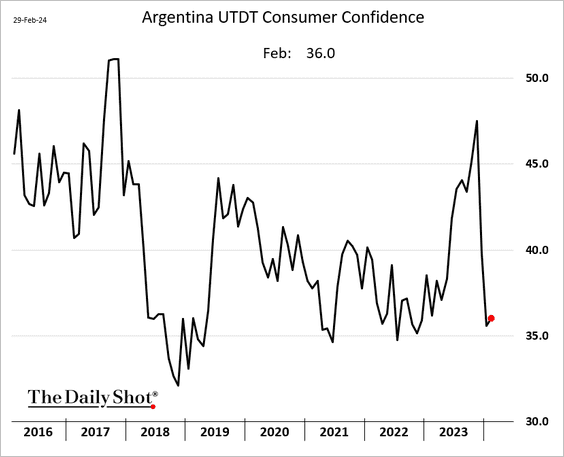
3. Argentina’s consumer confidence remains depressed after the elections.
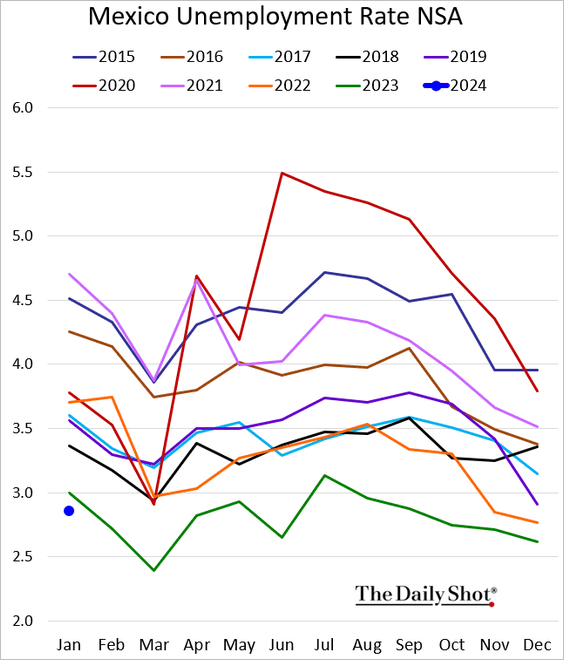
4. Mexico’s unemployment hit the lowest level in years.
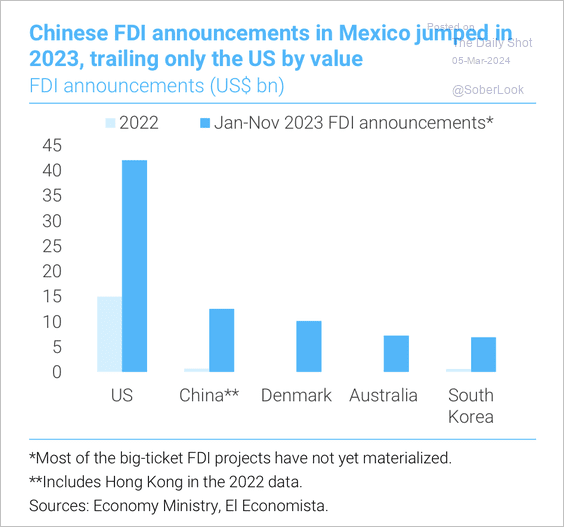
• The US, China, and others have increased their foreign direct investment in Mexico over the past year.
 Source: TS Lombard
——————–
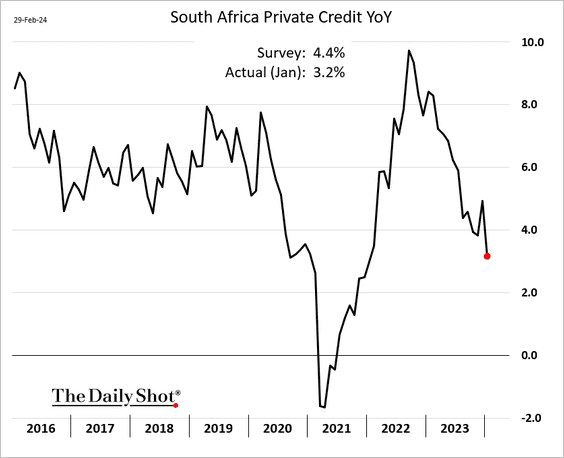
5. South Africa’s private credit growth is slowing.
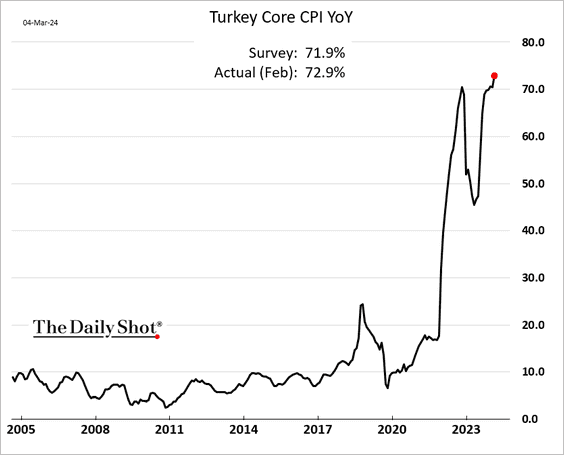
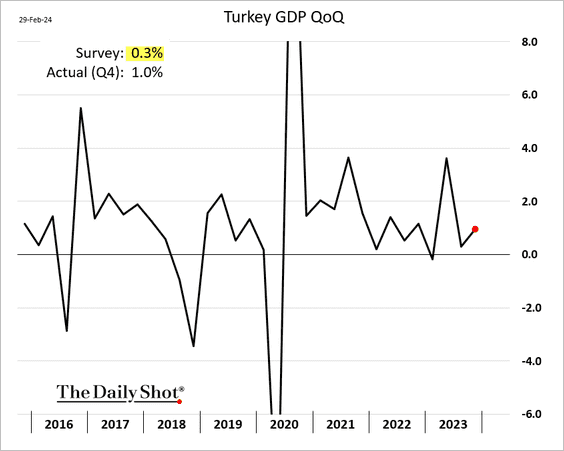
6. Turkey’s core inflation hit a new high. And yet, the government does not expect any more rate hikes.
• The Q4 GDP growth topped expectations.
——————–
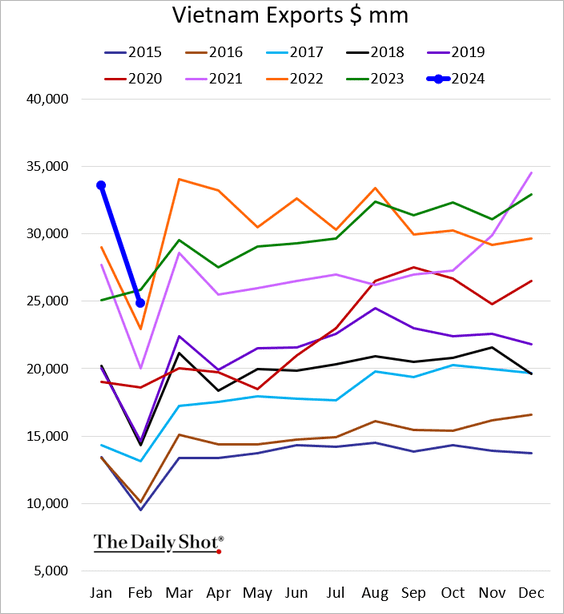
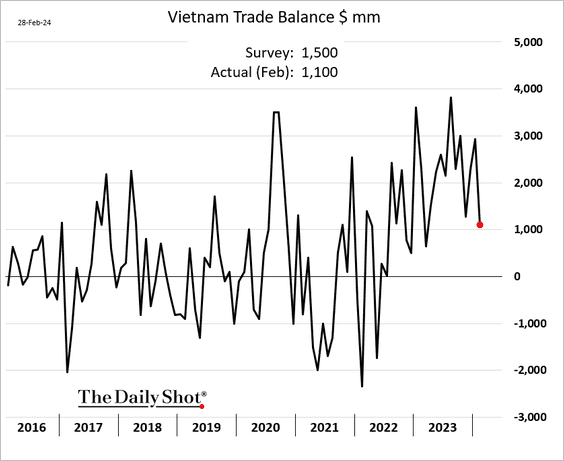
7. VIetnam’s exports dipped below last year’s levels in January.
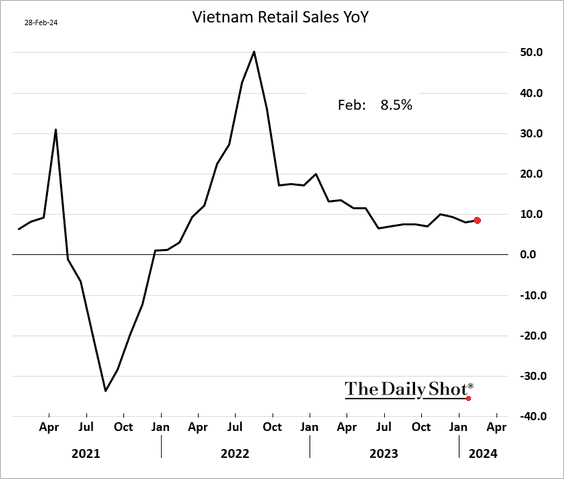
• Retail sales growth remains robust.
——————–
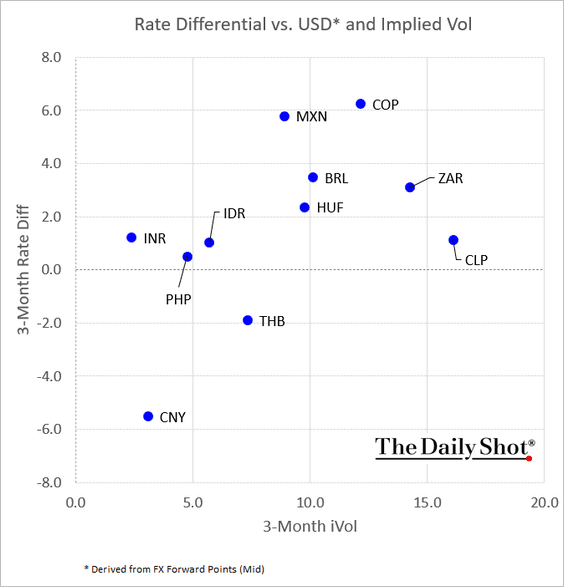
8. This scatterplot shows EM currency carry (vs. USD) and implied volatility (expected performance vs. perceived risk).
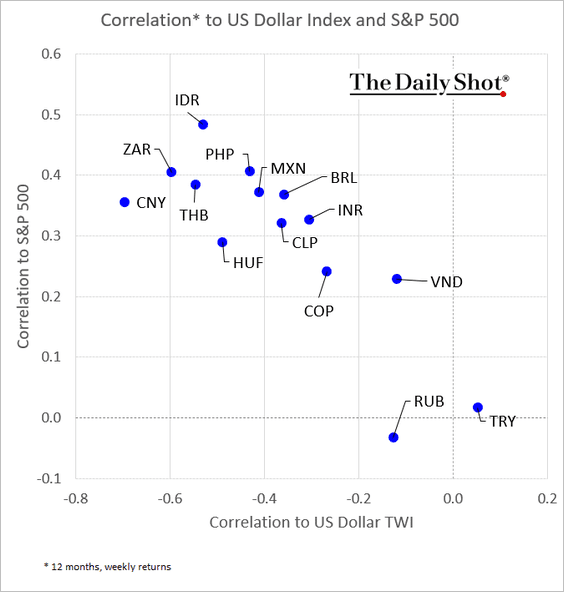
• Here is the correlation to the S&P 500 and the US dollar index.
Back to Index
Cryptocurrency
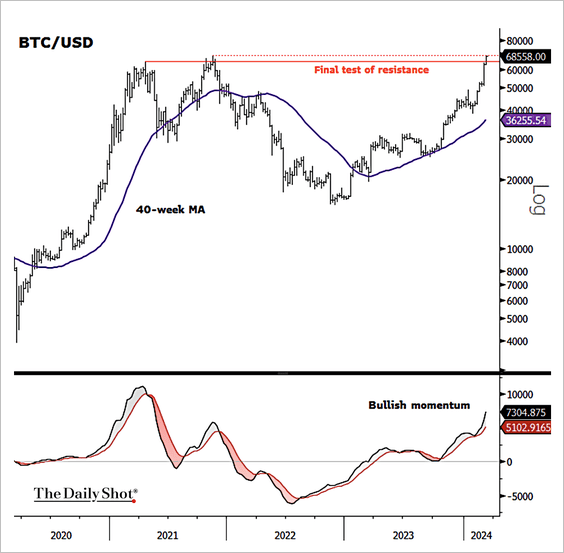
1. BTC/USD is testing all-time highs.
 Source: @TheTerminal, Bloomberg Finance L.P.
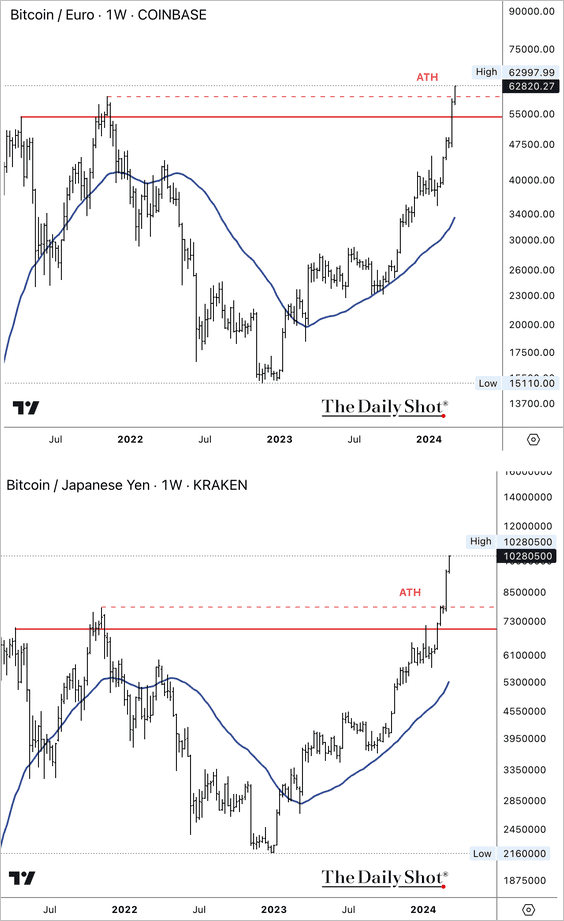
2. Bitcoin has already made all-time highs against the euro and yen.
3. There has been aggressive buying of BTC on the Binance exchange since last week.
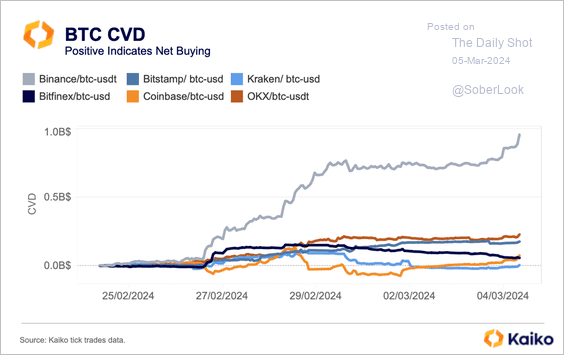 Source: @KaikoData
4. More short positions were liquidated when BTC crossed above $65K.
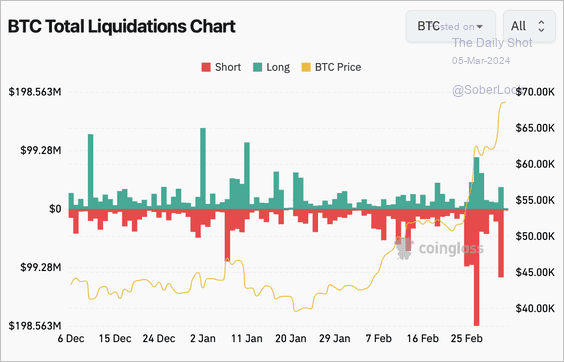 Source: Coinglass
5. Memecoins have been surging as speculative fervor grips the market. This brings back memories of Cabbage Patch Kids, Furbys, Pokemon Cards, and Beanie Babies.
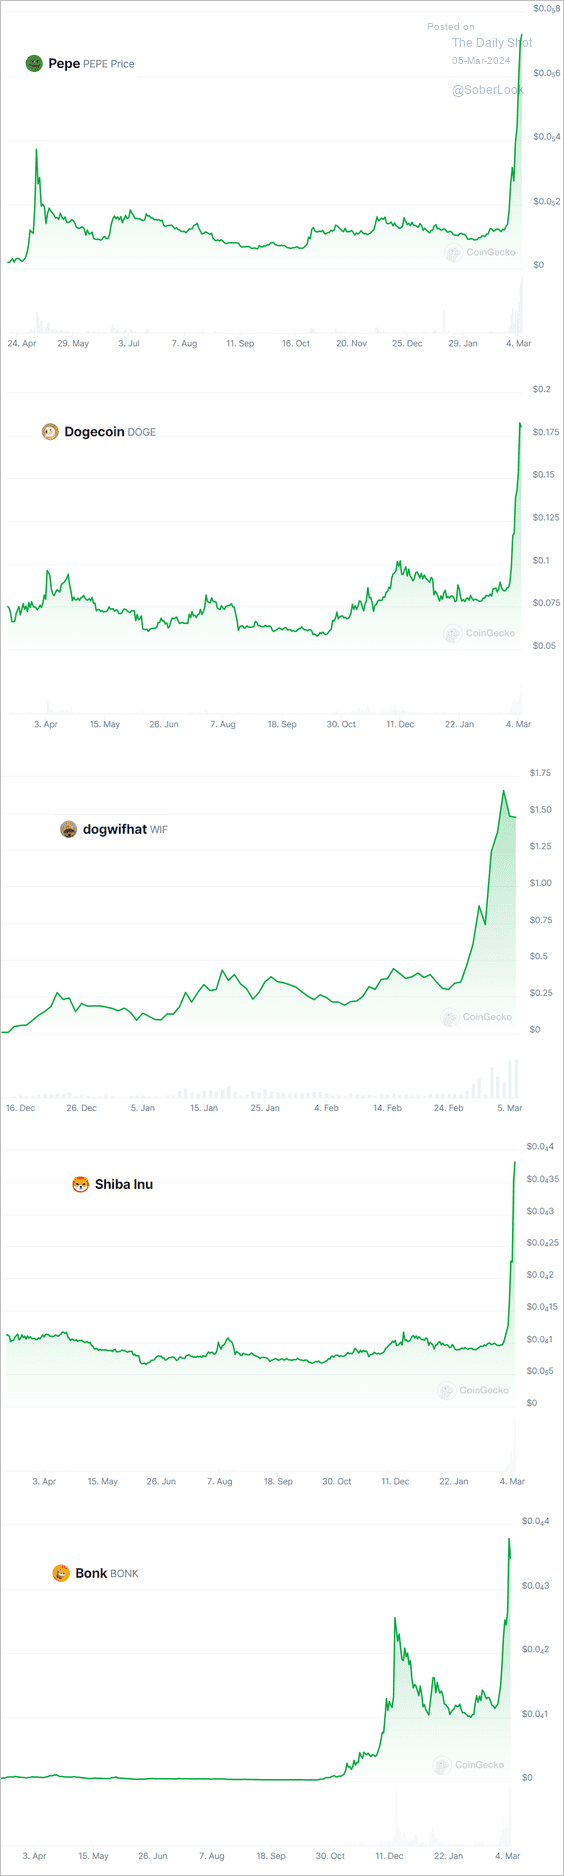 Source: CoinGecko
6. The Crypto Fear & Greed Index moved deeper into “extreme greed” territory.
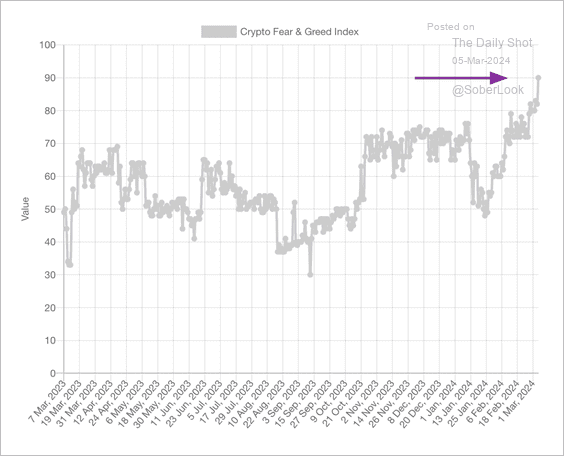 Source: Alternative.me
7. US ETFs continue to dominate crypto fund inflows.
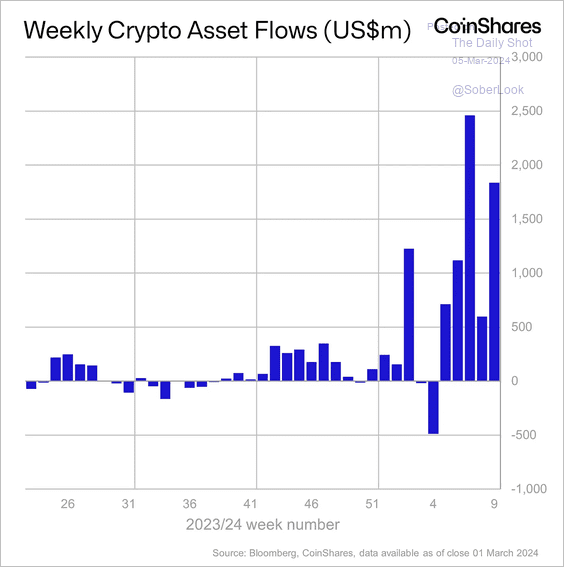 Source: CoinShares Read full article
However, short bitcoin products saw inflows last week.
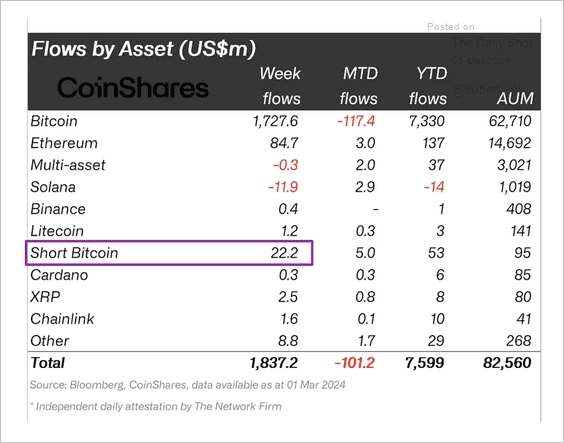 Source: CoinShares Read full article
——————–
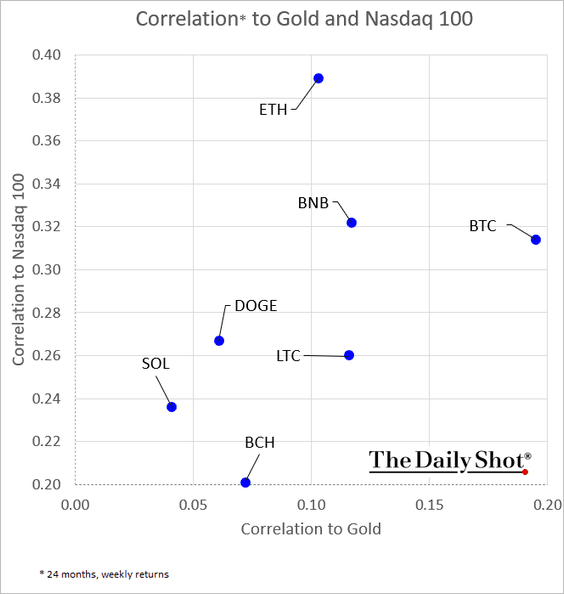
8. Here is a look at cryptos’ correlation to the Nasdaq 100 and gold.
Back to Index
Commodities
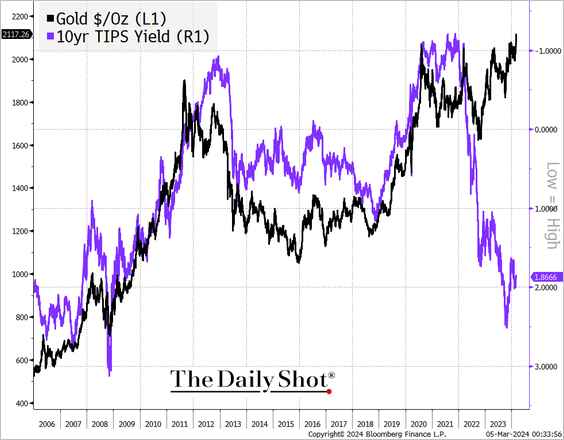
1. Let’s begin with some updates on gold.
• Gold is surging despite shrinking gold ETF assets, …
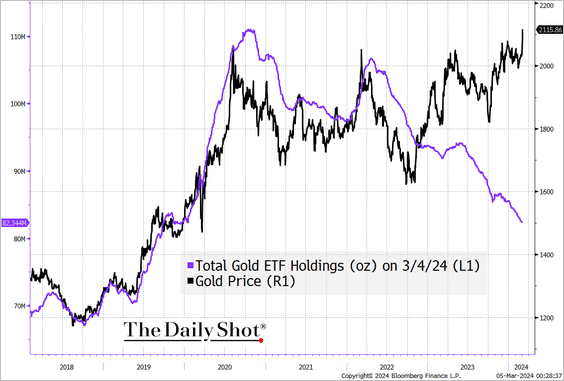 Source: @TheTerminal, Bloomberg Finance L.P.
… and high real rates.
 Source: @TheTerminal, Bloomberg Finance L.P.
• The elevated gold put-call ratio has been supporting the rally.
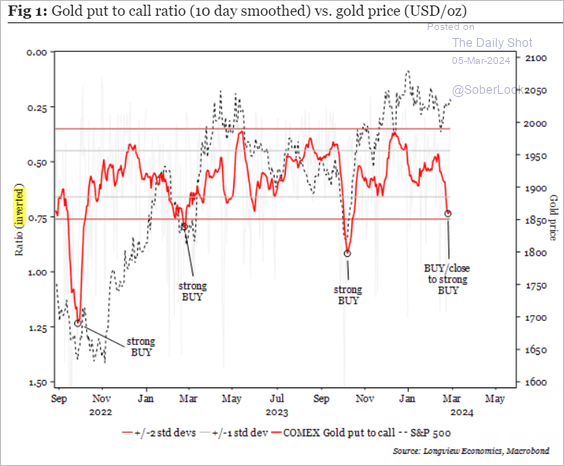 Source: Longview Economics
• A pullback in Fed rate cut expectations is a headwind.
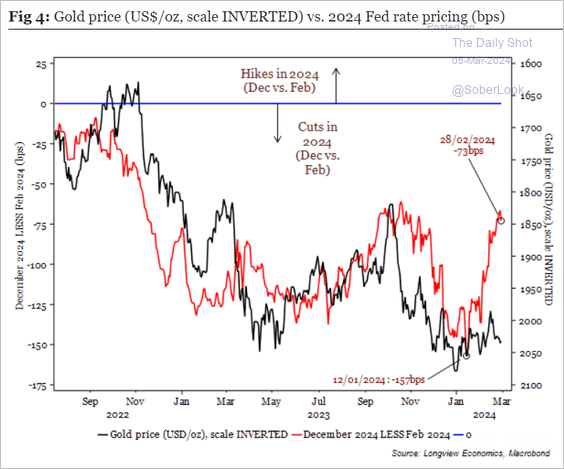 Source: Longview Economics
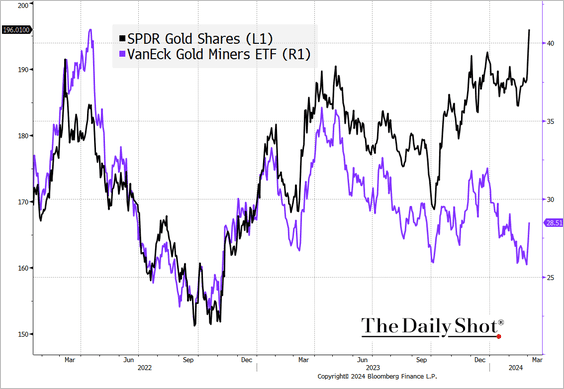
• Gold is diverging from gold miners.
 Source: @TheTerminal, Bloomberg Finance L.P.
——————–
2. Copper mining stocks are improving relative to the spot price.
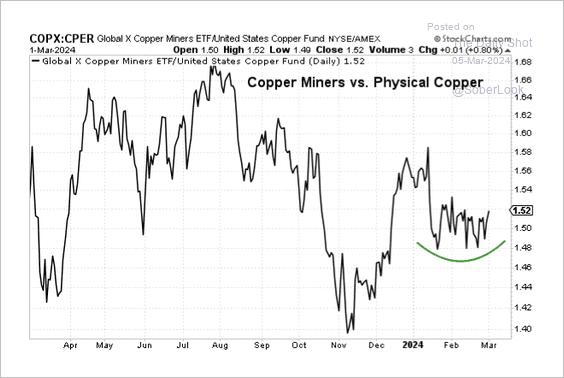 Source: Aazan Habib, Paradigm Capital
Back to Index
Energy
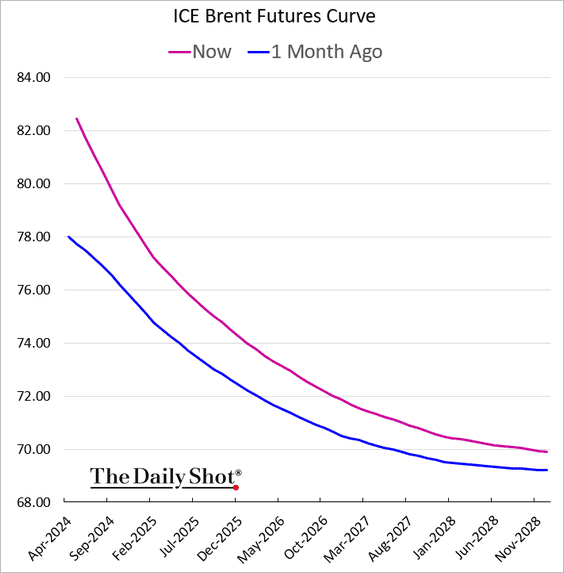
1. Backwardation of the Brent curve deepened (a bullish sign).
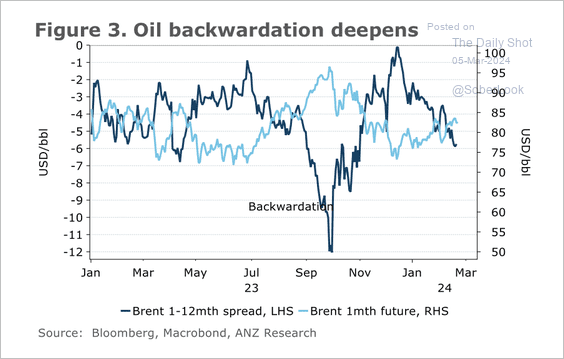 Source: @ANZ_Research
——————–
2. The Brent oil price has diverged from the copper/gold ratio.
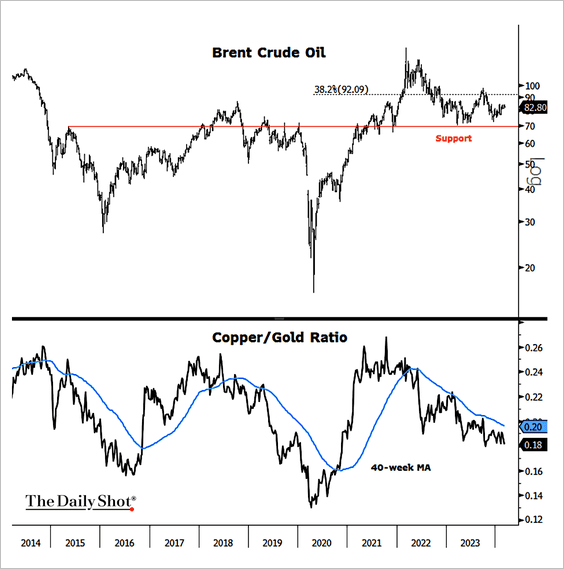 Source: @TheTerminal, Bloomberg Finance L.P.
3. Roughly 16% of the world’s oil production is under sanctions.
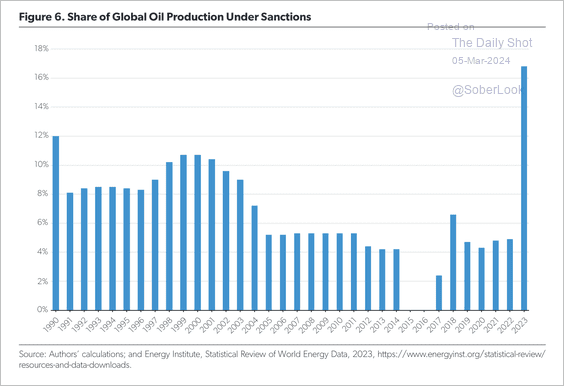 Source: AEI
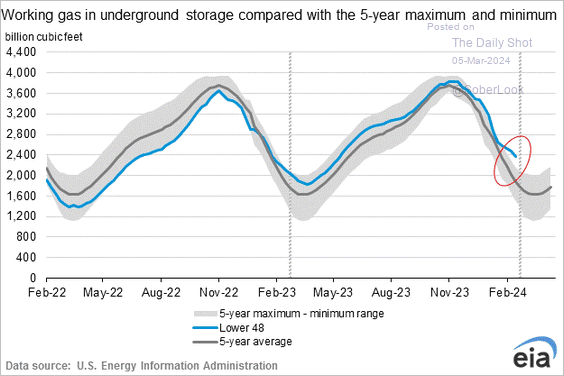
4. US natural gas in storage remains well above the 5-year range.
Back to Index
Equities
1. We are starting to see signs of increasing speculative activity in the market.
The “magnificent 7” stocks are becoming boring… it’s time to focus on meme stocks and crypto.
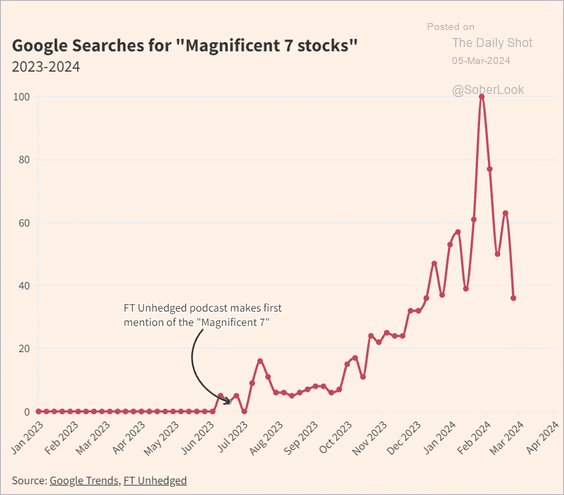 Source: @financialtimes Read full article
——————–
2. The current S&P 500 rally is similar to historical post-recession rallies and bubbles.
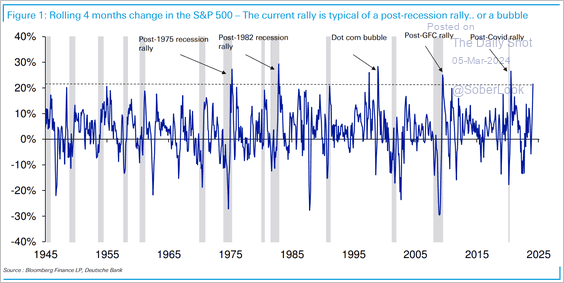 Source: Deutsche Bank Research
3. The S&P 500 concentration has been climbing.
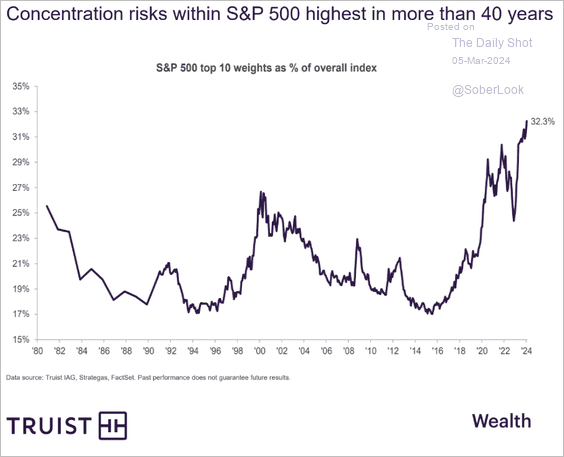 Source: Truist Advisory Services
But the US stock market concentration is not extreme relative to international equity markets.
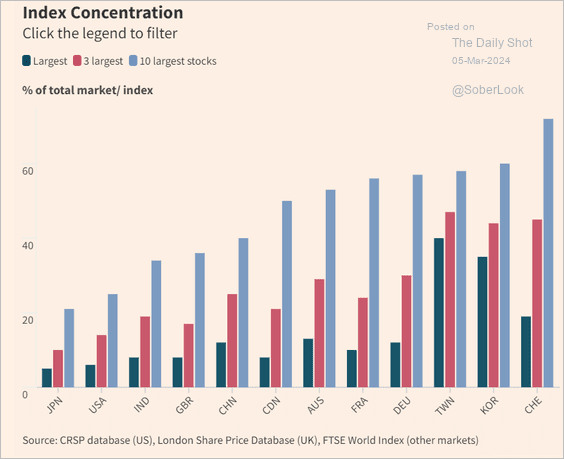 Source: @financialtimes Read full article
4. The percentage of S&P 500 members outperforming the index has broadened.
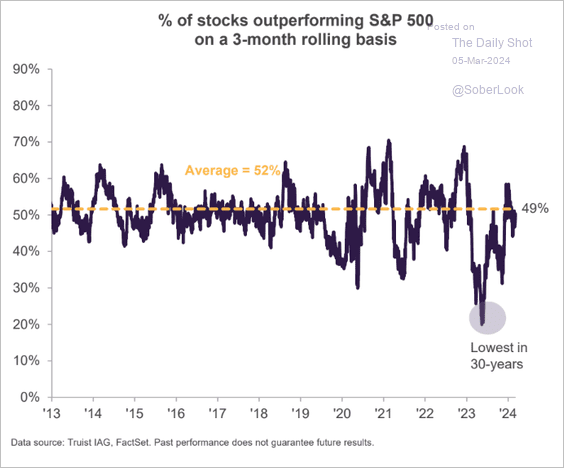 Source: Truist Advisory Services
5. Rising sales have been the largest contributor to returns among the top 10 US companies by market cap over the past six years.
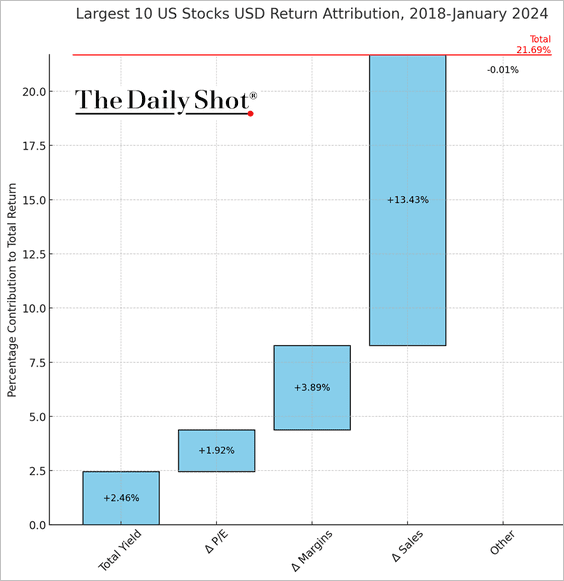 Source: Morningstar Read full article
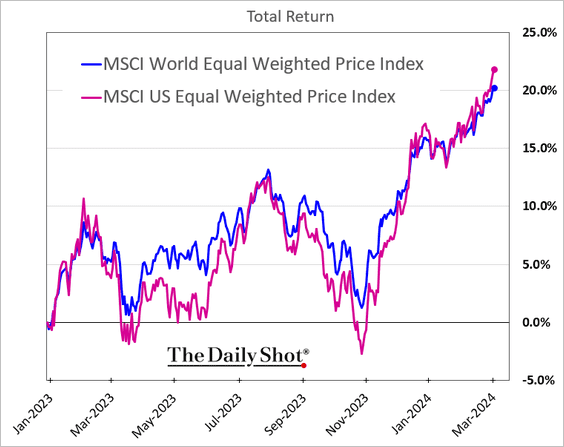
6. When the impact of currency movements is excluded, the average US stock hasn’t outperformed global peers by much.
7. The stock-bond correlation has been breaking down.
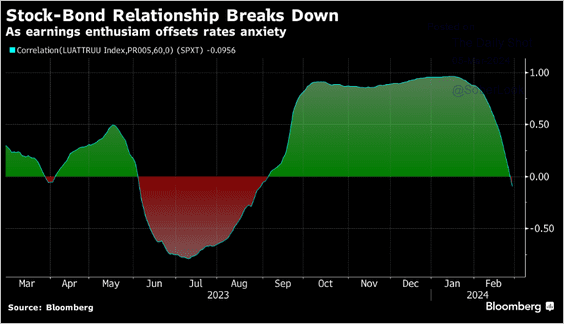 Source: Simon White, Bloomberg Markets Live Blog
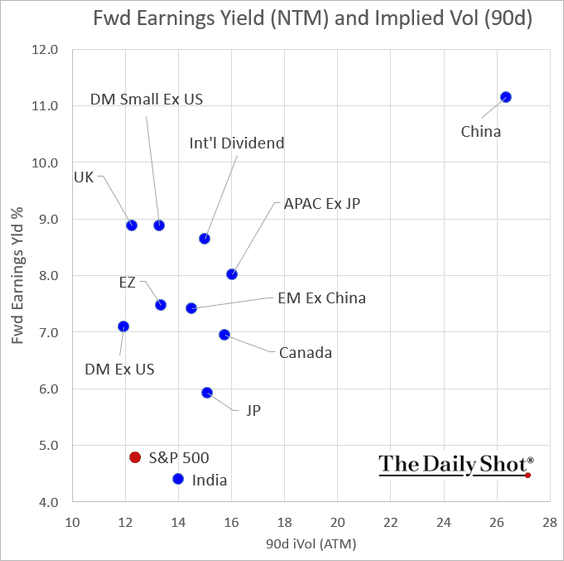
8. Next, let’s take a look at consensus earnings yields and implied volatility (projected performance vs. perceived risk).
• Factors:
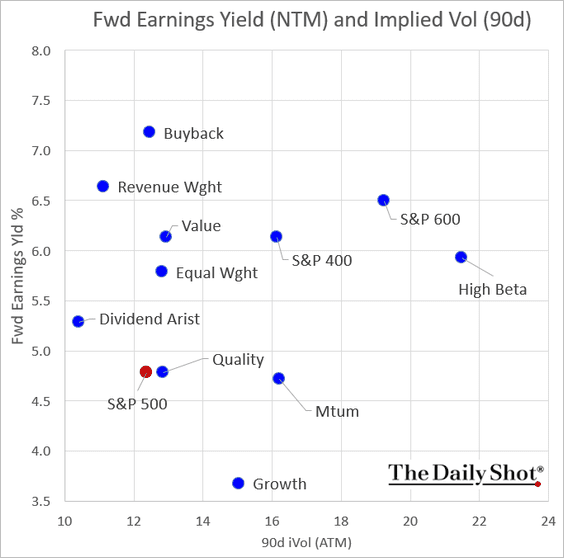
• Sectors:
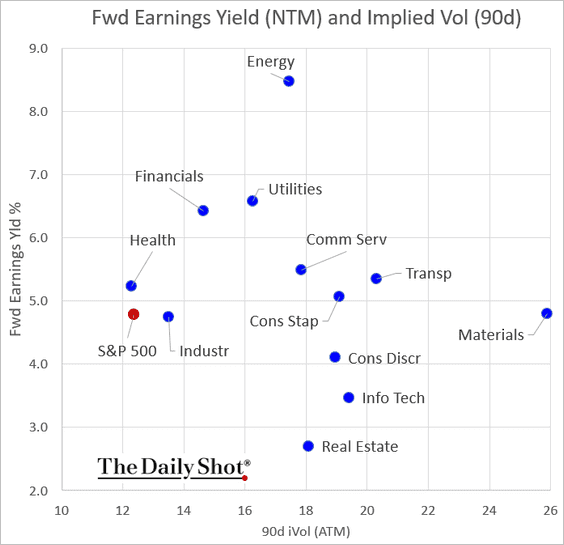
• International:
Back to Index
Credit
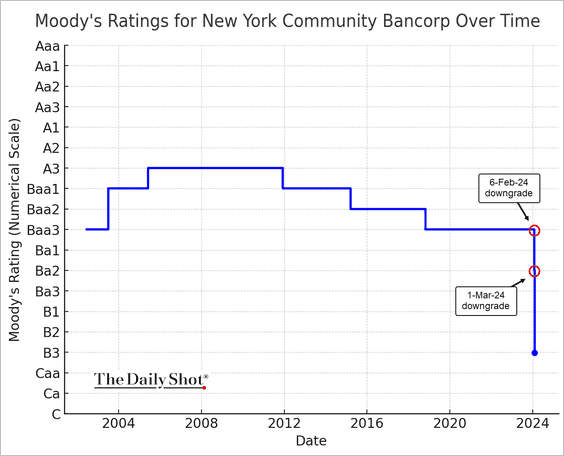
1. New York Community Bancorp assets are getting hit across the capital structure, …
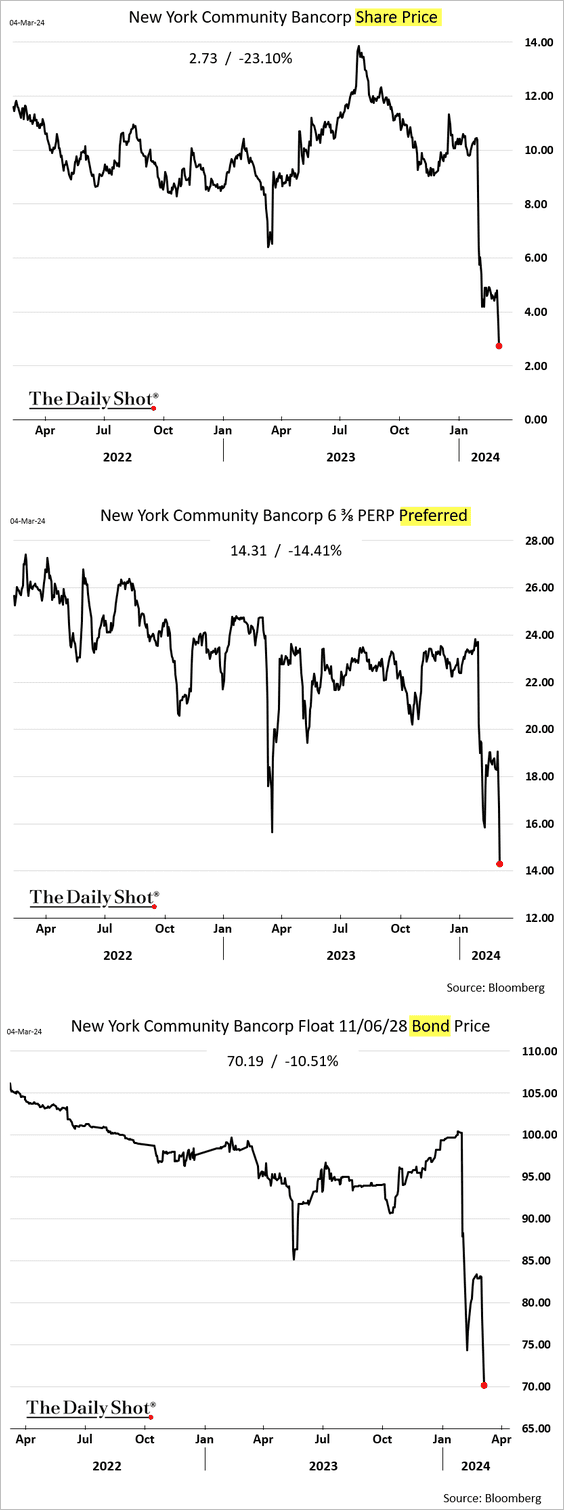
… after Moody’s downgraded the firm’s debt deeper into junk territory.
——————–
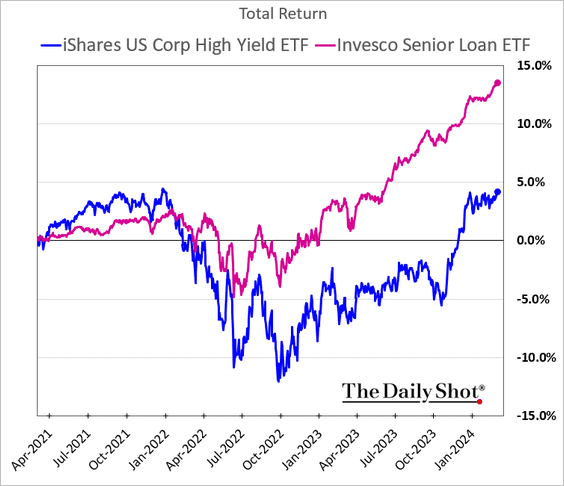
2. Leveraged loans continue to see strong returns.
3. Complacency has crept into the high-yield market, with the HYG (largest HY ETF) skew hitting a multi-year low.
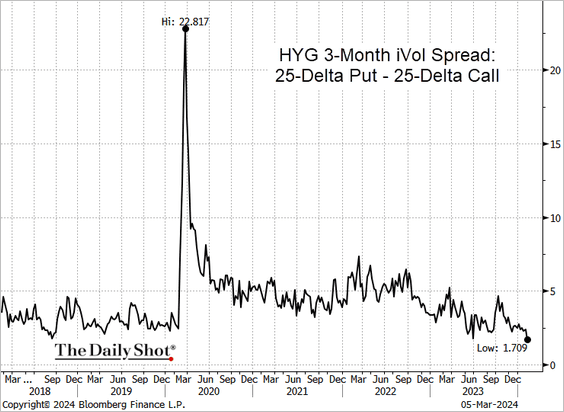 Source: @TheTerminal, Bloomberg Finance L.P.
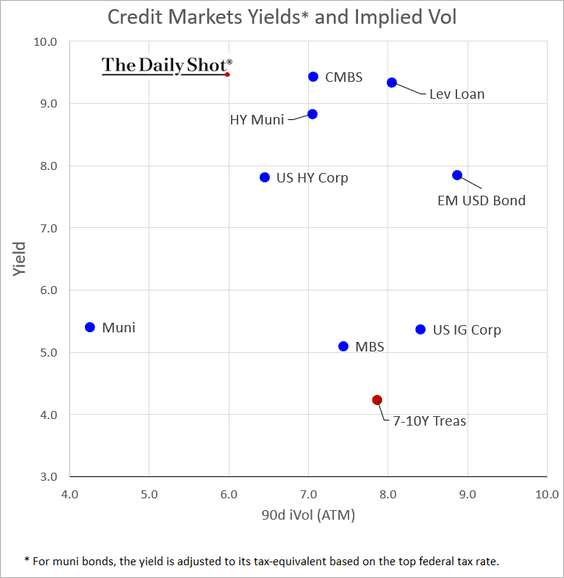
4. Here is a look at yields and implied volatility (projected performance vs. perceived risk).
Back to Index
Global Developments
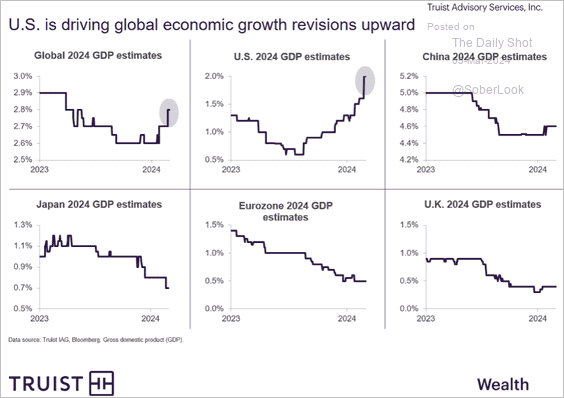
1. This chart shows the evolution of the 2024 GDP growth consensus estimates for select economies.
 Source: Truist Advisory Services
2. The semiconductor cycle is improving after contracting over the past two years.
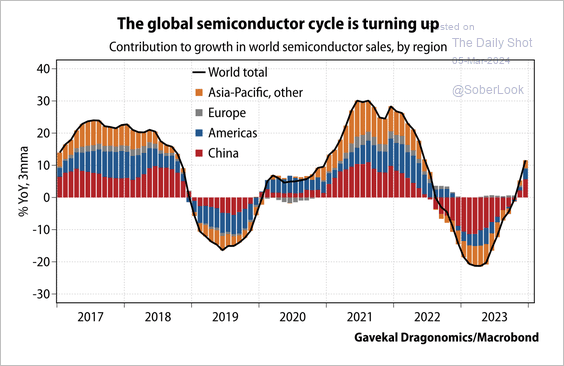 Source: Gavekal Research
• China has added more chip capacity than the rest of the world.
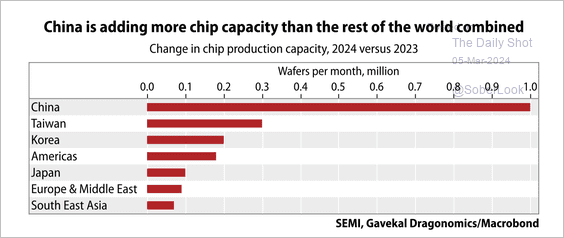 Source: Gavekal Research
——————–
Food for Thought
1. Gaming revenues (US and global):
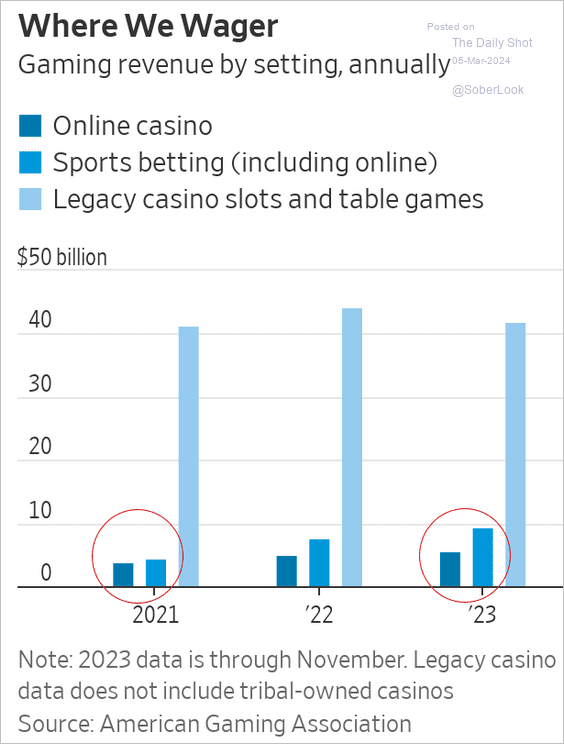 Source: @WSJ Read full article
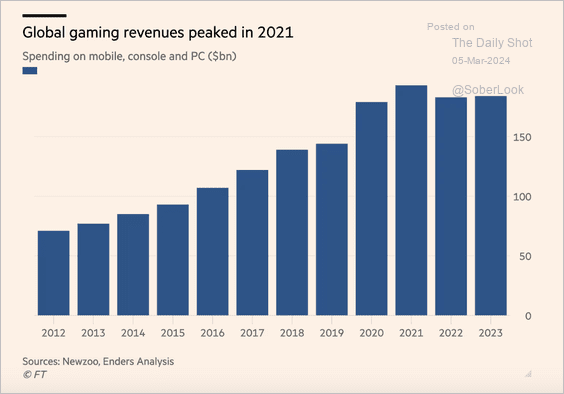 Source: @financialtimes Read full article
——————–
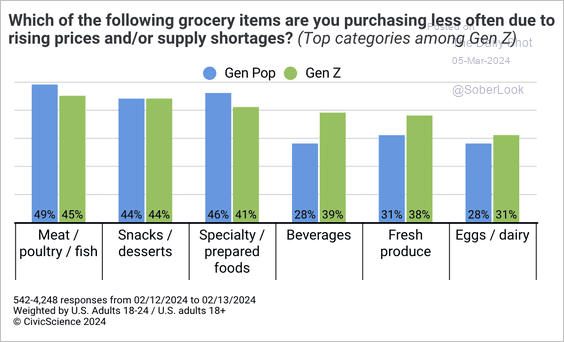
2. Gen-Z grocery shopping preferences:
 Source: @CivicScience Read full article
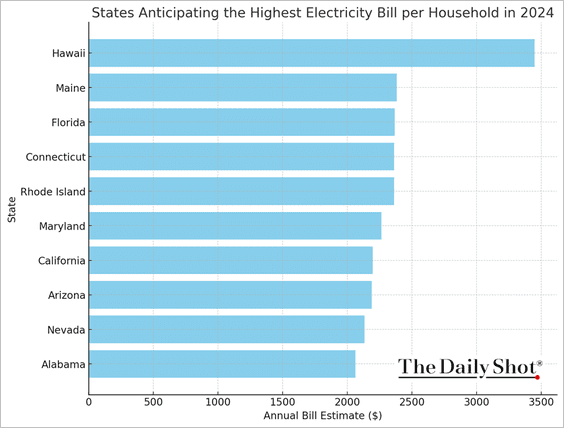
3. States anticipating the highest electricity bill per household this year:
 Source: Texas Electricity Ratings
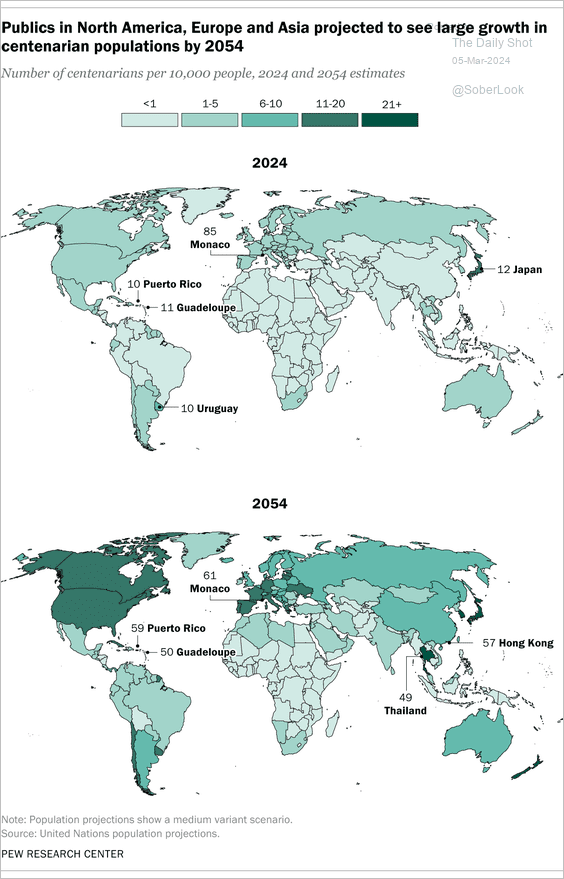
4. Centenarian population growth:
 Source: Pew Research Center Read full article
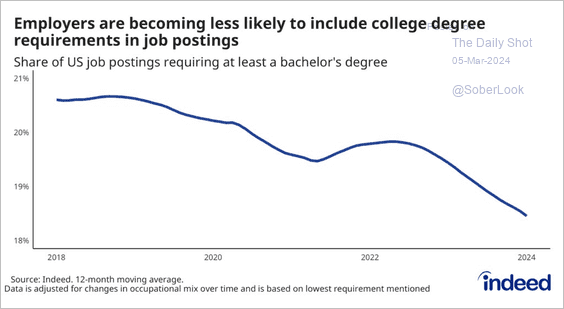
5. Fewer job postings require a college degree:
 Source: Indeed Read full article
6. Congressional job approval:
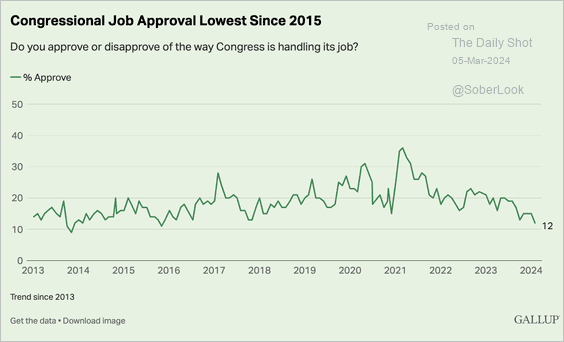 Source: Gallup Read full article
7. Lunar missions:
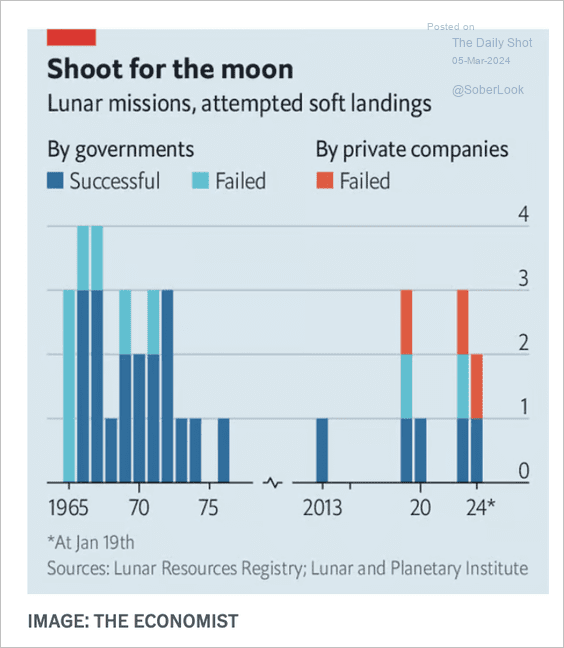 Source: The Economist Read full article
——————–
Back to Index