
The Daily Shot: 06-Mar-24
• The United States
• Canada
• The United Kingdom
• The Eurozone
• Asia-Pacific
• China
• Emerging Markets
• Commodities
• Energy
• Equities
• Credit
• Rates
• Global Developments
• Food for Thought
The United States
1. The ISM Services PMI eased in February, signifying a deceleration in growth.
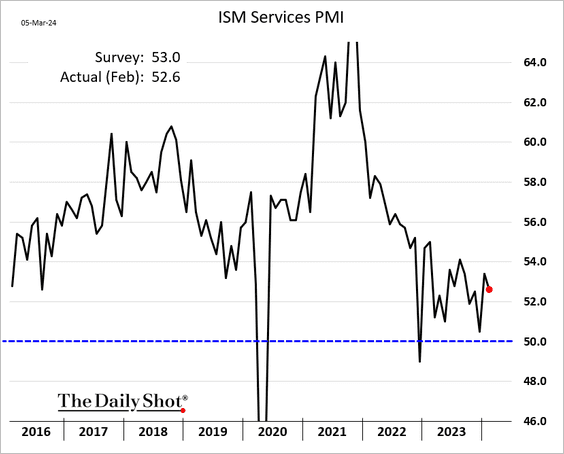
– The employment component drove the ISM PMI decline, dipping into contraction mode.
 Source: Oxford Economics
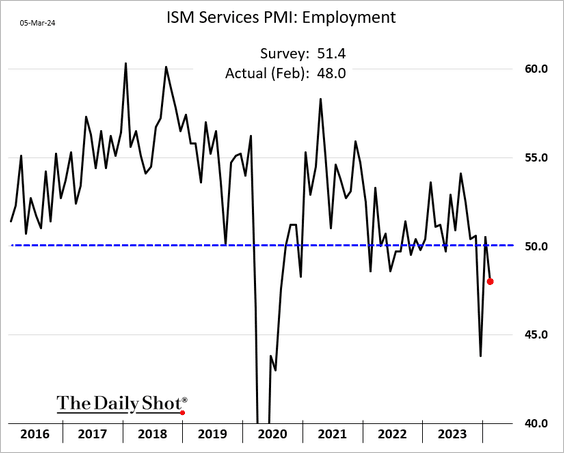
– Price pressures eased.

 Source: Reuters Read full article
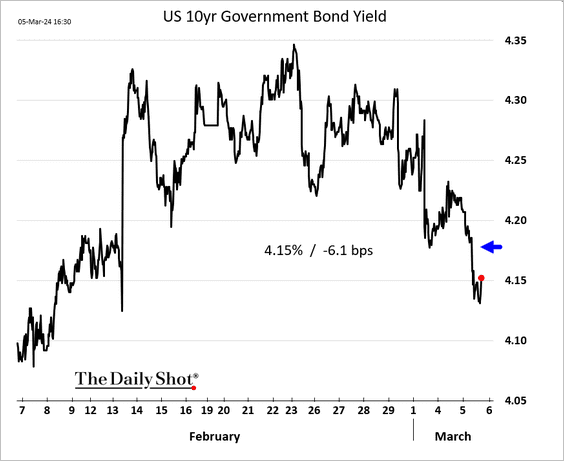
– Treasury yields fell in response to the ISM Services report, notably due to the employment and cost components.
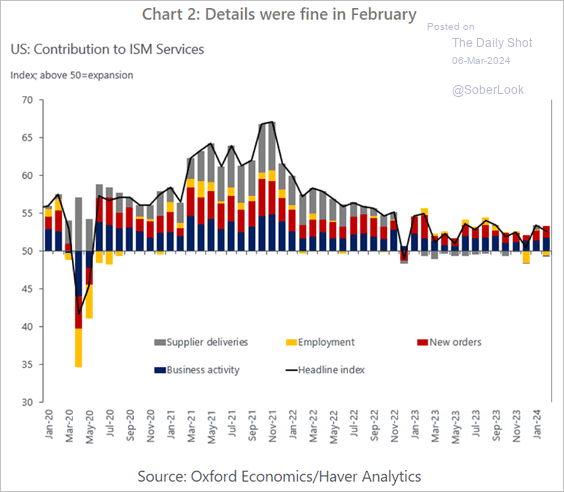
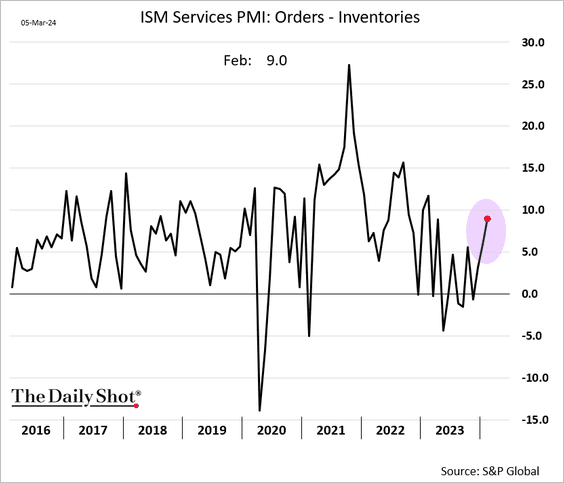
– However, the new orders index surprised to the upside.
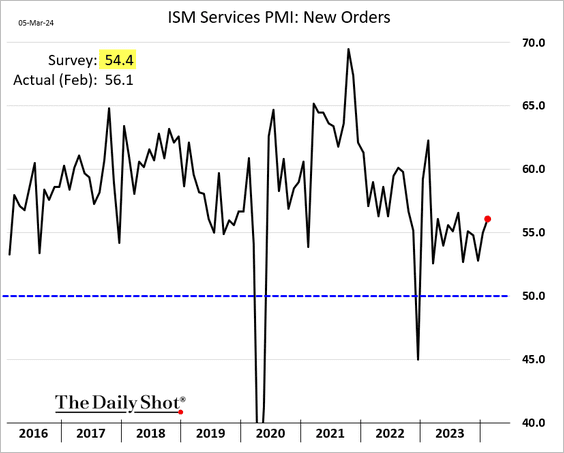
The orders-inventories spread points to stronger service-sector activity ahead.
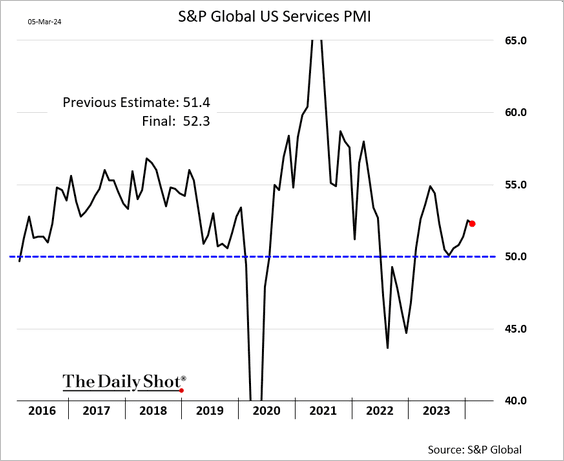
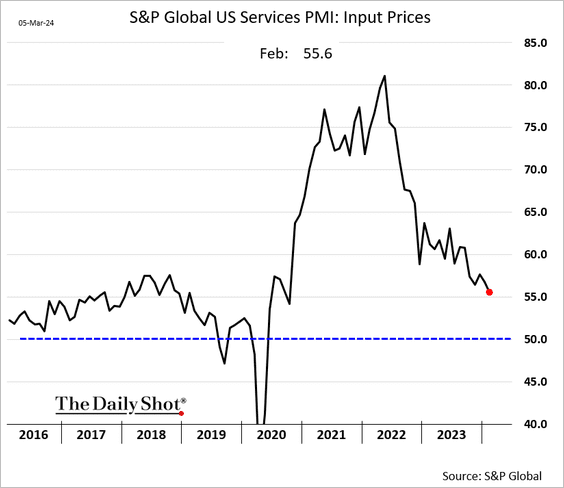
• A similar report from S&P Global also signaled a slight moderation in services growth.
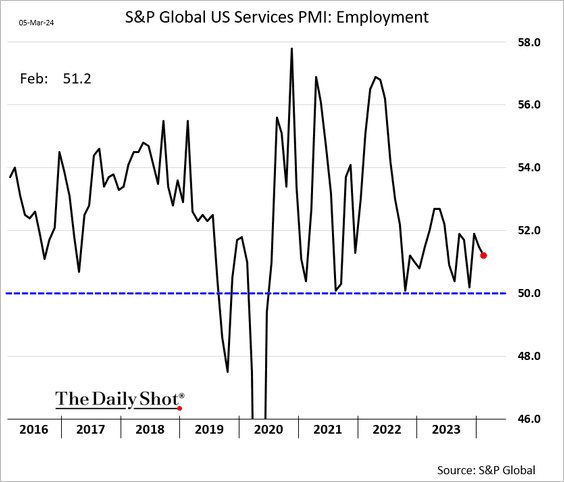
– But the employment sub-index remained in expansion mode.
– S&P Global’s report confirmed moderating input inflation for services firms.
——————–
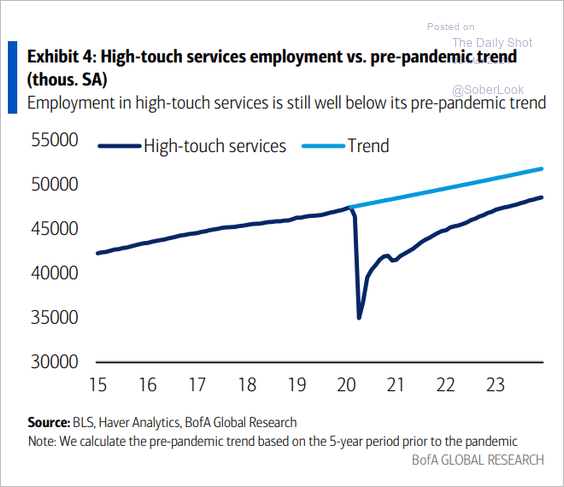
2. Next, we have a couple of updates on the labor market.
• Employment in “high-touch” services remains well below its pre-pandemic trend.
 Source: BofA Global Research
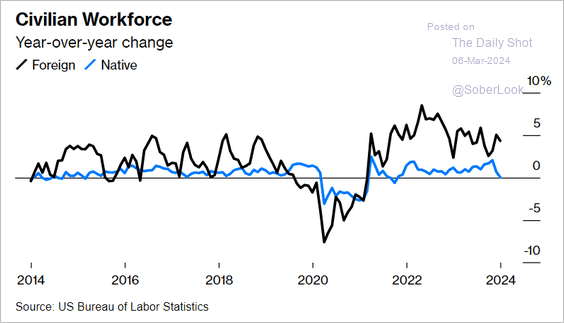
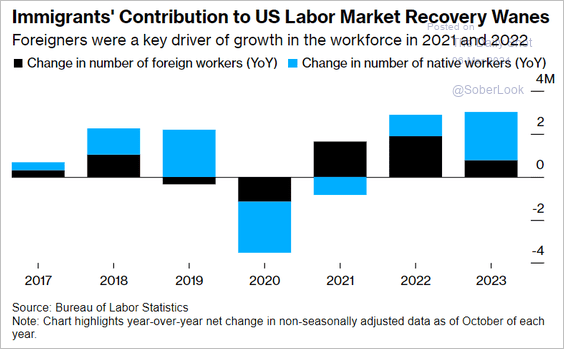
• Companies are increasingly reliant on foreign-born workers to meet their staffing needs (2 charts).
 Source: @BW Read full article
 Source: @economics Read full article
——————–
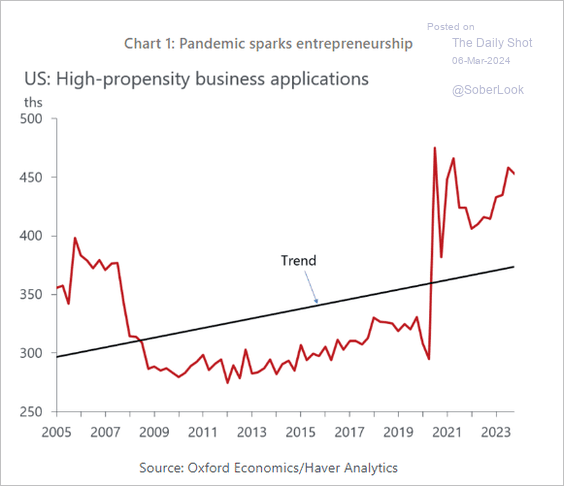
3. Business formations remain elevated.
 Source: Oxford Economics
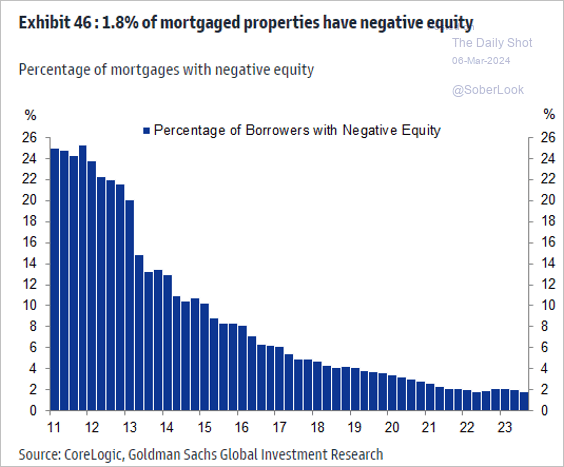
4. Very few residential properties are currently under negative equity.
 Source: Goldman Sachs; @MikeZaccardi
Back to Index
Canada
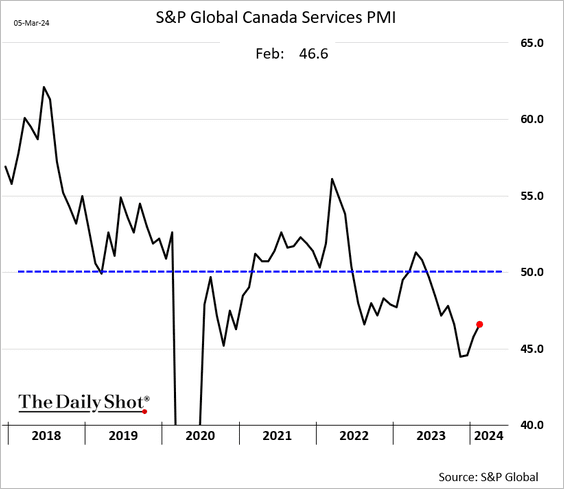
1. Services activity remains in contraction territory.
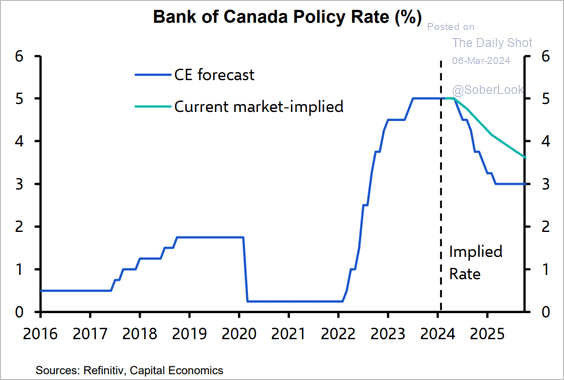
2. Capital Economics expects rapid BoC rate cuts later this year.
 Source: Capital Economics
Back to Index
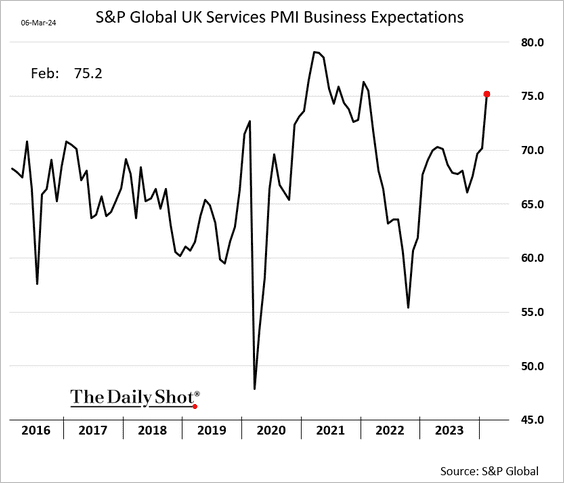
The United Kingdom
1. Outlook among UK service firms is increasingly upbeat.
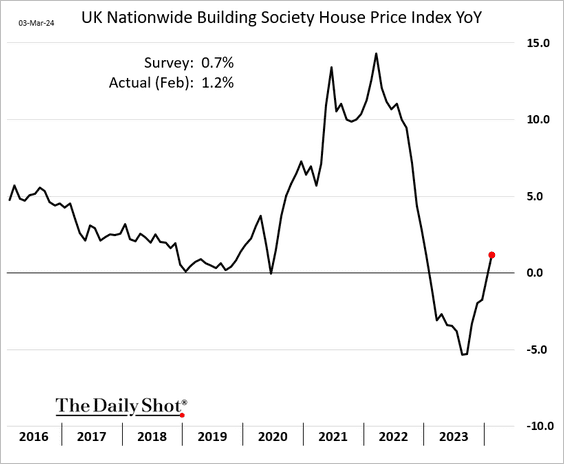
2. Home prices are rebounding.
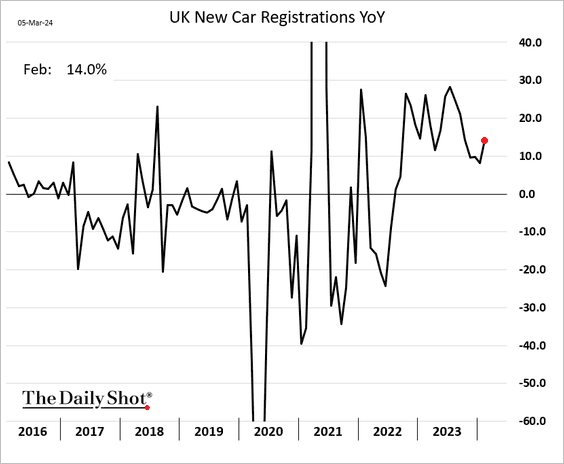
3. New car registrations last month were 14% higher compared to the same period in 2023.
Back to Index
The Eurozone
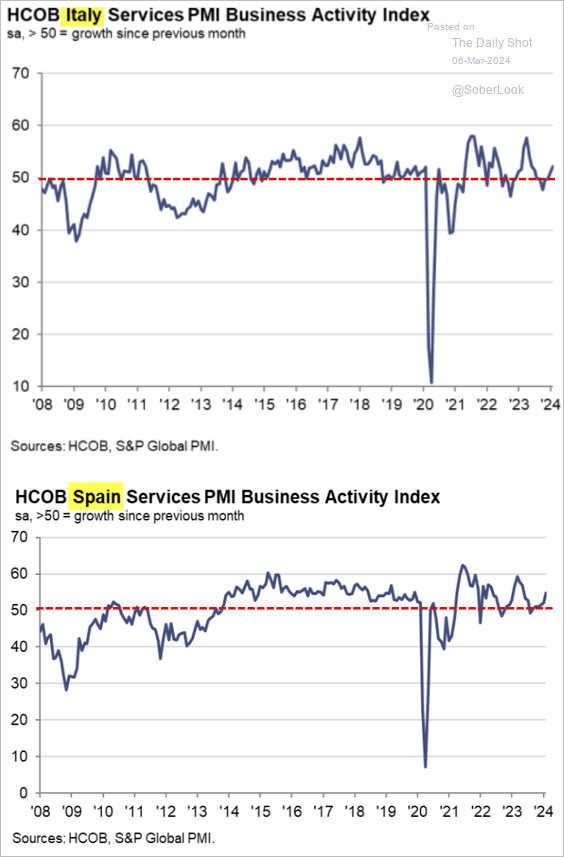
1. The euro-area services sector is growing again.
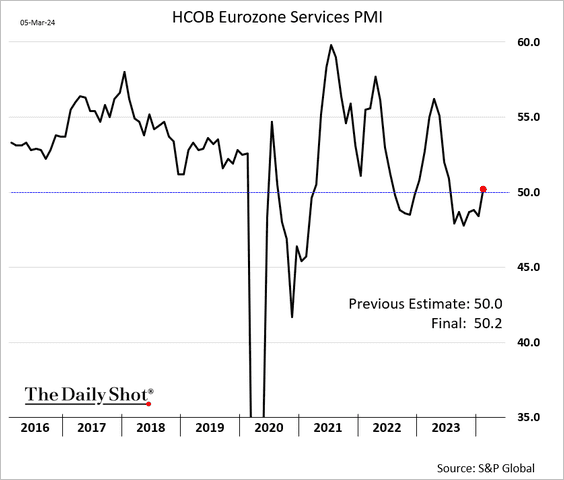
Activity in Spain and Italy accelerated last month.
 Source: S&P Global PMI
——————–
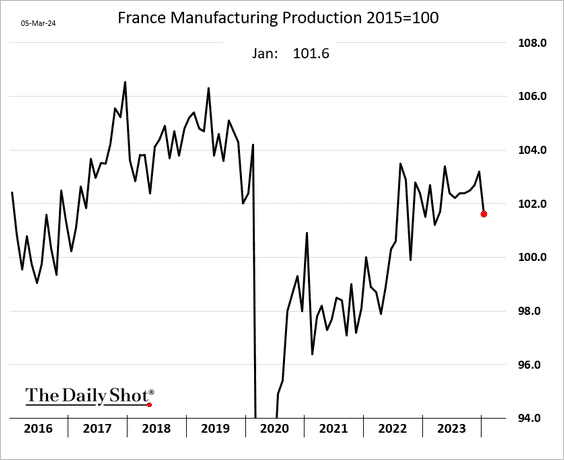
2. French manufacturing output tumbled in January.
Back to Index
Asia-Pacific
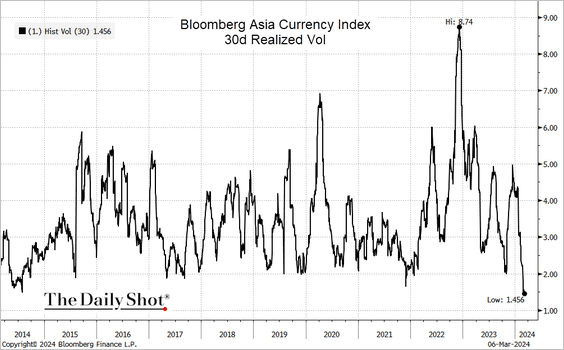
1. The volatility in Asian currencies has collapsed.
 Source: @TheTerminal, Bloomberg Finance L.P.; h/t Robert Fullem
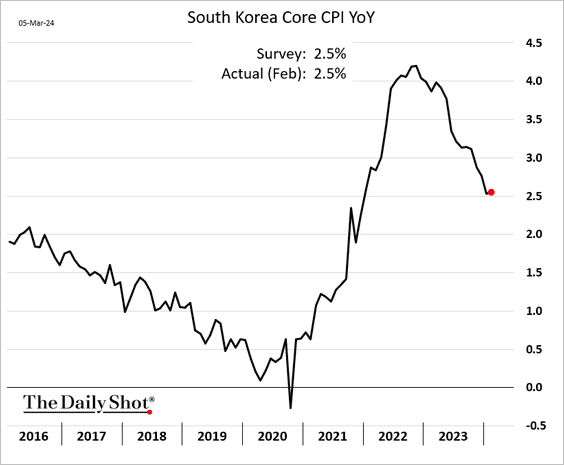
2. South Korea’s core inflation held steady last month.
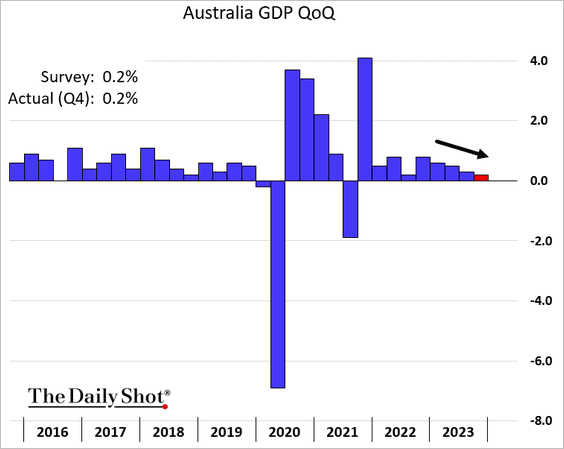
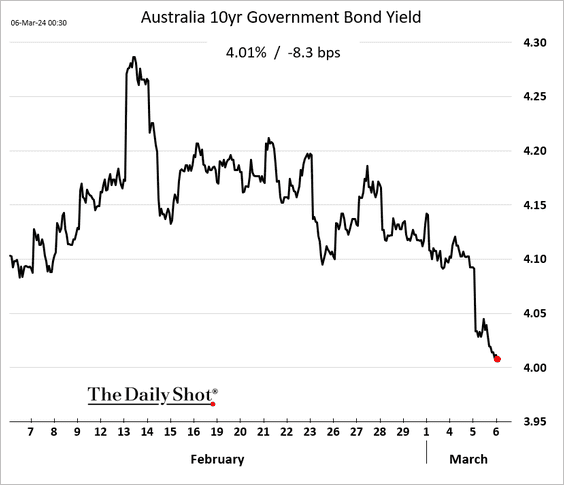
3. Australia’s GDP growth slowed further last quarter.
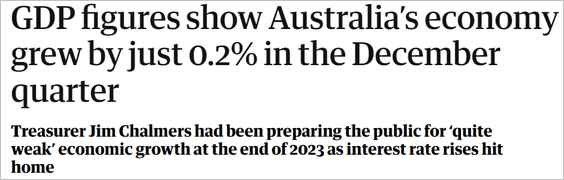 Source: The Guardian Read full article
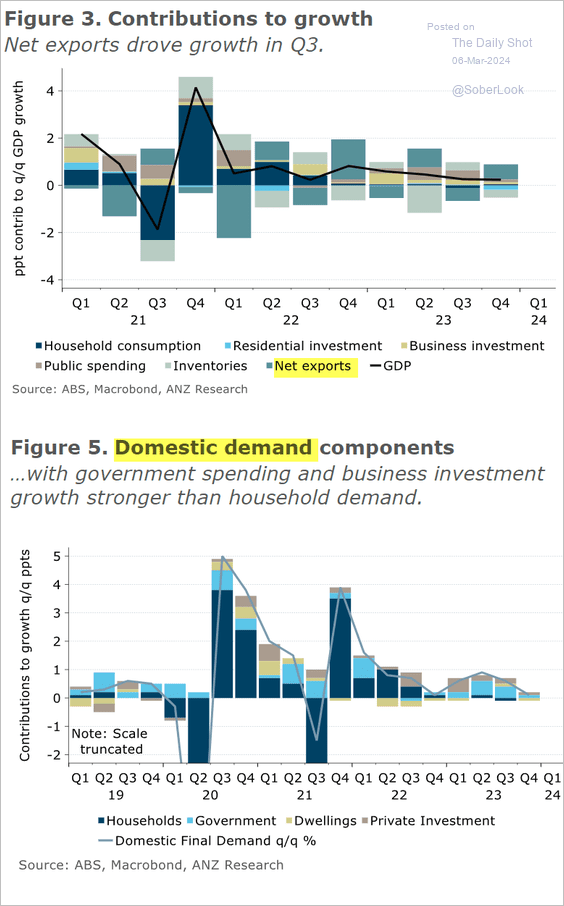
• Growth was driven by net exports, with domestic demand barely expanding. Consumer spending has been roughly flat for several quarters.
 Source: @ANZ_Research
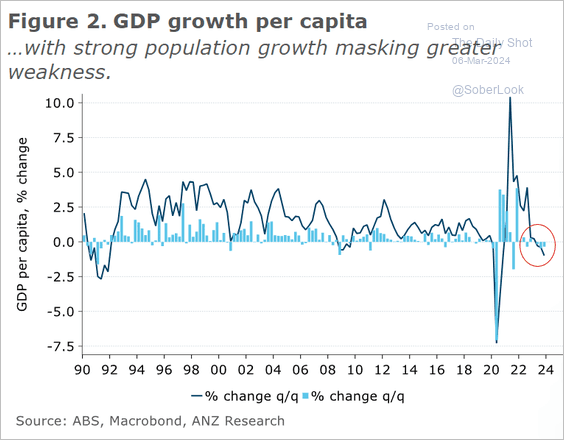
• The GDP growth per capita is falling.
 Source: @ANZ_Research
• Bond yields declined in response to the GDP report.
Back to Index
China
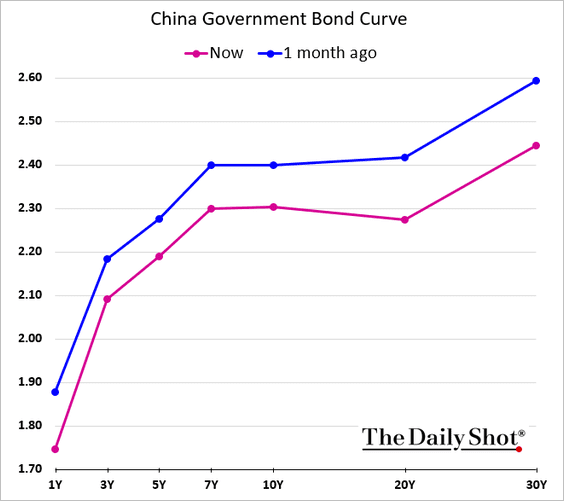
1. Will the PBoC keep liquidity tight?
The State Council of the People’s Republic of China: – We will reform and refine monetary and credit supply mechanisms, and employ as needed a combination of quantitative and pricing approaches, like required reserve ratios and interest rates, to guide financial institutions in increasing credit supply and bringing down the cost of borrowing, ensure targeted and efficient support for the real economy, and avoid funds circulating within the financial sector without entering the real economy or being diverted out of the real economy.
As a result, we could see further flattening in the yield curve.
2. Domestic-listed ETFs experienced massive inflows orchestrated by Chinese regulators (via state-owned funds or institutions) to stop the financial market rout.
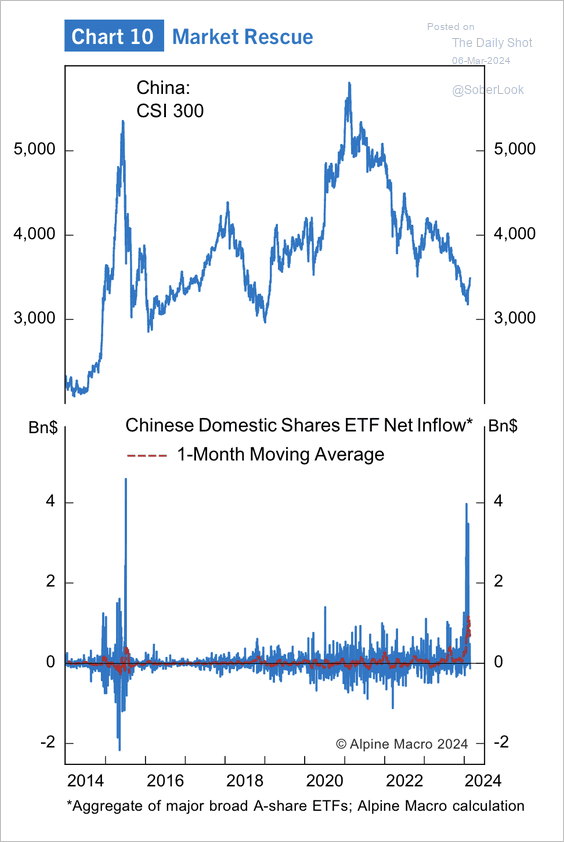 Source: Alpine Macro
3. The PBoC’s balance sheet has expanded via liquidity facilities and other lending facilities.
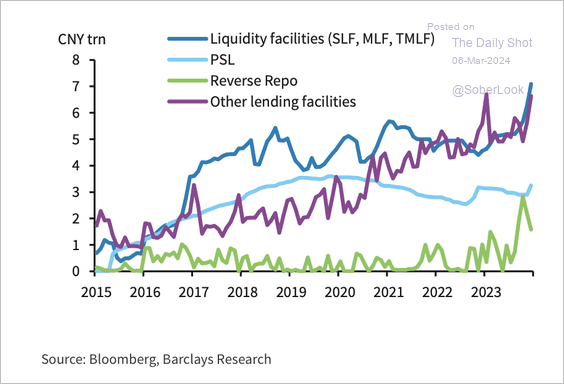 Source: Barclays Research
• There has been an uptick in narrow money supply in January.
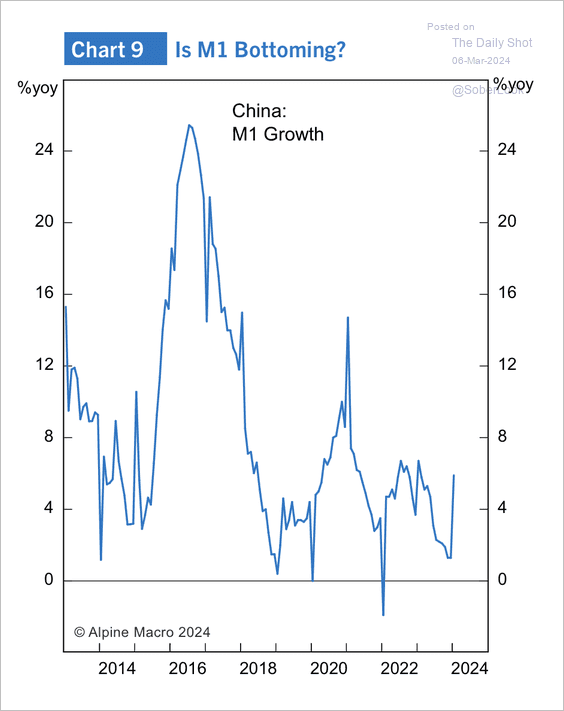 Source: Alpine Macro
——————–
4. Hong Kong’s monetary authority relaxed decade-old lending curbs.
 Source: SCMP Read full article
Back to Index
Emerging Markets
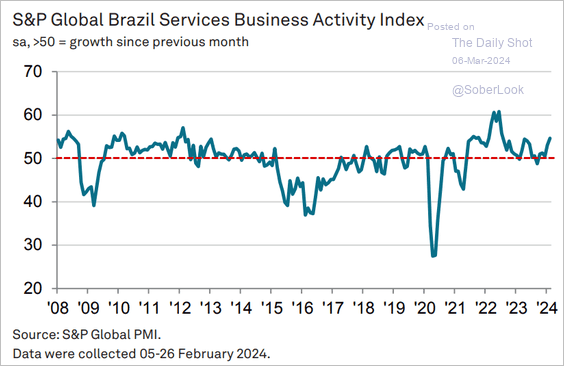
1. Brazil’s service sector reported faster growth last month.
 Source: S&P Global PMI
2. Here is a look at Argentina’s inflation and central bank policy rate.
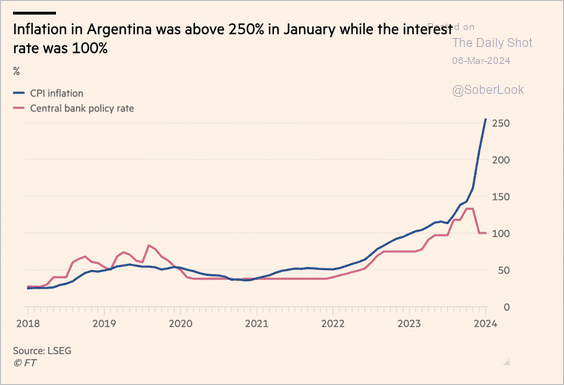 Source: @financialtimes Read full article
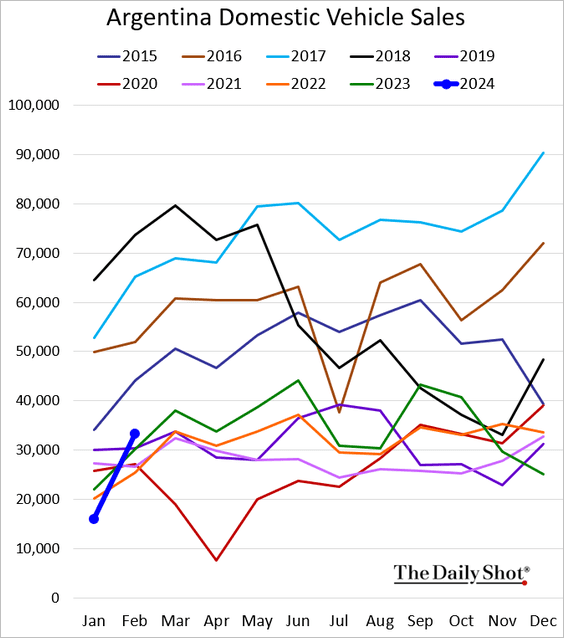
• Argenitna’s vehicle sales jumped last month.
——————–
2. India’s derivatives market has exploded.
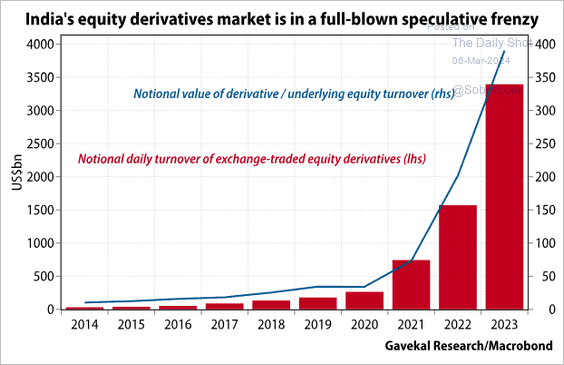 Source: Gavekal Research
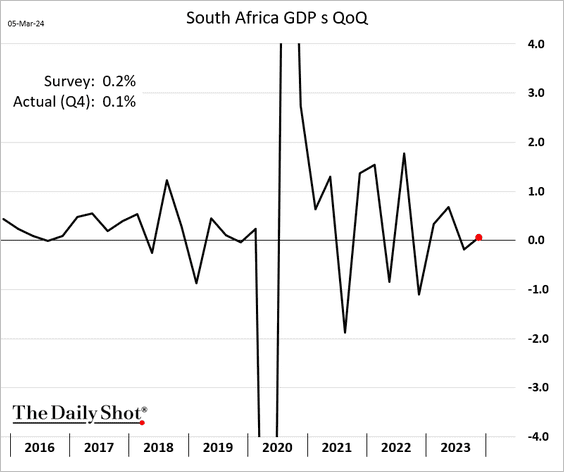
3. South Africa’s economy barely grew last quarter.
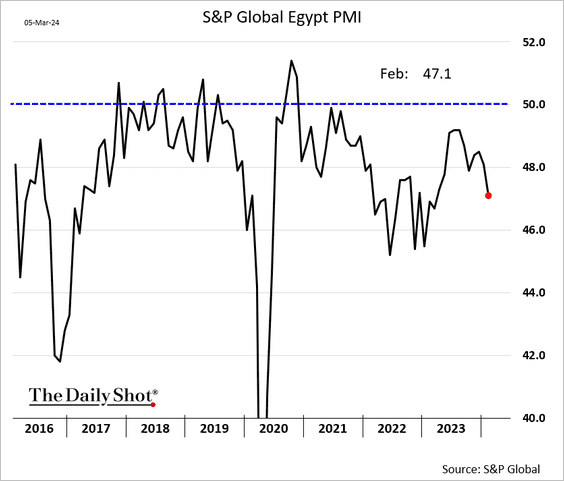
4. Egypt’s business activity is crashing again.
5. Manufacturing activity as a share of GDP is rising in Saudi Arabia relative to EM peers.
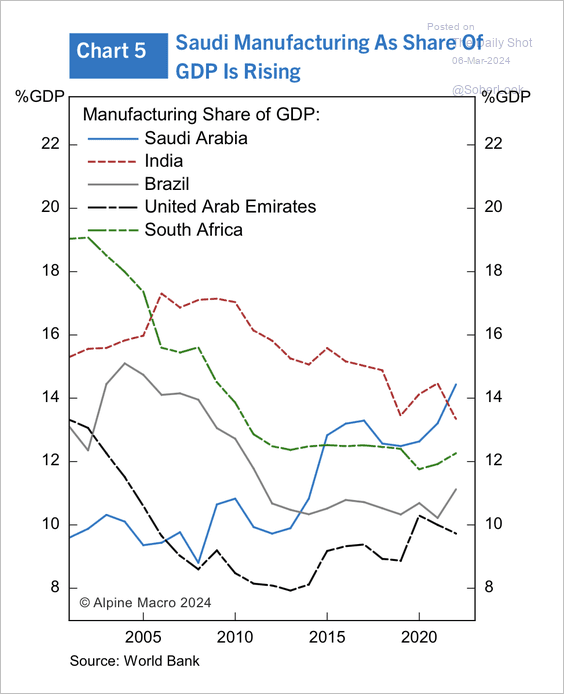 Source: Alpine Macro
6. EM-focused funds are seeing some outflows.
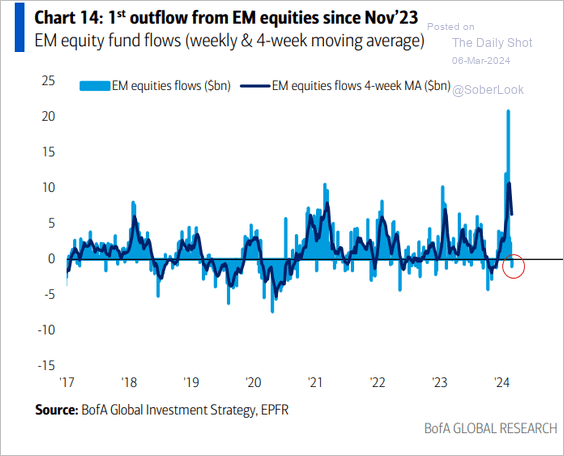 Source: BofA Global Research
7. Oxford Economics expects EM earnings growth to outpace DM this year, which could support equity market outperformance.
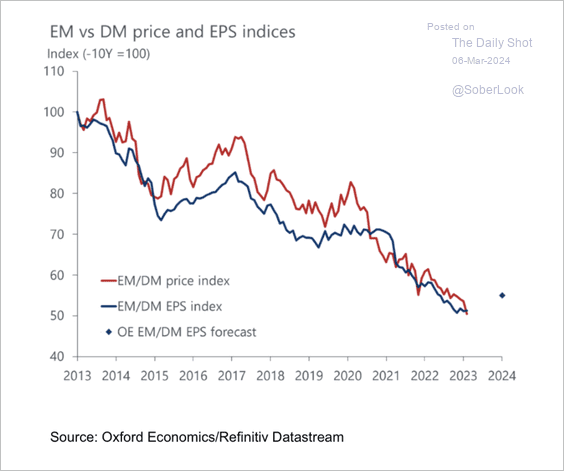 Source: Oxford Economics
8. Barclays’ EM carry basket continued to strengthen in recent months, which typically occurs during periods of low volatility. (2 charts)
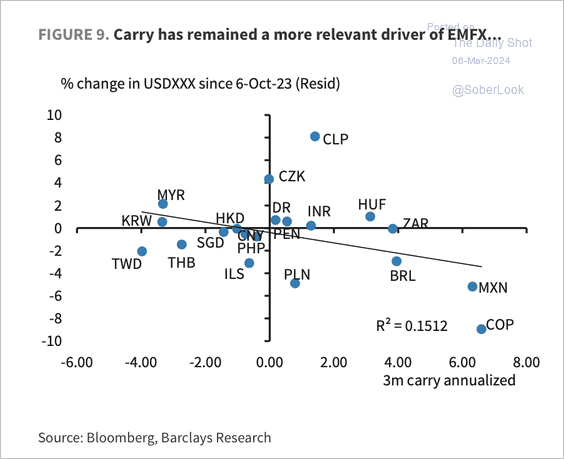 Source: Barclays Research
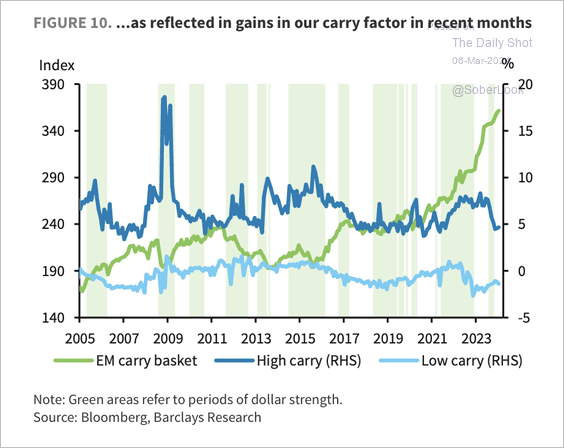 Source: Barclays Research
Back to Index
Commodities
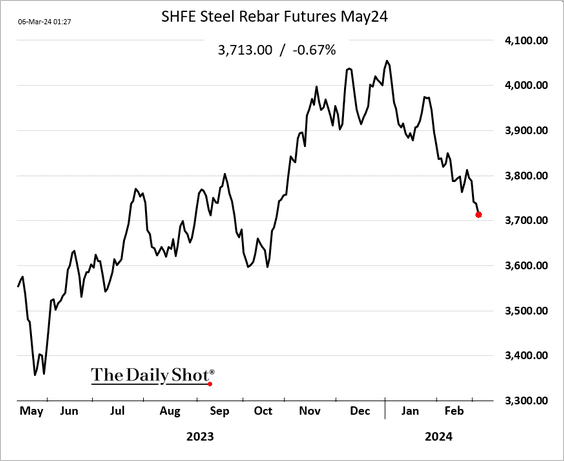
1. Steel prices in China have been rolling over.
2. Palm oil futures are rallying amid supply concerns.
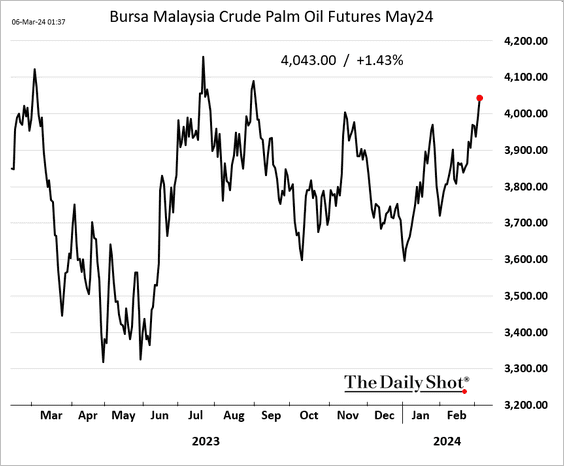
 Source: @markets Read full article
Back to Index
Energy
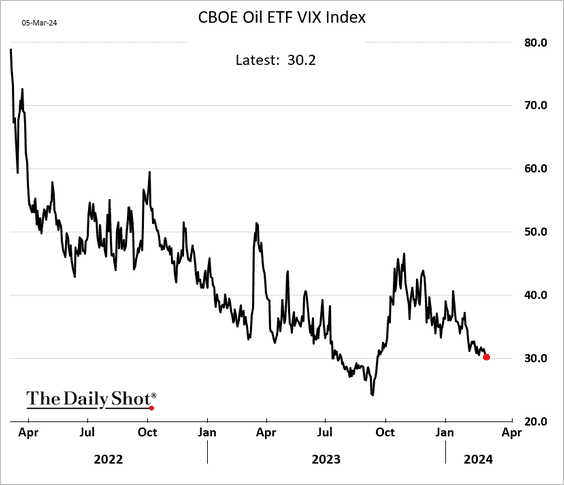
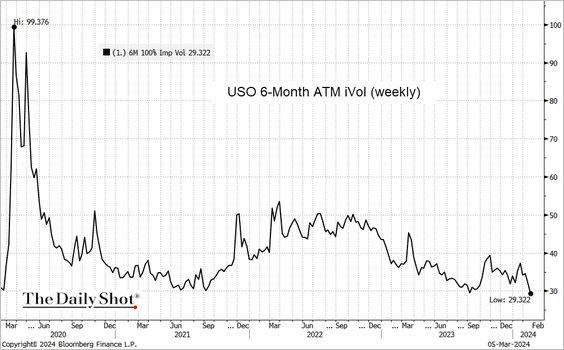
1. Crude oil implied volatility continues to trend lower (2 charts).
 Source: @TheTerminal, Bloomberg Finance L.P.
——————–
2. Canada’s oil exports are expected to surge following the expansion of the Trans-Mountain pipeline.
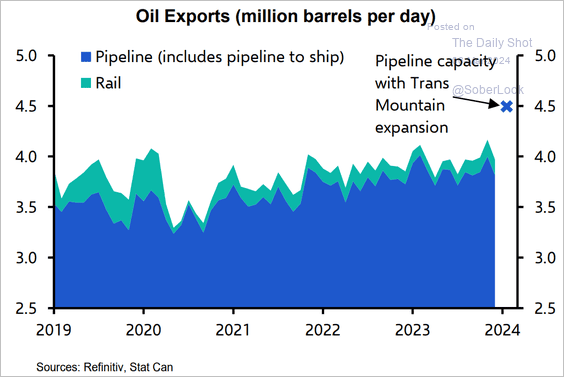 Source: Capital Economics
3. Who imports Russian LNG?
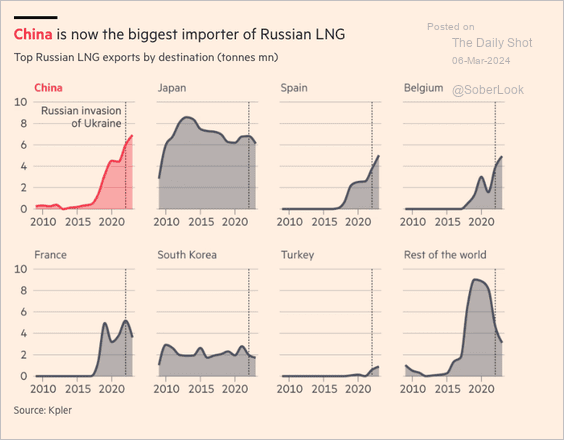 Source: @financialtimes Read full article
Back to Index
Equities
1. The market saw a healthy pullback on Tuesday as tech shares sold off.
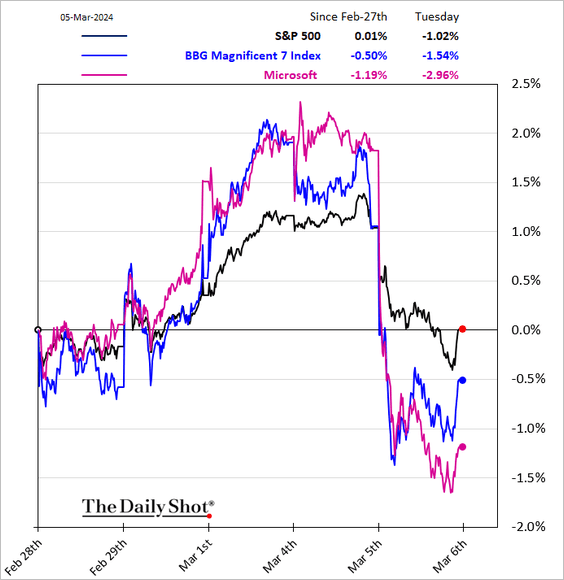
• The average S&P 500 stock outperformed the index.
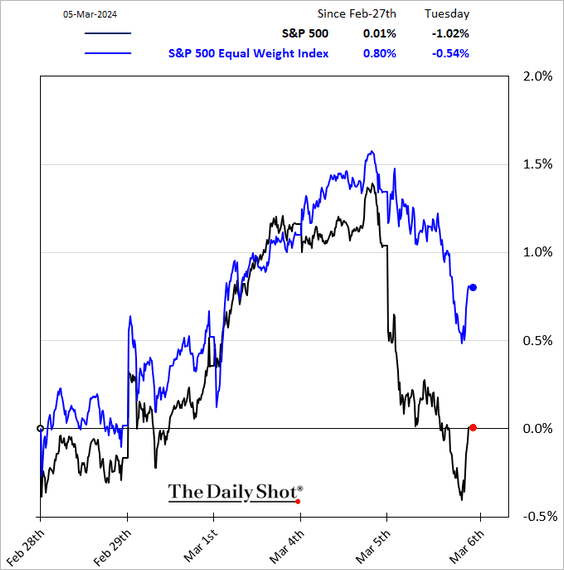
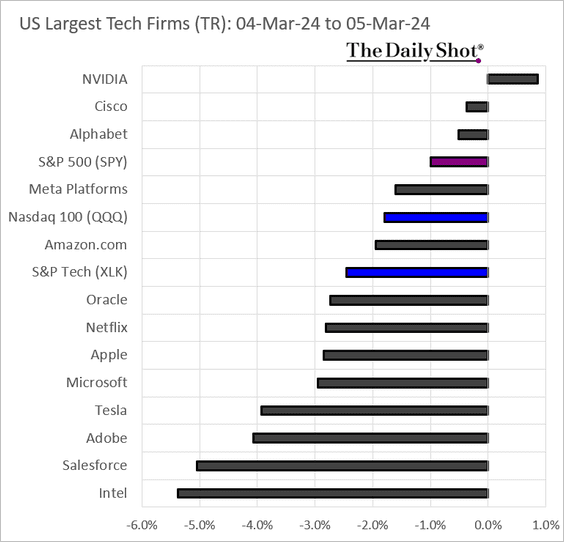
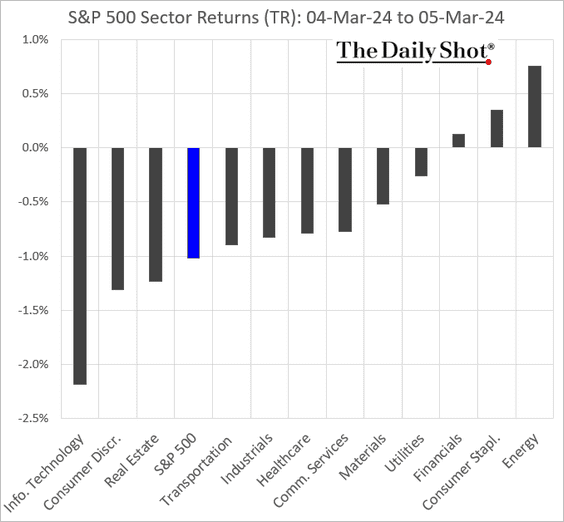
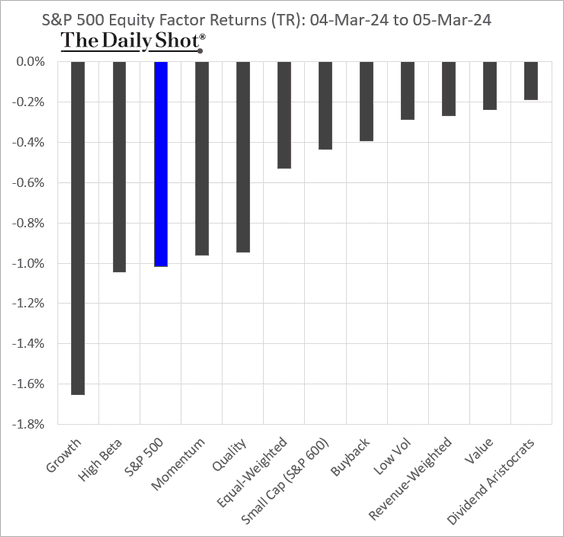
• Here is how various sectors and equity factors performed during Wednesday’s market downturn.
——————–
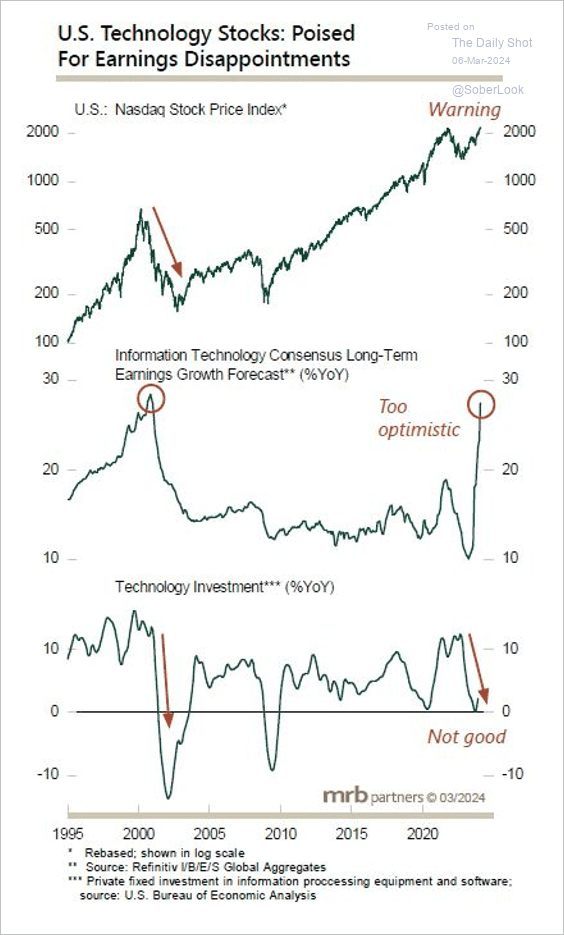
2. Analysts are very optimistic about US tech sector earnings growth.
 Source: MRB Partners
• When analysts are very bullish on long-term earnings growth, returns tend to be sub-par.
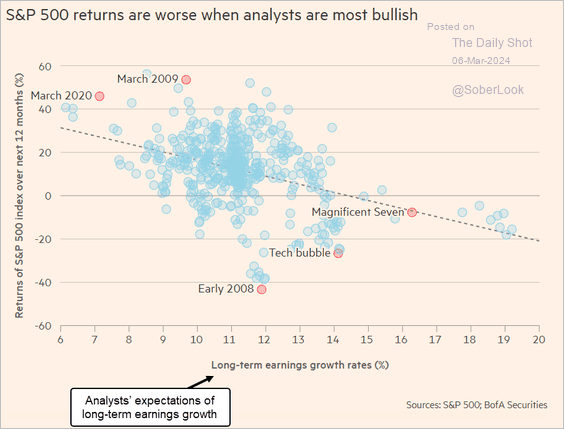 Source: @financialtimes Read full article
——————–
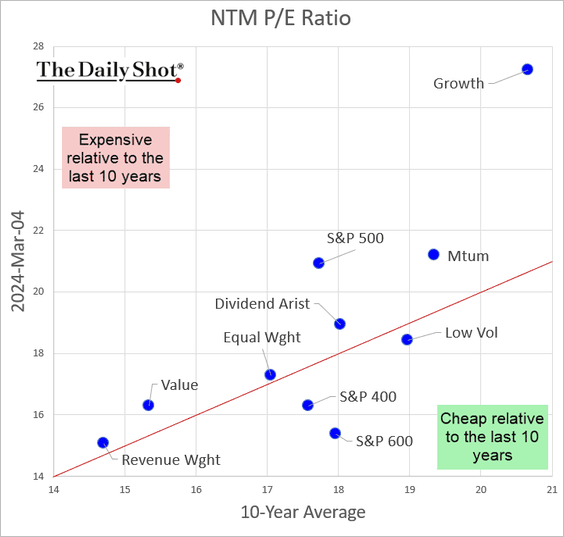
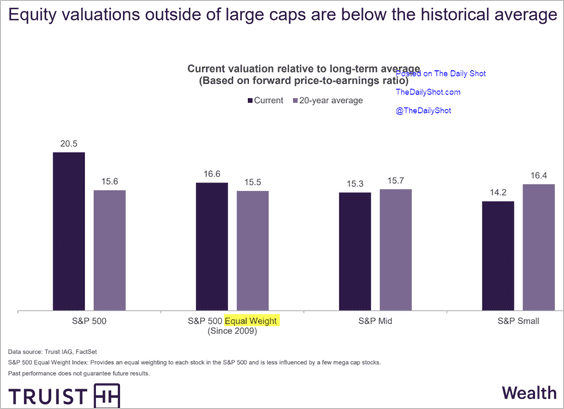
3. Here is a look at valuations (forward P/E ratios) relative to the past decade. Note that the equal-weight index is now above its historical P/E average.
• This chart compares valuations to the 20-year averages.
 Source: Truist Advisory Services
——————–
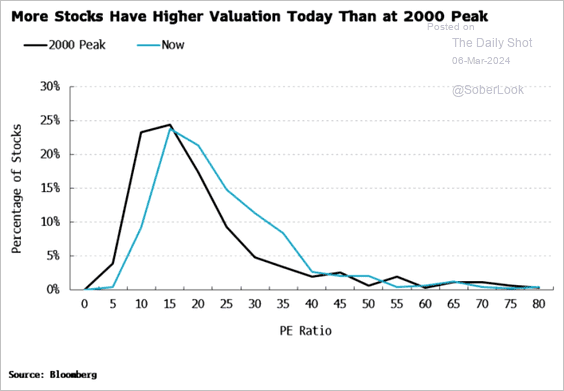
4. This chart shows the distribution of S&P 500 P/E ratios now and at the dot-com peak.
 Source: Simon White, Bloomberg Markets Live Blog
5. Valuations have been the main driver of US equity outperformance relative to other DMs over the past year or so.
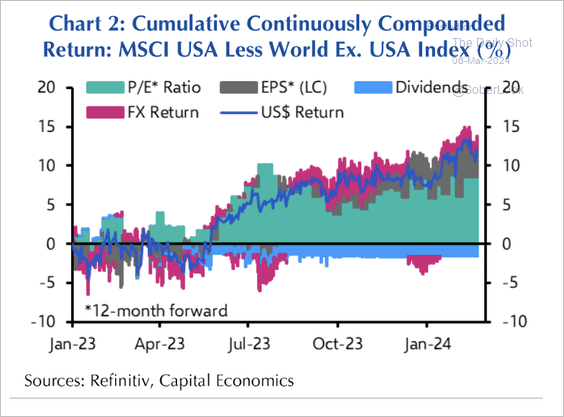 Source: Capital Economics
6. Next, we have the evolution of the S&P 500 composition by broad sectors.
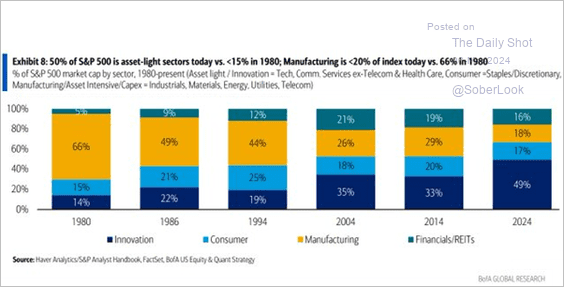 Source: BofA Global Research
7. Retail flows have been strong this year.
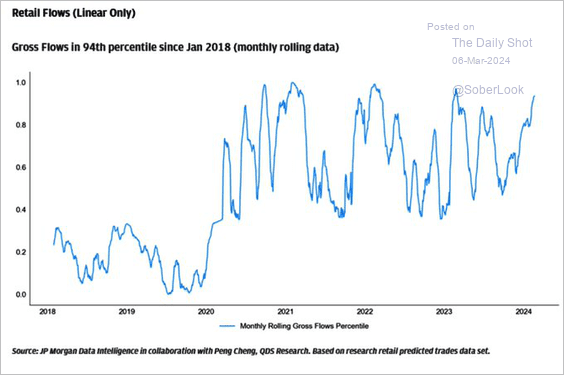 Source: JP Morgan Research; @WallStJesus
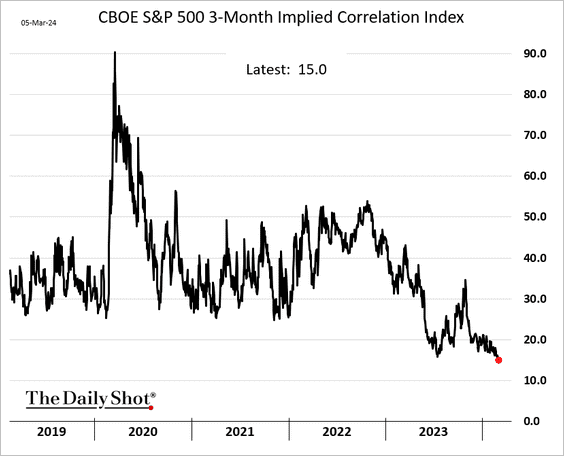
8. The S&P 500 implied correlation (among member stocks) is at multi-year lows.
9. This chart shows the largest active ETF issuers in the US.
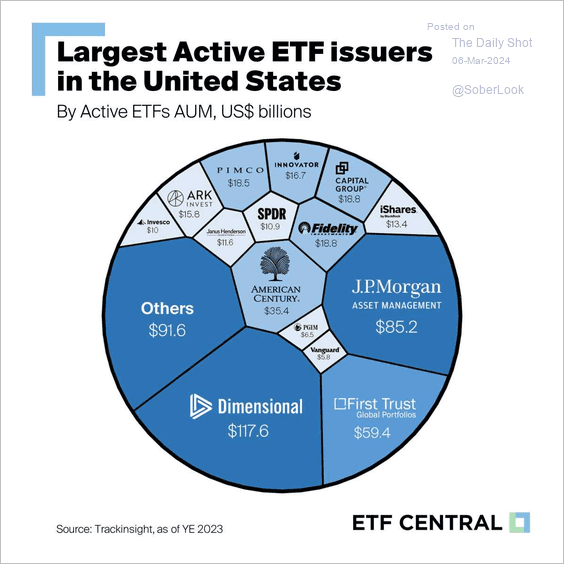 Source: ETF Central
Back to Index
Credit
1. Investment-grade credit upgrades outpaced downgrades last month.
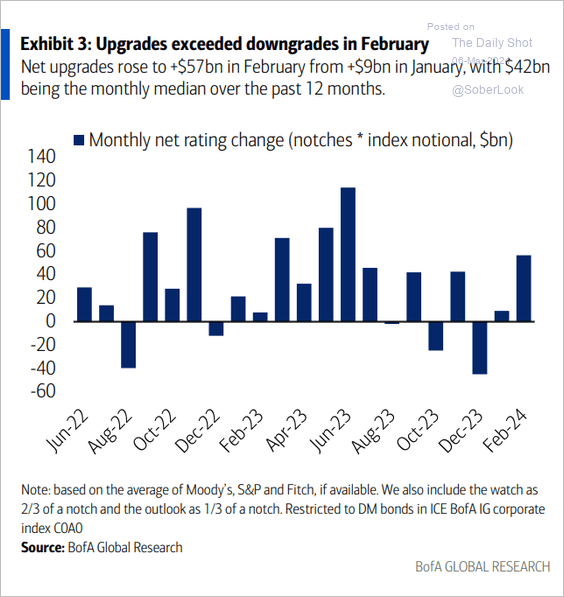 Source: BofA Global Research
2. Bank loan funds are seeing robust inflows.
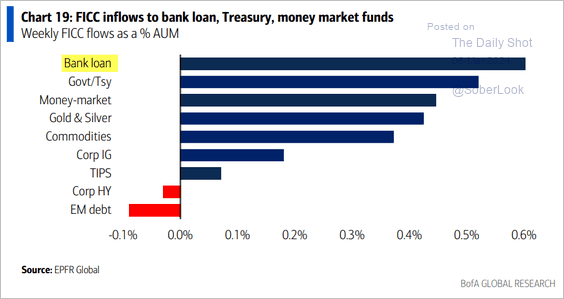 Source: BofA Global Research
3. Institutions want more private credit. Is the sector getting crowded?
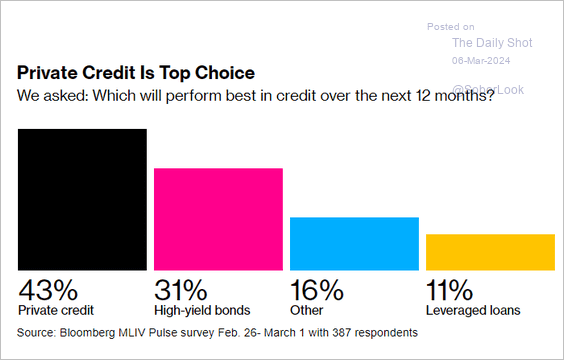 Source: @markets Read full article
4. Investors remain concerned about commercial real estate.
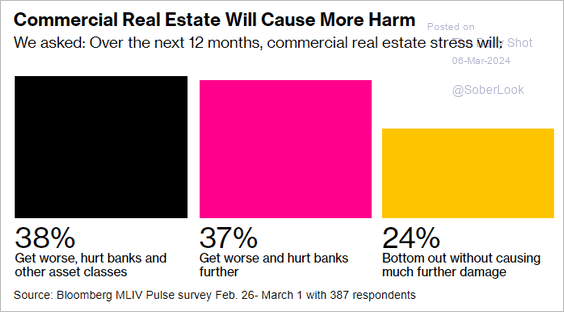 Source: @markets Read full article
5. Munis look rich relative to Treasuries (2 charts).
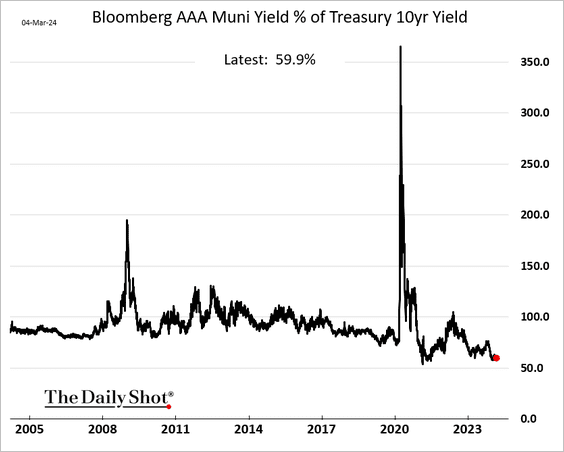
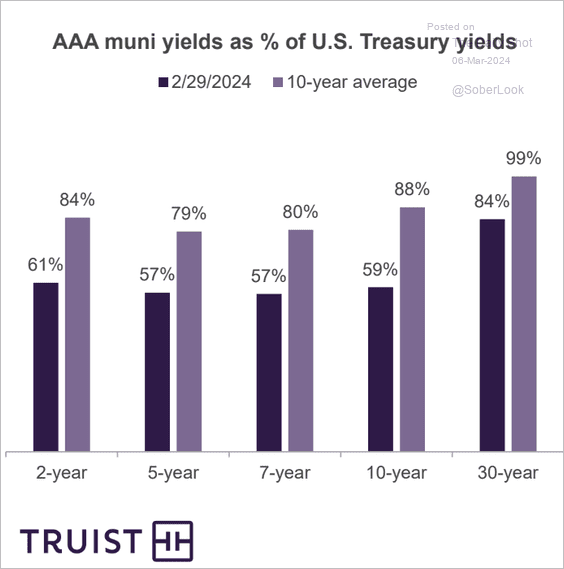 Source: Truist Advisory Services
——————–
6. A growing number of small US colleges are financially stressed.
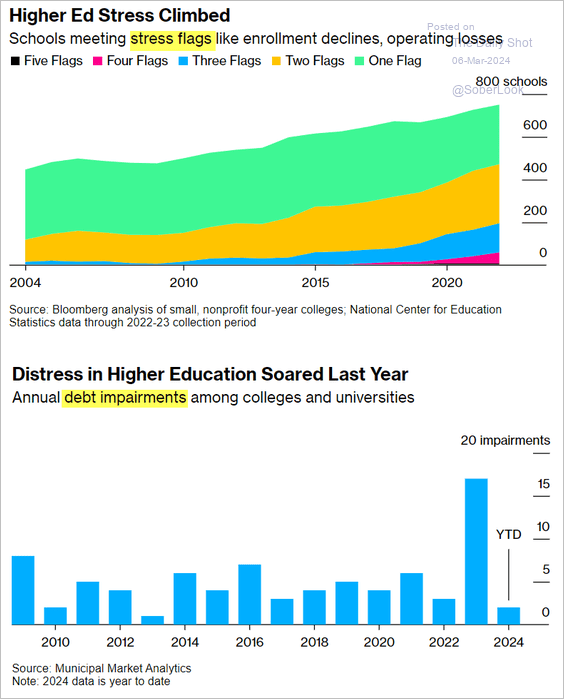 Source: @markets Read full article
Back to Index
Rates
1. The Treasury curve has been inverted for a while (2 charts).
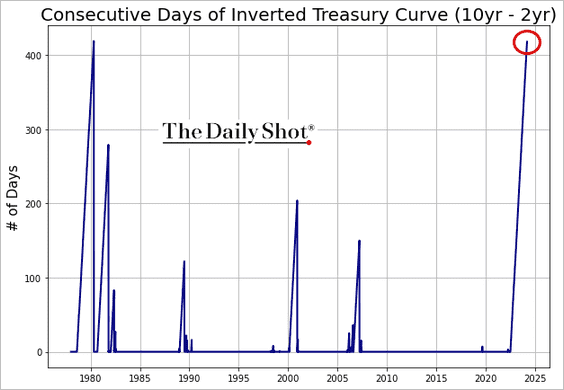
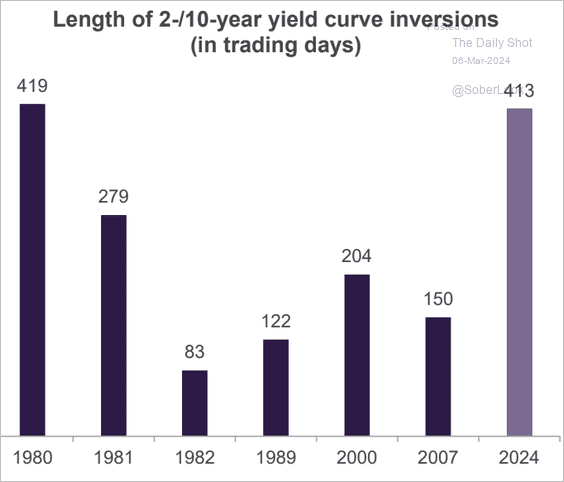 Source: Truist Advisory Services
——————–
2. The Fed’s balance sheet reduction of its Mortgage-Backed Securities holdings has been sluggish due to a spike in mortgage rates that stifled refinancing activities. Consequently, MBS now constitute a larger share of the central bank’s securities portfolio.
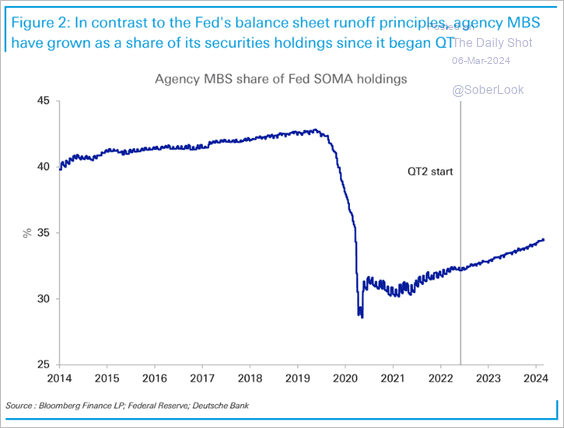 Source: Deutsche Bank Research
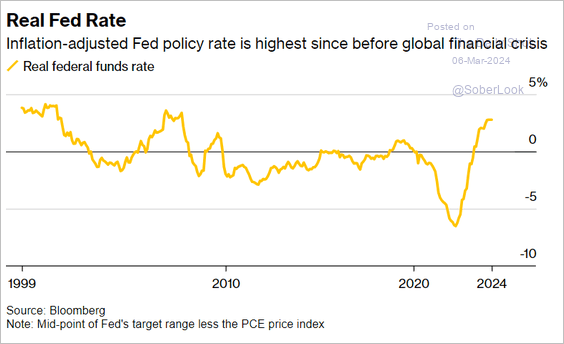
3. The NY Fed’s latest estimate of R*, now at its lowest in a decade, …
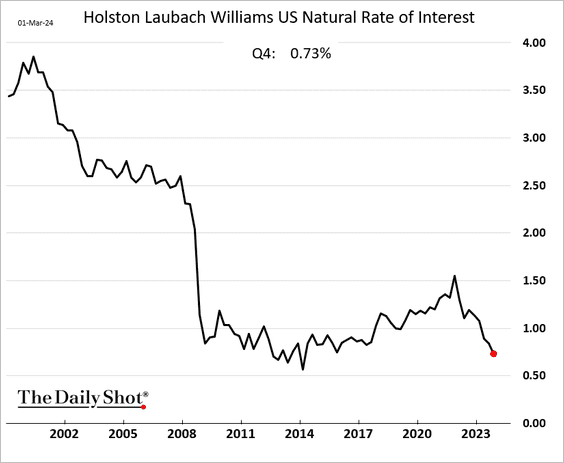
… alongside the highest real fed funds rate since before the financial crisis, points to exceptionally tight current monetary policy.
 Source: @economics Read full article
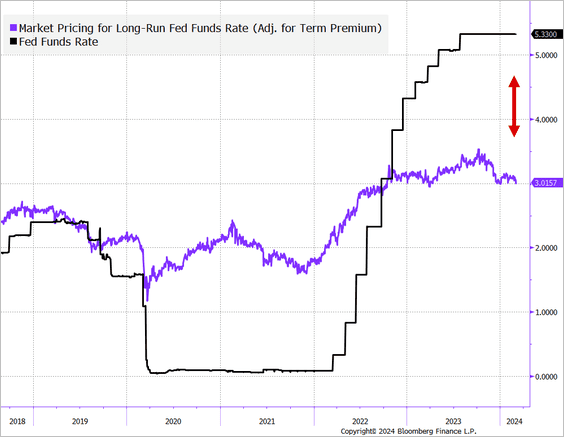
The market also sees the Fed’s policy as tight. This chart shows the market expectations of the long-run nominal fed funds rate running well below the current policy rate.
Back to Index
Global Developments
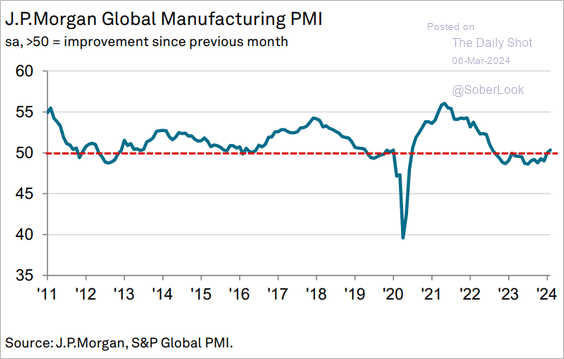
1. Global manufacturing activity is back in growth territory.
 Source: S&P Global PMI
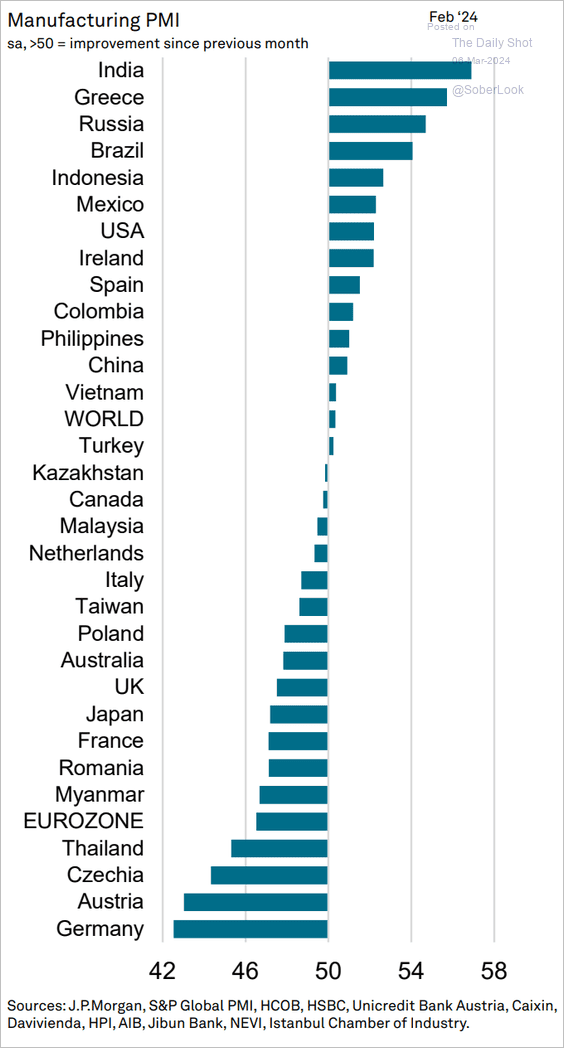
• Here is a look at February’s manufacturing PMIs by country.
 Source: S&P Global PMI
• Below is the percentage of countries with PMIs in expansion territory.
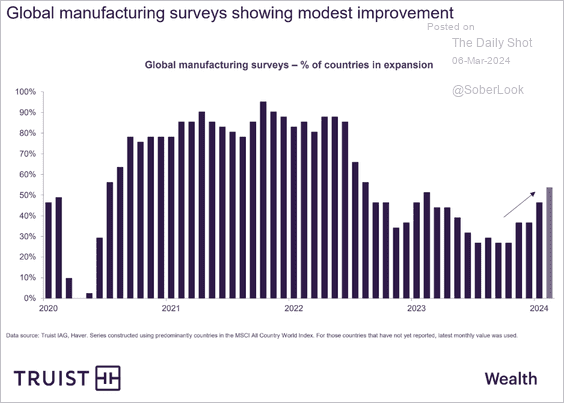 Source: Truist Advisory Services
——————–
2. Energy and health care M&A rebounded last year, but not enough to offset declines in tech and manufacturing.
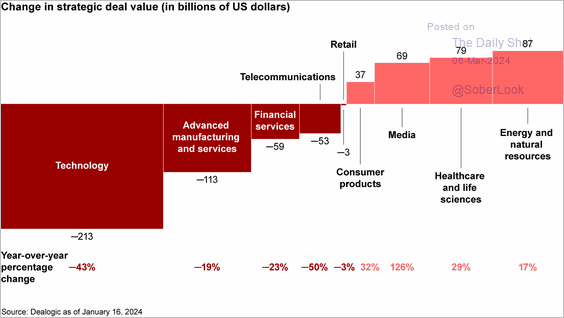 Source: Bain & Company Read full article
• Frequent deal acquirers remained active throughout the recent market rout.
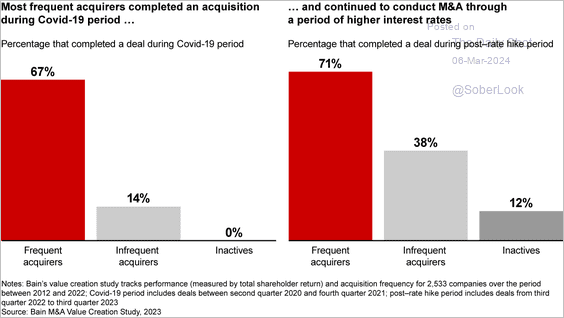 Source: Bain & Company Read full article
——————–
3. In the first six months of their rate-cutting cycle, DM central banks reduced rates three times on average.
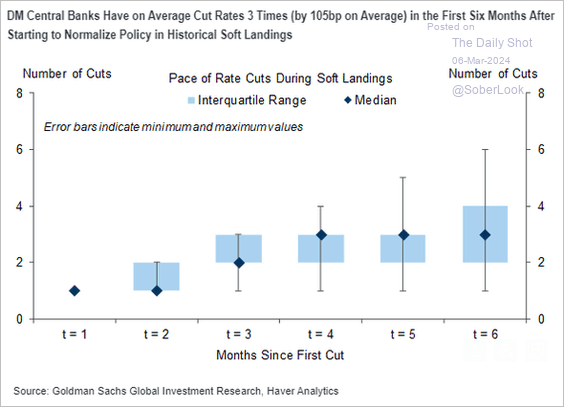 Source: Goldman Sachs; @MikeZaccardi
• Below is Goldman’s forecast for policy rate trajectories.
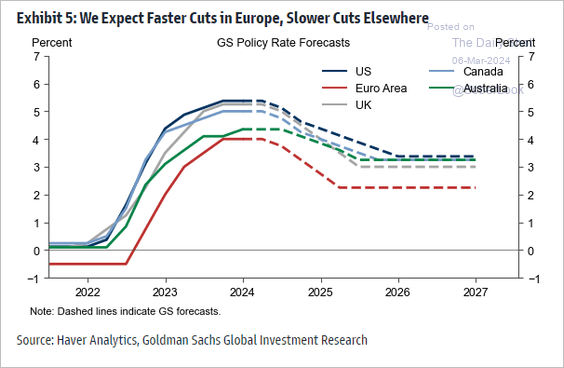 Source: Goldman Sachs; @MikeZaccardi
• Markets have scaled back expectations for DM rate cuts.
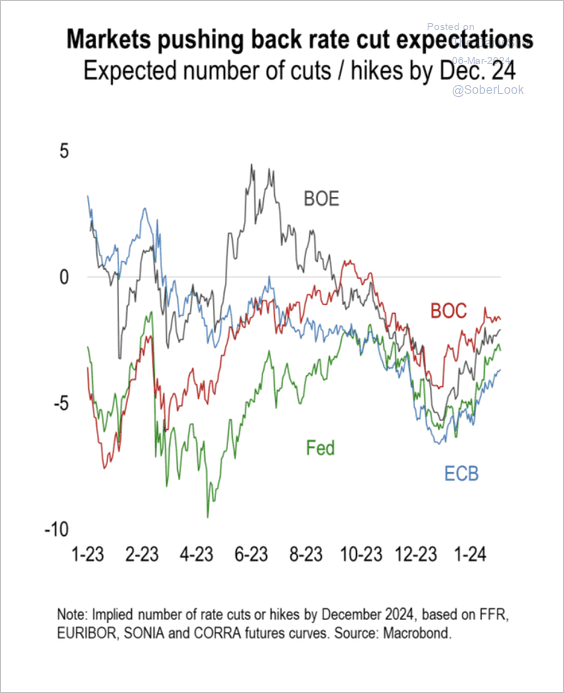 Source: Numera Analytics (@NumeraAnalytics)
——————–
4. Several advanced economies face declining working-age populations.
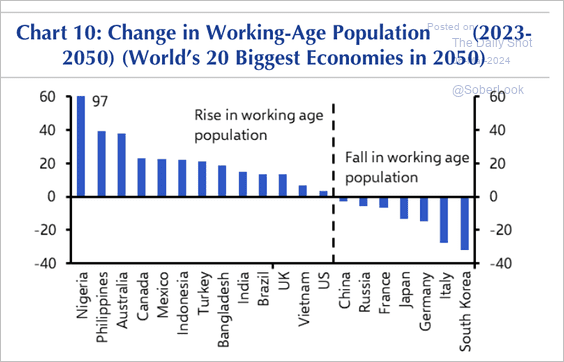 Source: Capital Economics
——————–
Food for Thought
1. Spending tax refunds:
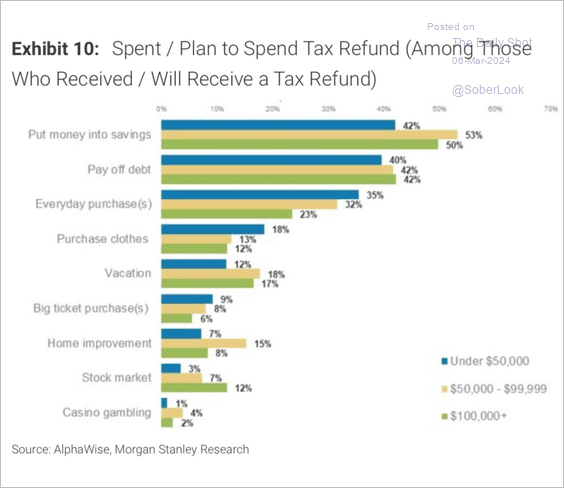 Source: Morgan Stanley Research; @carlquintanilla
2. US debt-to-GDP ratios by sector (2 charts):
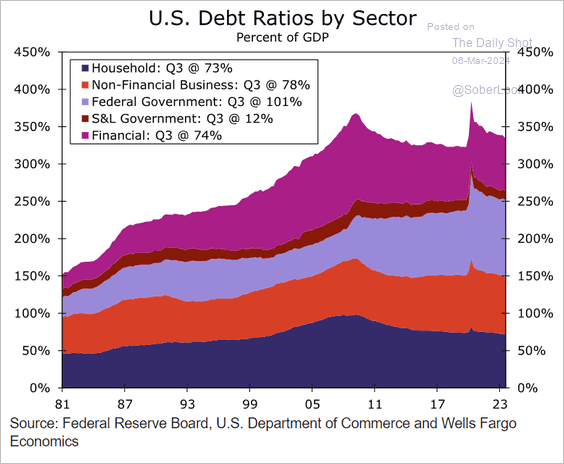 Source: Wells Fargo Securities
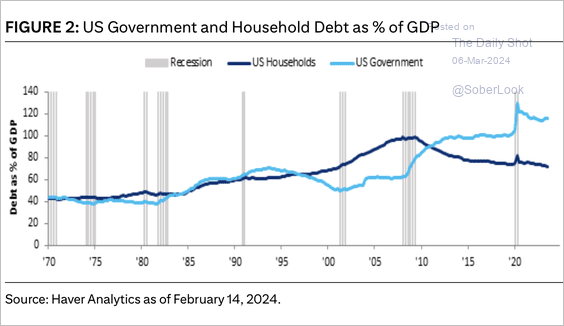 Source: Citi Private Bank
——————–
3. Levels of interest in parenthood among young adults without children:
 Source: Pew Research Center Read full article
4. Projected US population growth:
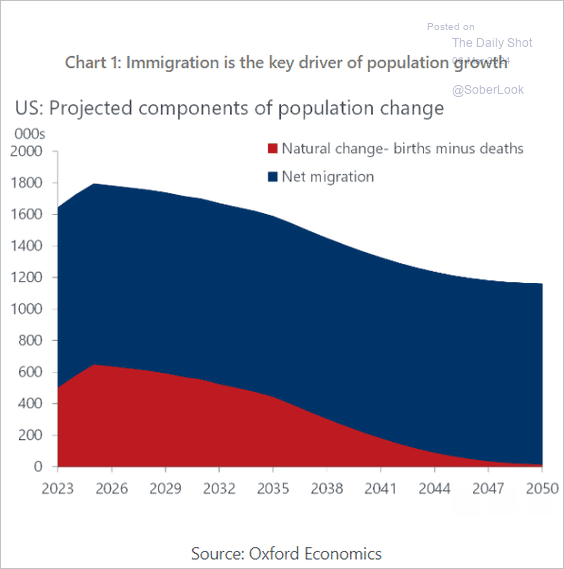 Source: Oxford Economics
5. Working days lost to health conditions:
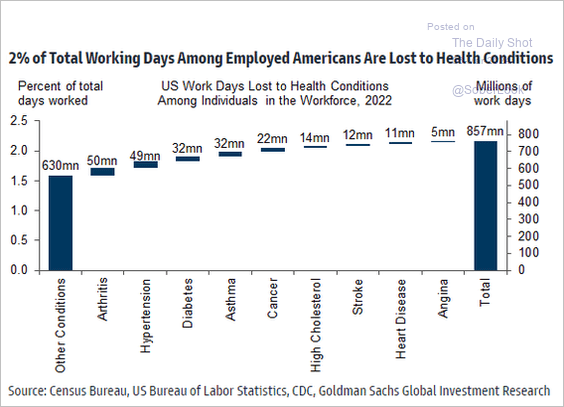 Source: Goldman Sachs; @MikeZaccardi
6. Growth in solar capacity and electricity demand:
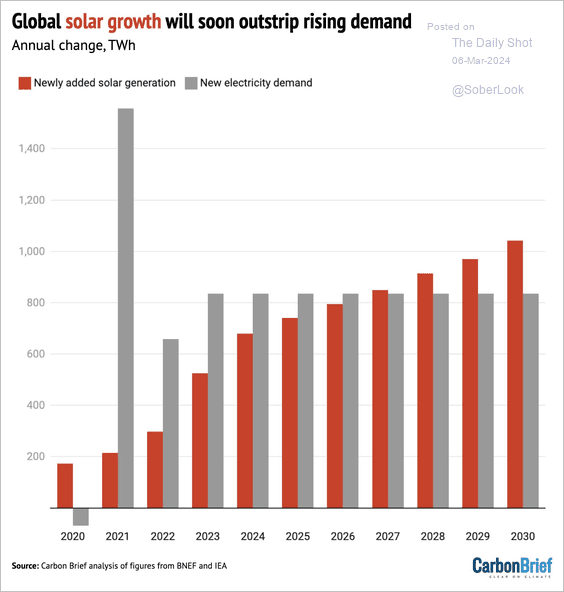 Source: @DrSimEvans, @CarbonBrief
7. US presidential candidates’ campaign finances:
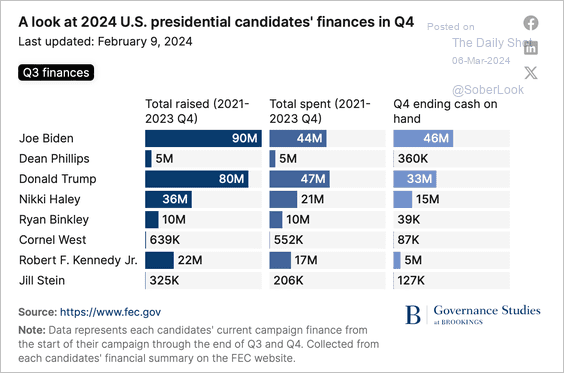 Source: Brookings Read full article
8. Top 20 most searched dating platforms in the US (2023):
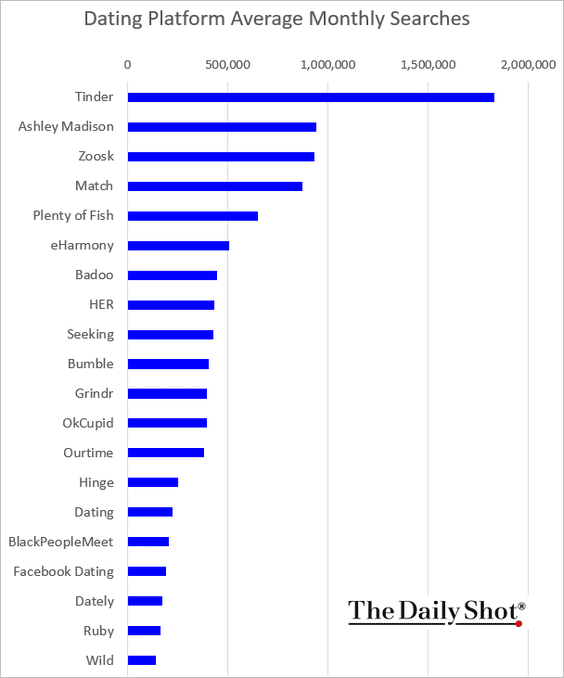 Source: NoDepositFriend.com
——————–
Back to Index