
The Daily Shot: 08-Mar-24
• The United States
• Canada
• The Eurozone
• Japan
• China
• Emerging Markets
• Cryptocurrency
• Energy
• Equities
• Credit
• Rates
• Global Developments
• Food for Thought
The United States
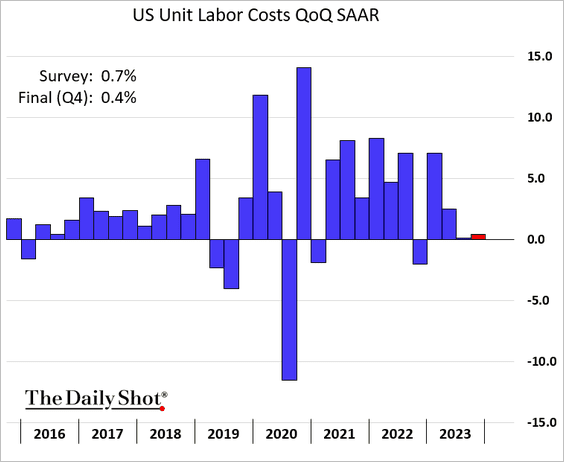
1. The 2-year Treasury yield fell below 4.5% following Chair Powell’s hinting that the Federal Reserve is increasingly confident in the deceleration of inflation trends.
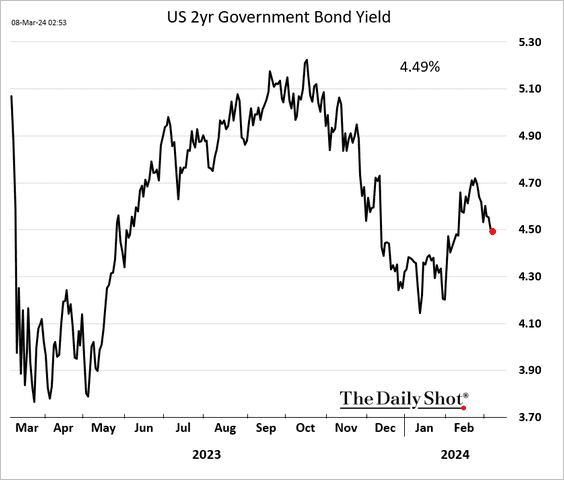
 Source: Reuters Read full article
Moderation in labor cost increases has bolstered this perspective.
——————–
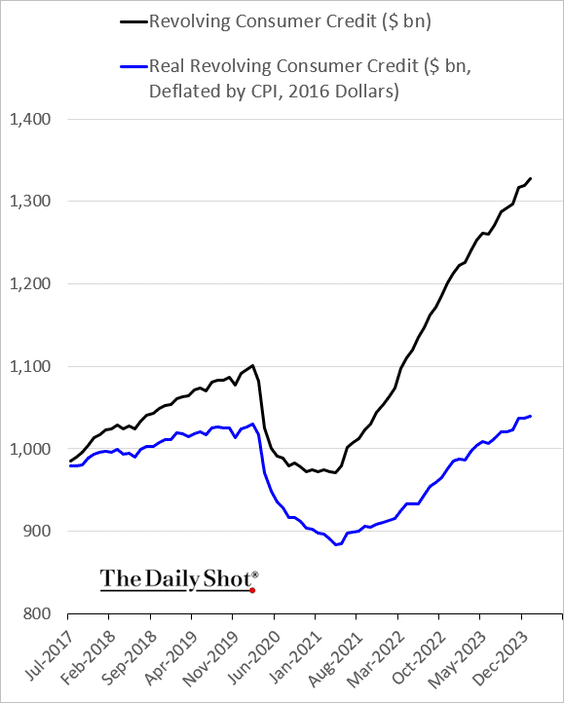
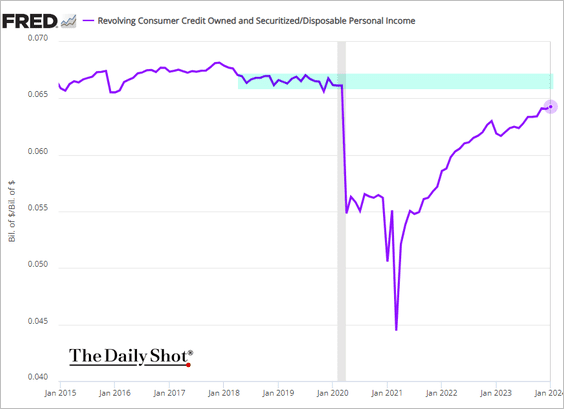
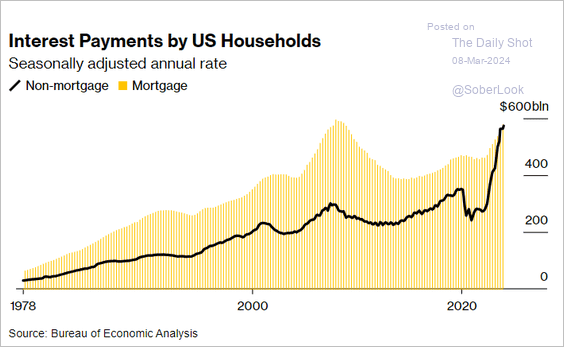
2. Consumer credit rebounded in January.
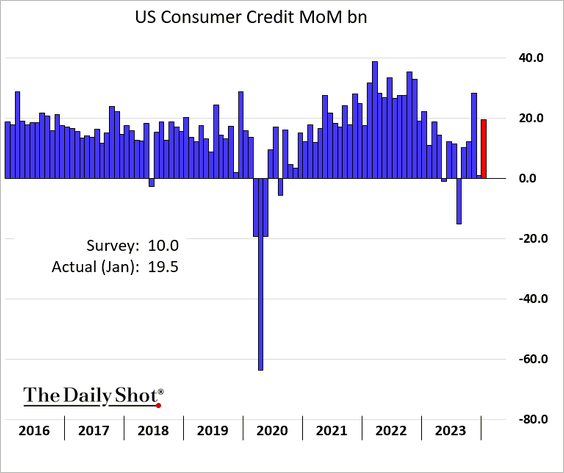
• Here is a look at nominal and real credit card debt.
• The ratio of credit card debt to disposable income is still below pre-COVID levels.
• Americans now incur as much interest on consumer debt as they do on mortgage loans.
 Source: @economics Read full article
——————–
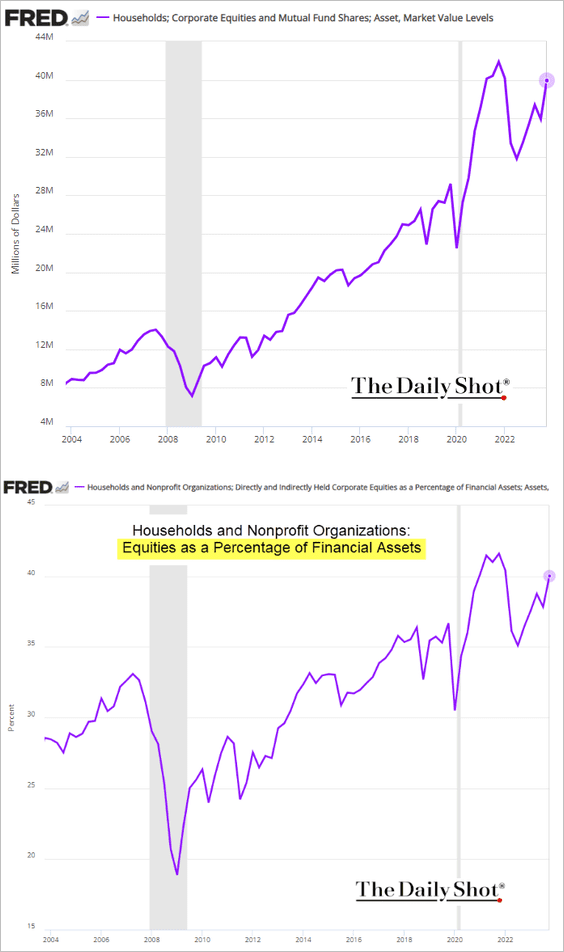
3. Household wealth jumped last quarter, …
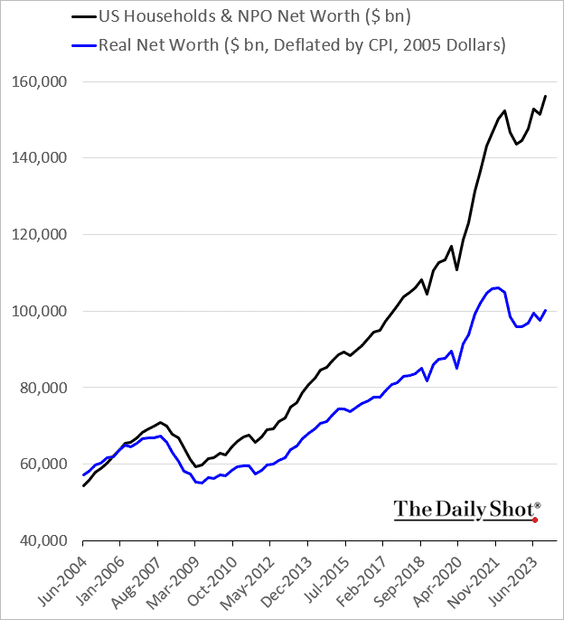
… boosted by stock prices.
——————–
4. Productivity growth has outstripped wage growth since 2019.
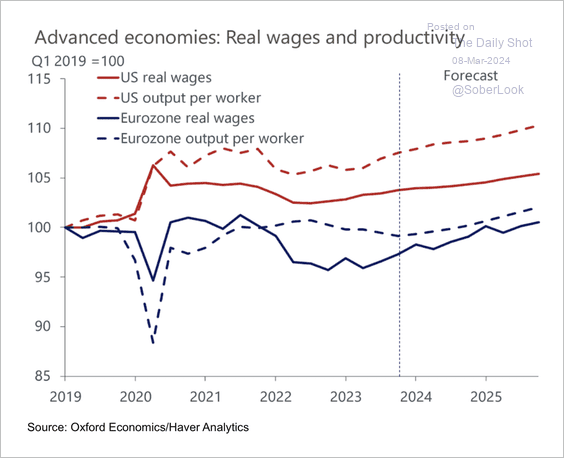 Source: Oxford Economics
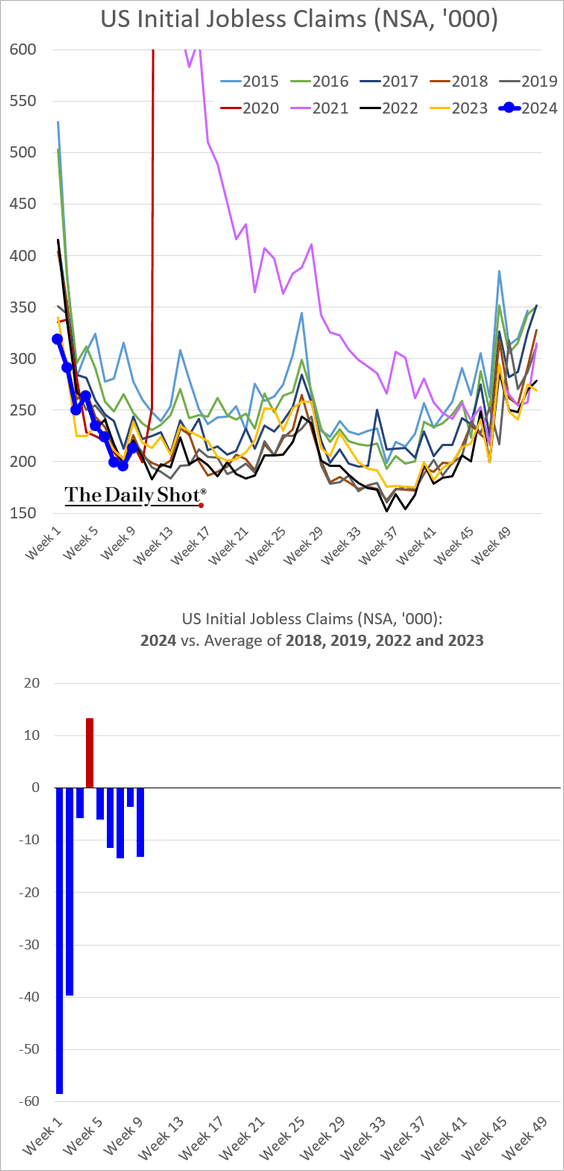
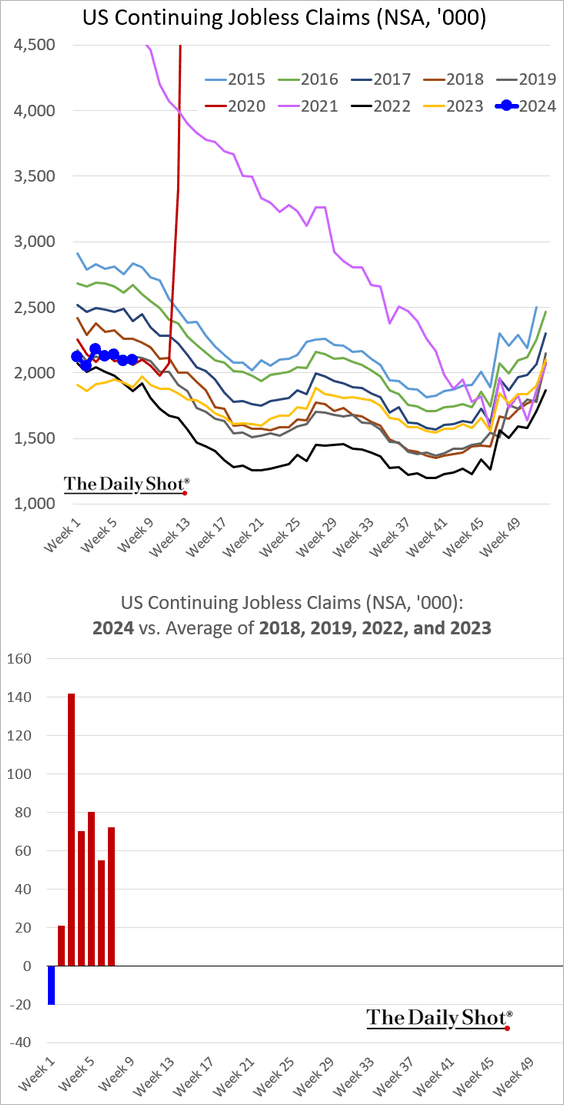
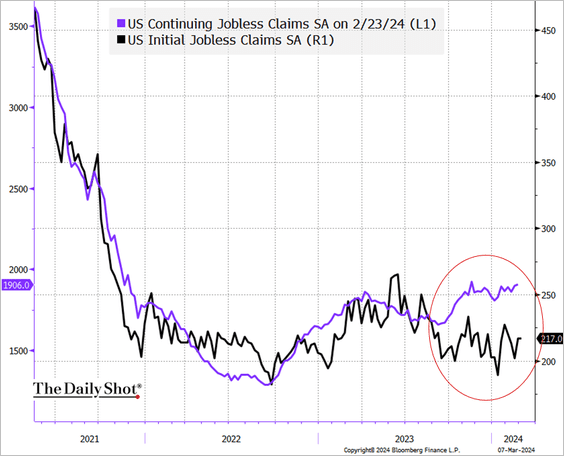
5. Next, we have some updates on the labor market.
• Initial jobless claims are running at multi-year lows.
But continuing claims are elevated relative to the past couple of years.
This seasonally adjusted chart illustrates the divergence.
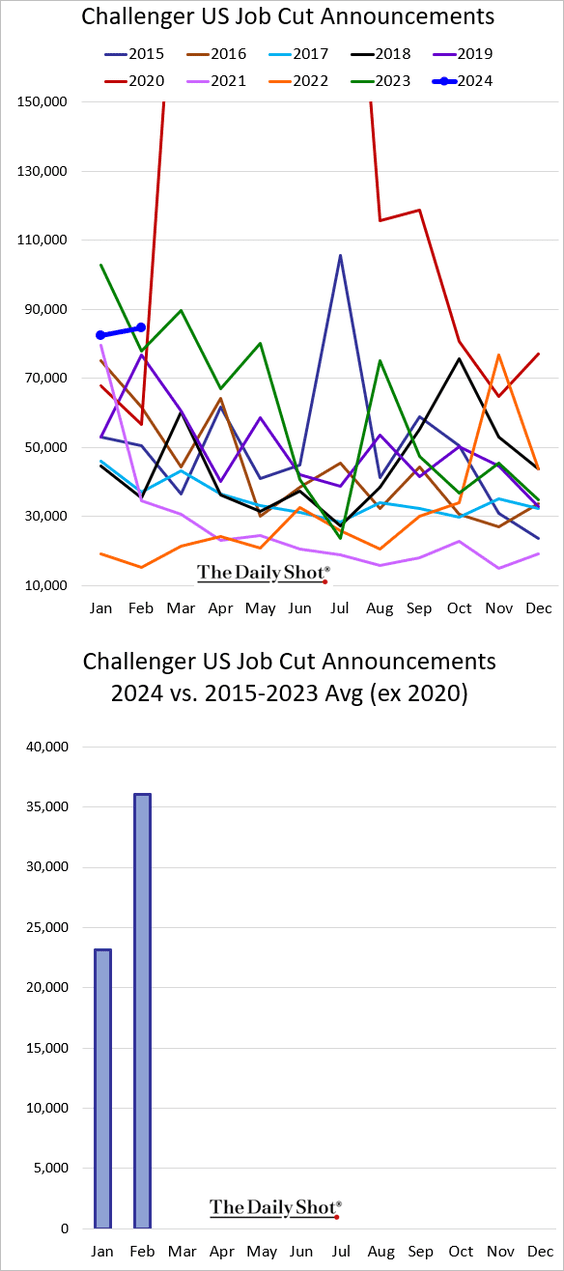
• Job cut announcements climbed last month.
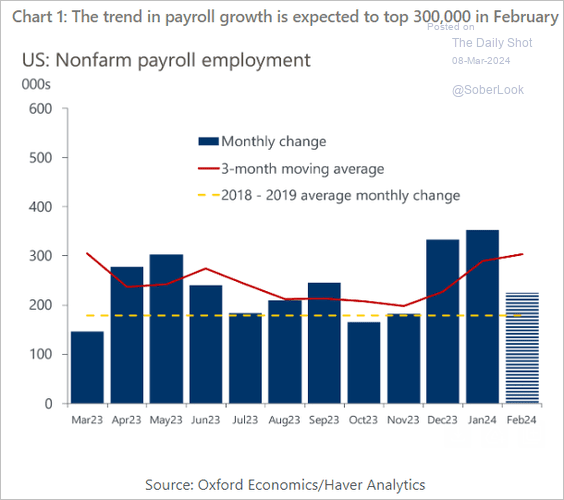
• What should we expect from today’s payrolls report for February? Here are some estimates.
– Estimates implied by various leading indicators:
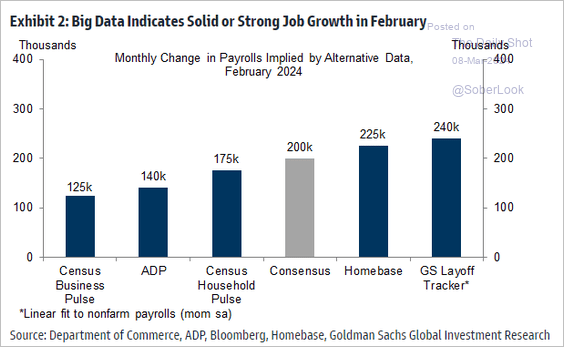 Source: Goldman Sachs; @MikeZaccardi
– BofA (215k):
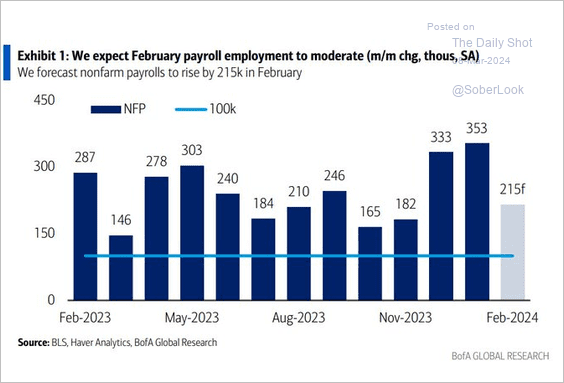 Source: BofA Global Research
• Oxford Economics (225k):
 Source: Oxford Economics
• Morgan Stanley (205k):
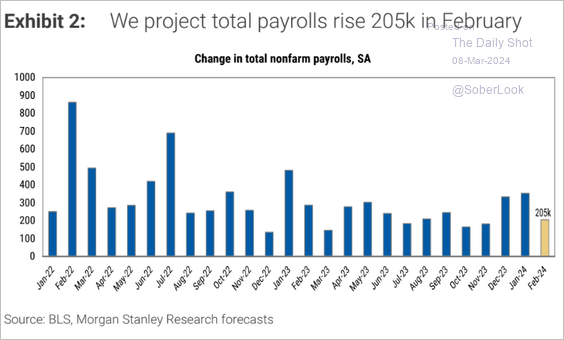 Source: Morgan Stanley Research
Morgan Stanley sees the unemployment rate holding at 3.7%.
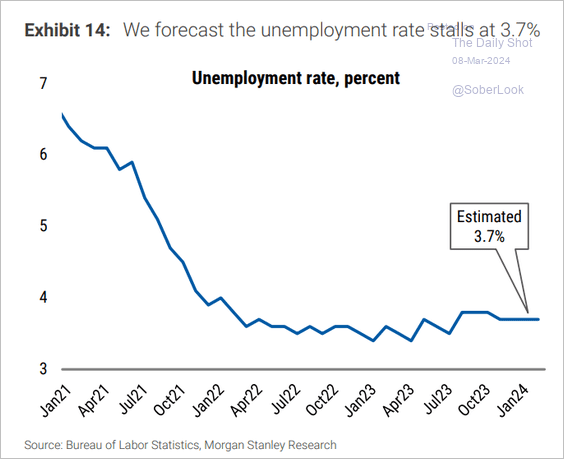 Source: Morgan Stanley Research
——————–
6. The trade deficit widened in January as imports climbed.
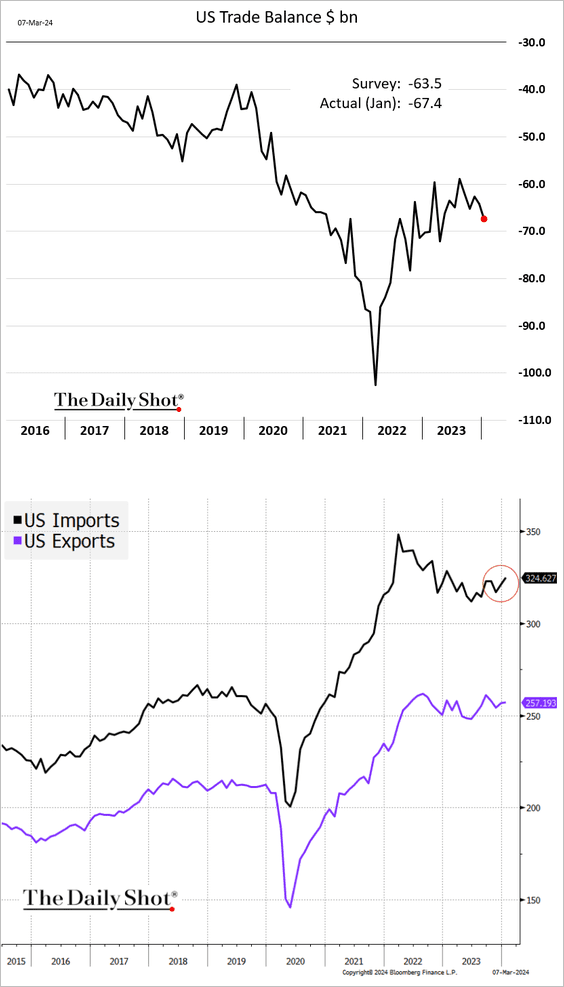 Source: @TheTerminal, Bloomberg Finance L.P.
Back to Index
Canada
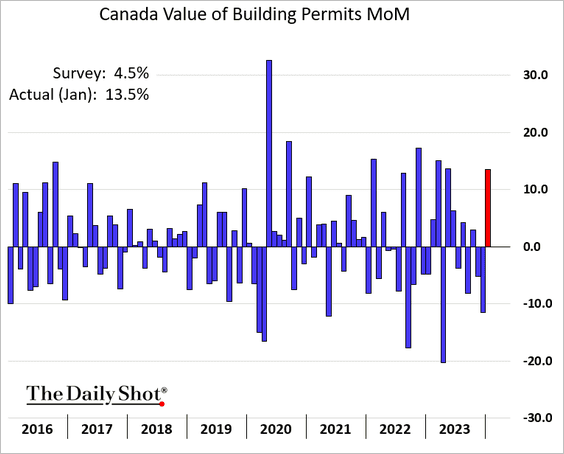
1. Building permits rebounded in January.
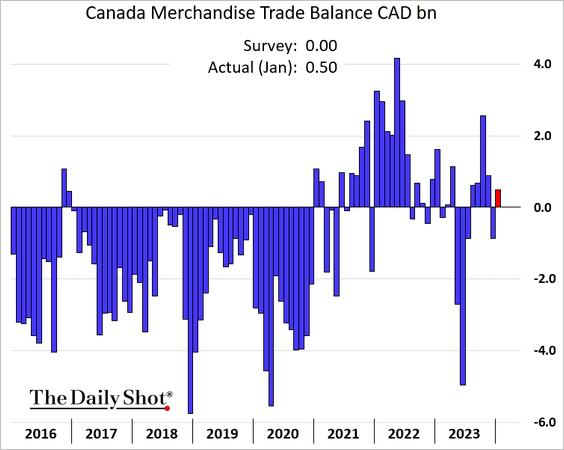
2. The trade balance was back in surplus.
Back to Index
The Eurozone
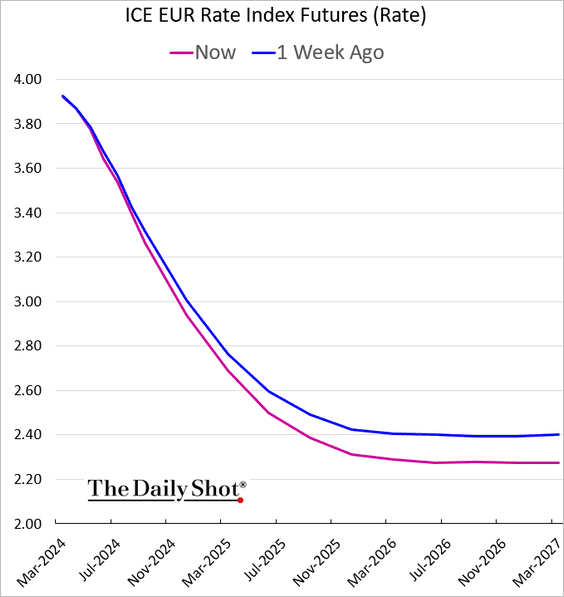
1. The ECB hinted at a June rate cut.
 Source: CNBC Read full article
The market-based rate trajectory has shifted lower in recent days.
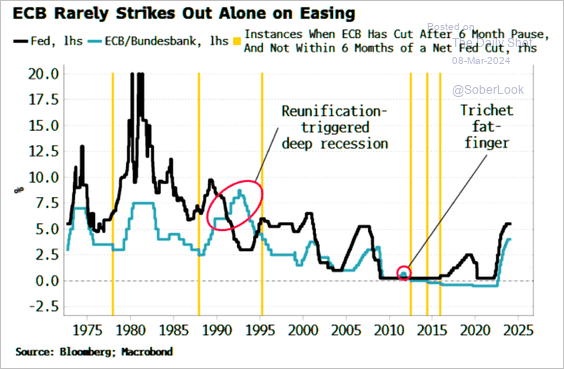
• The ECB rarely cuts rates before the Fed.
 Source: Simon White, Bloomberg Markets Live Blog
• The ECB downgraded its CPI estimates for this year and 2025. The 2024 GDP forecast was also shifted lower.
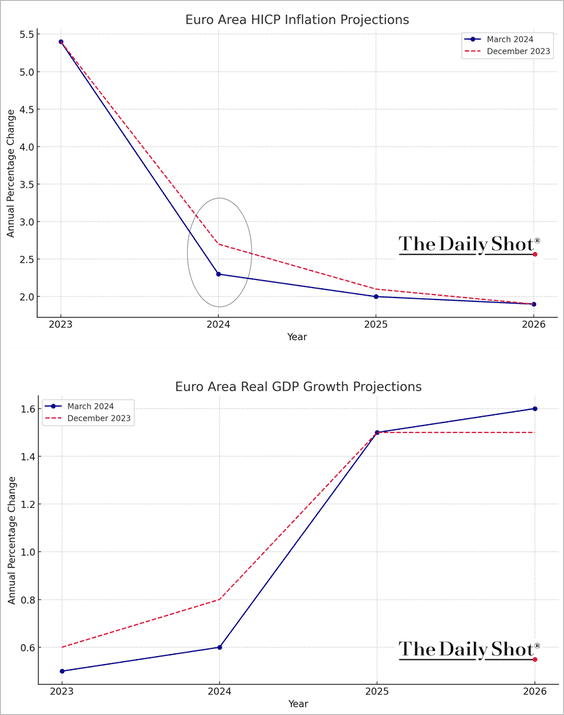
– Slower growth in private consumption pulled the GDP estimate down (2 charts).
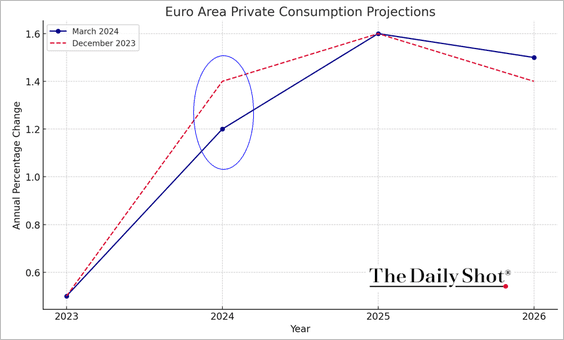
 Source: ECB
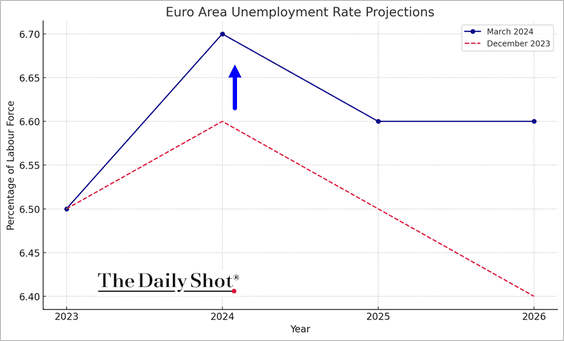
– The ECB shifted its unemployment estimates slightly higher.
——————–
2. Germany’s industrial production climbed in January.
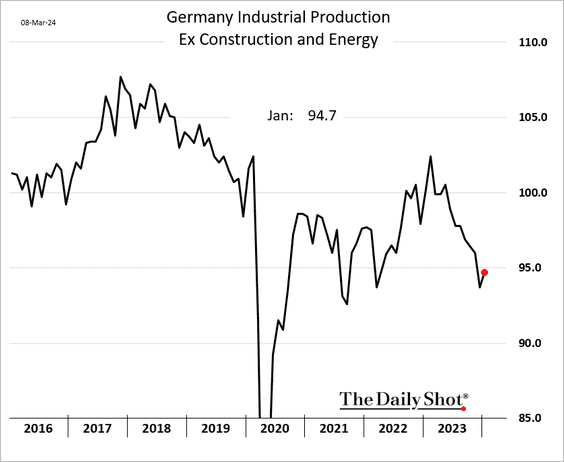
Here are the underlying trends.
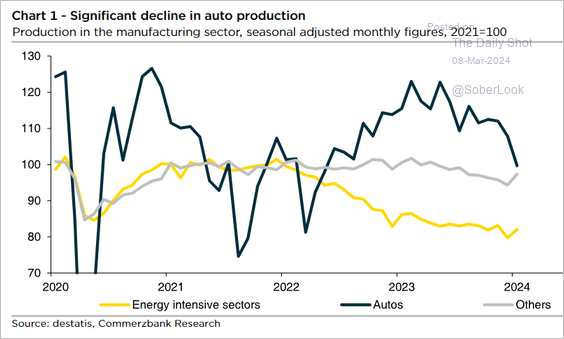 Source: Commerzbank Research
Back to Index
Japan
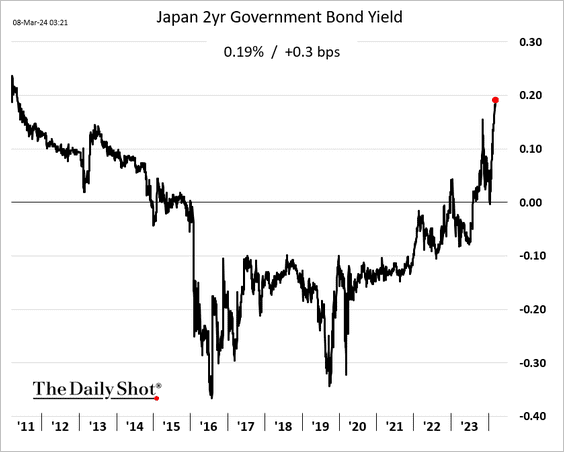
1. The 2-year JGB yield hit the highest level since 2011.
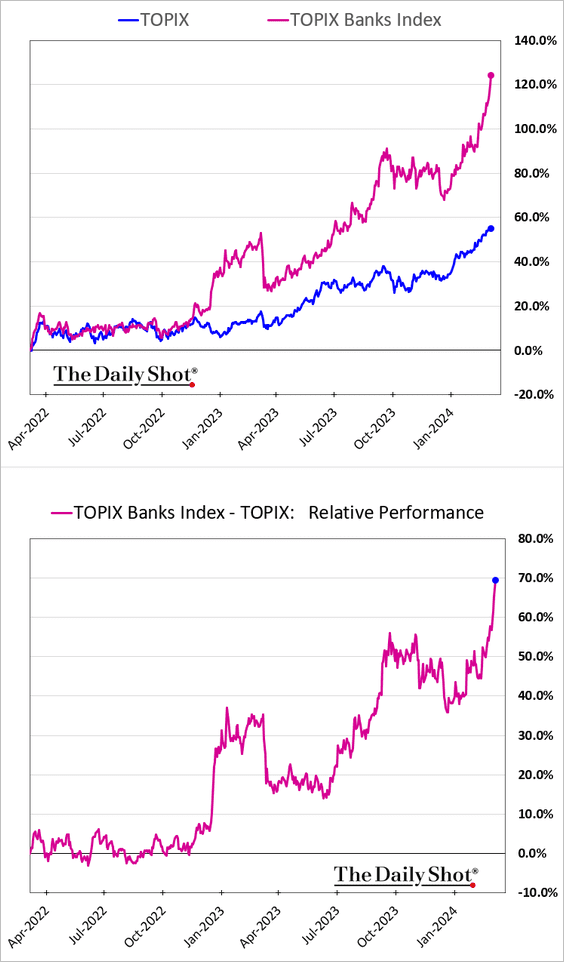
2. Bank stocks are surging in anticipation of the Bank of Japan increasing interest rates soon, concluding its negative interest rate policy.
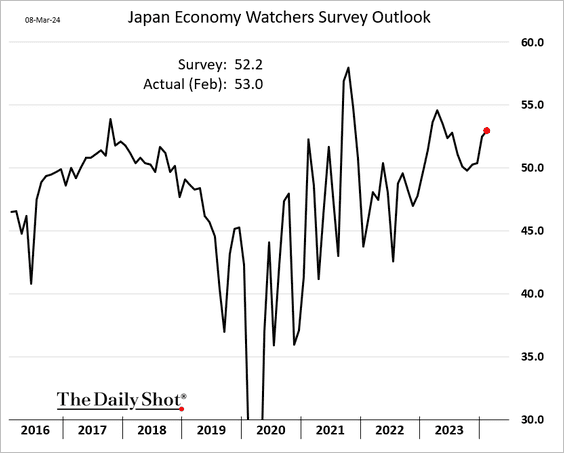
3. The Economy Watchers Survey outlook continues to climb.
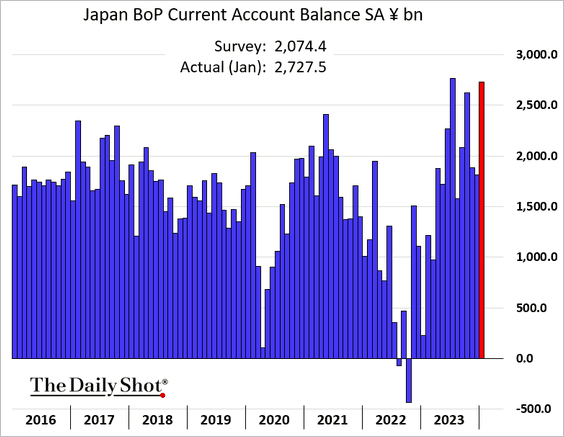
4. The current account surplus is near record highs.
Back to Index
China
1. Beijing is becoming concerned about China’s massive bond rally.
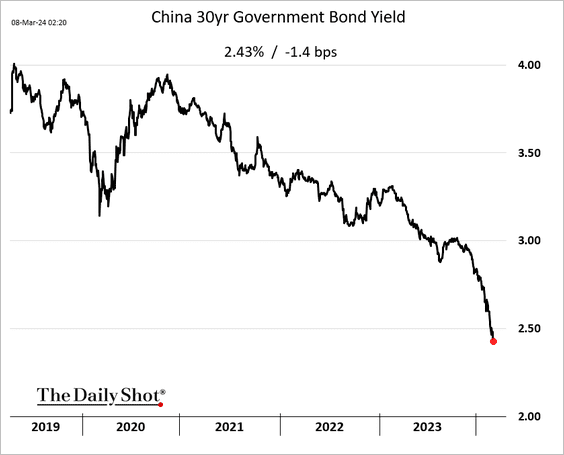
 Source: @markets Read full article
——————–
2. The CSI 300 Index has more earnings support than the MSCI China Index in the year ahead.
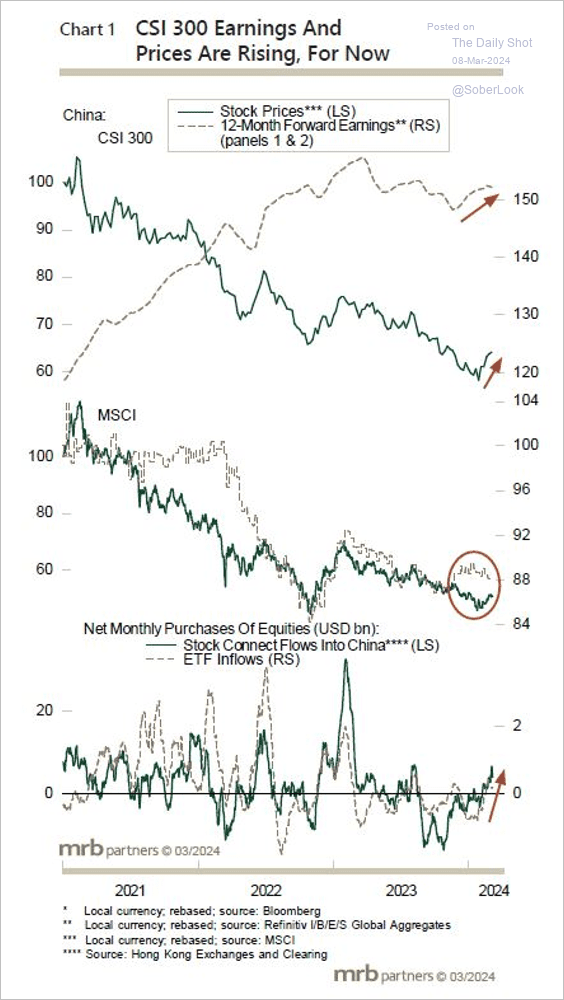 Source: MRB Partners
• The number of trades on the Shanghai Stock Exchange has increased almost five-fold since 2010.
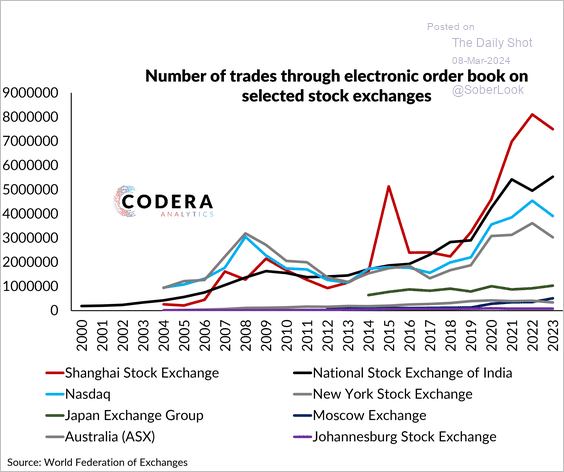 Source: Codera Analytics
——————–
3. Rail travel picked up relative to prior years during the recent holiday season.
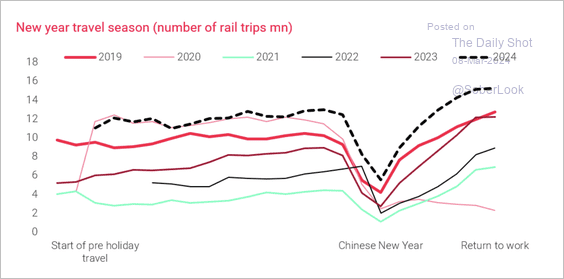 Source: TS Lombard
Back to Index
Emerging Markets
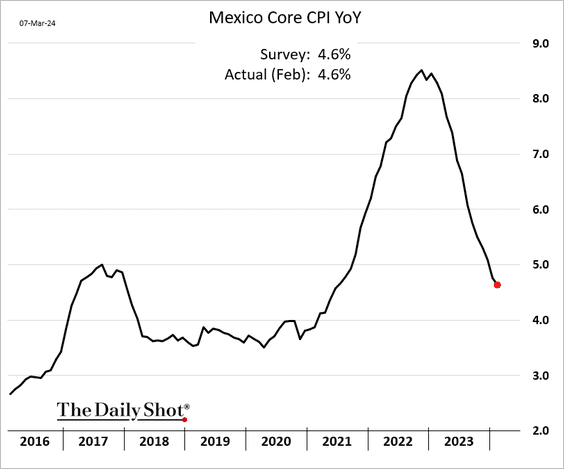
1. Mexico’s inflation continues to trend lower.
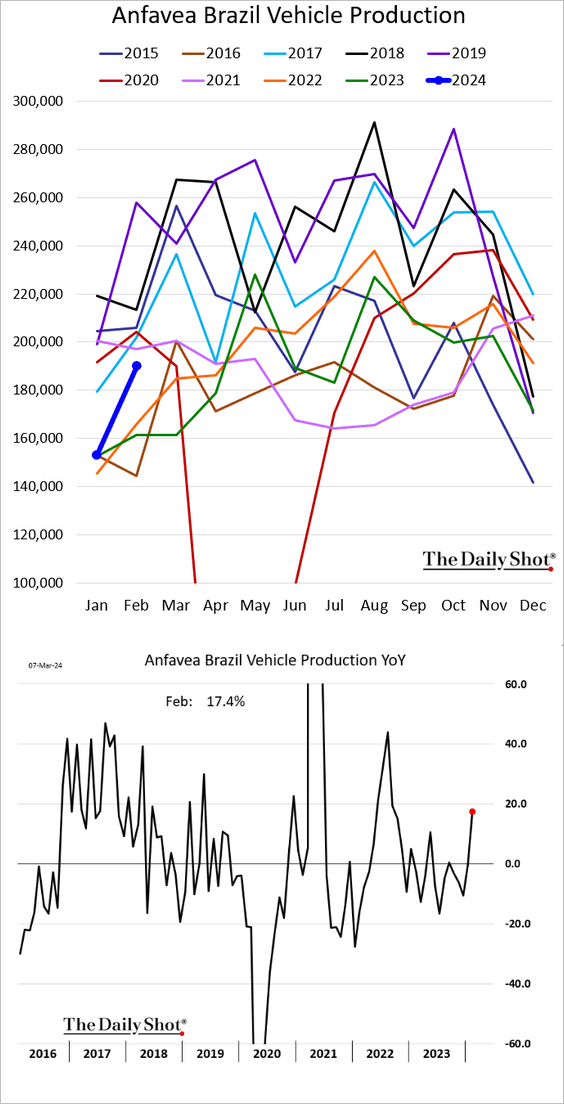
2. Brazil’s vehicle production bounced from last year’s lows.
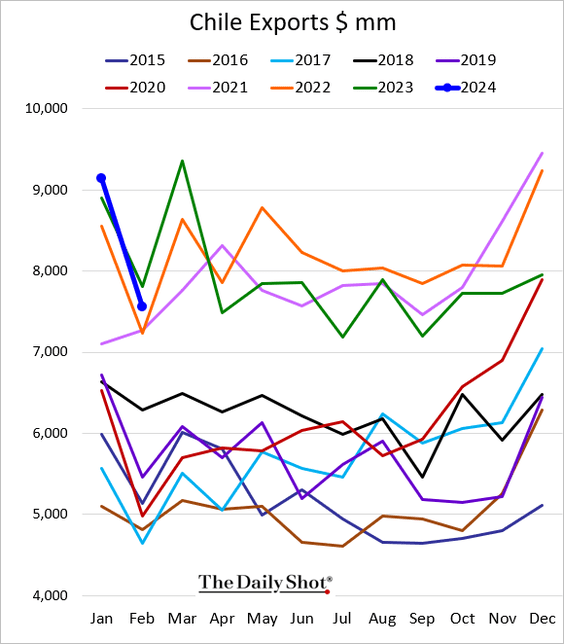
3. Chile’s exports dipped below 2023 levels in February.
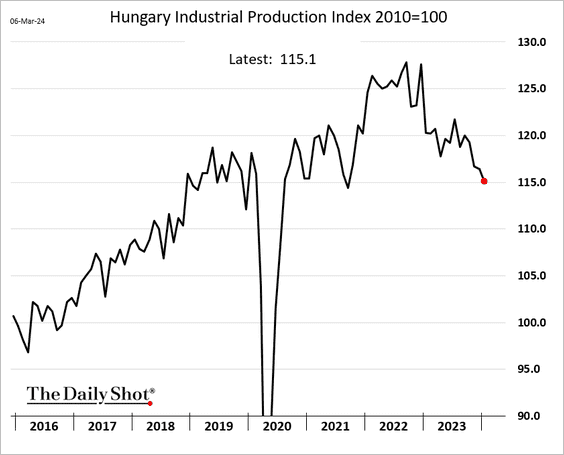
4. Hungarian industrial production continues to sink.
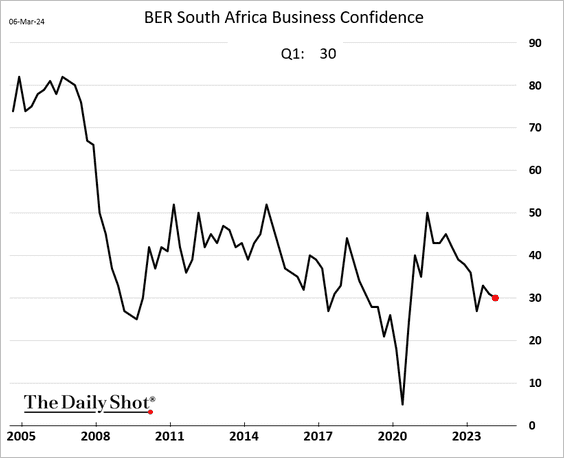
5. South Africa’s business confidence is trending lower.
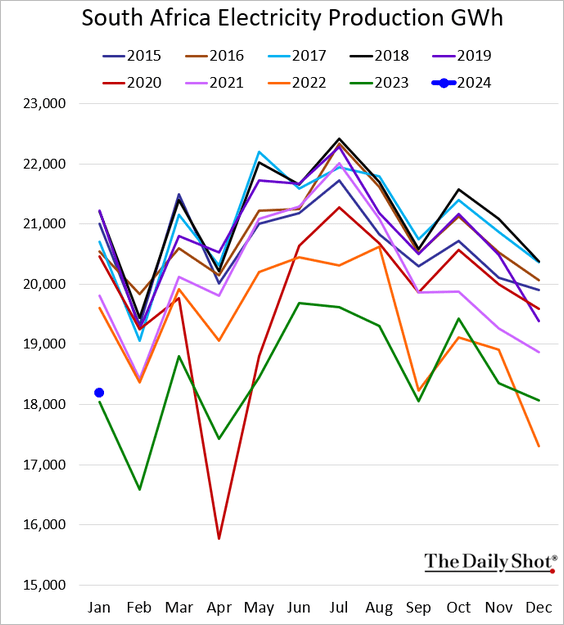
The nation’s electricity output remains depressed.
——————–
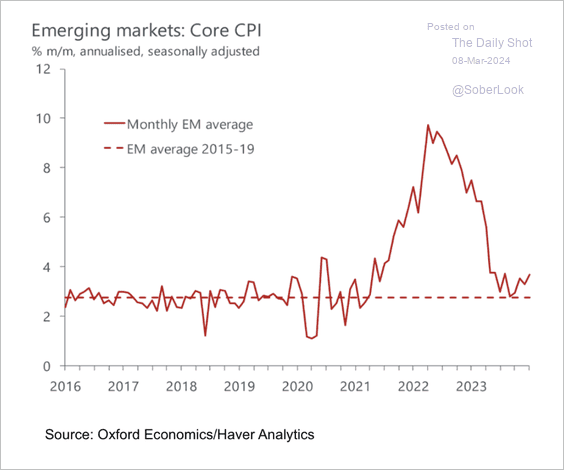
6. Disinflation across EM remains broadly on track, although the average core CPI remains above the 2015-2019 average.
 Source: Oxford Economics
Back to Index
Cryptocurrency
1. Ether (ETH) outperformed major cryptos over the past week, while litecoin (LTC) and bitcoin cash (BCH) lagged.
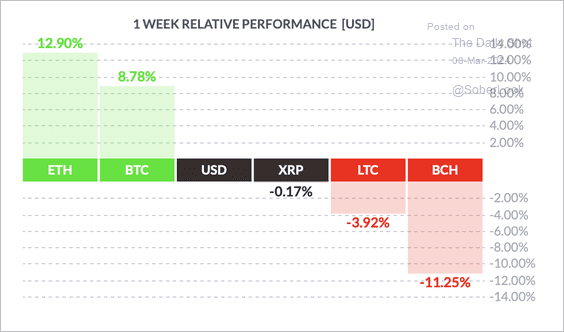 Source: FinViz
2. Trading volumes in bitcoin and meme tokens surged last week. (2 charts)
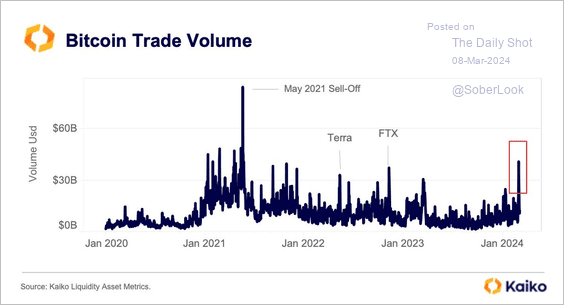 Source: @KaikoData
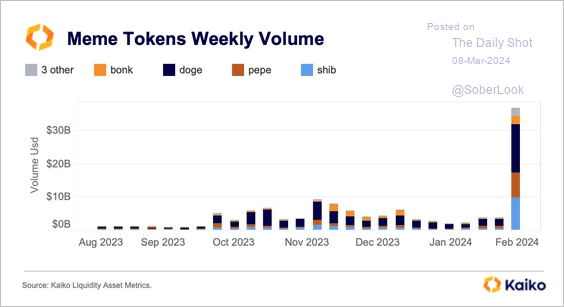 Source: @KaikoData
——————–
3. Inflows into BlackRock and Fidelity spot-bitcoin ETFs have offset outflows from Grayscale, which formerly dominated regulated US bitcoin investing.
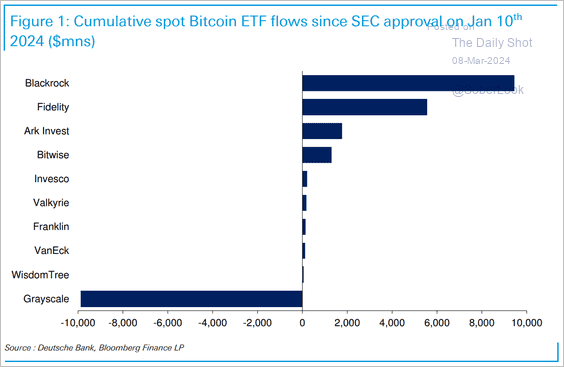 Source: Deutsche Bank Research
4. Crypto fund inflows have been impressive.
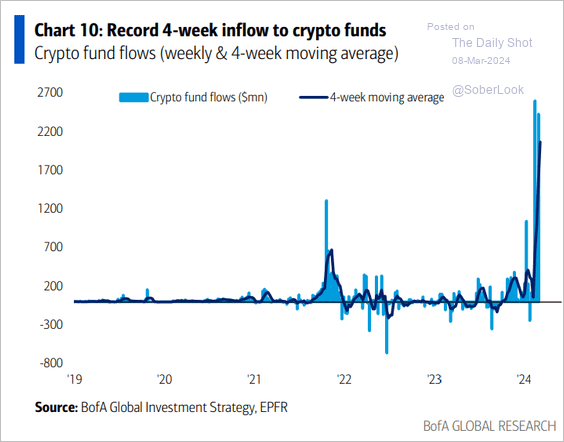 Source: Bank of America Institute
Back to Index
Energy
1. Here is a look at US crude oil and natural gas production by year.
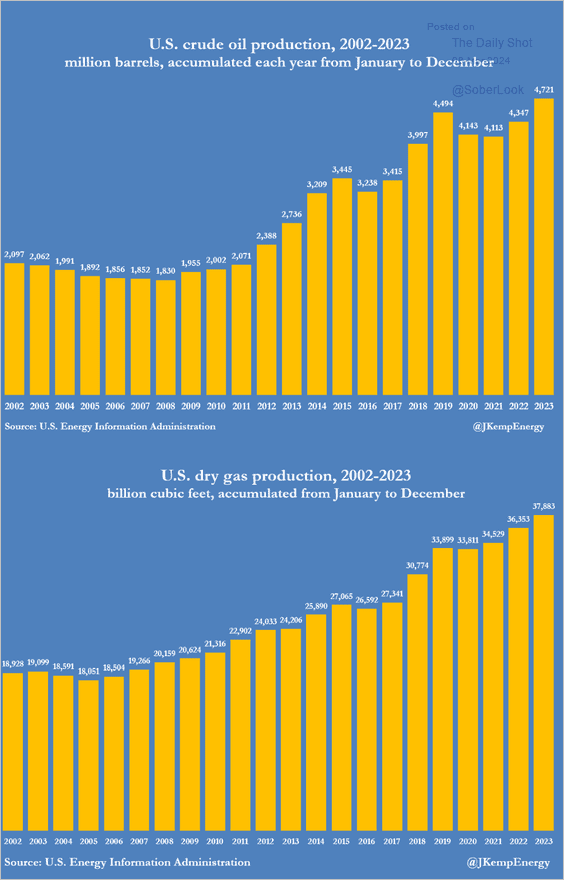 Source: @JKempEnergy
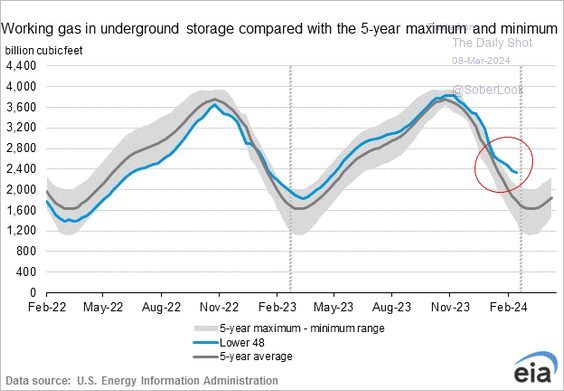
2. Next, we have some updates on natural gas.
• US natural gas in storage continues to diverge from the seasonal trend.
• US natural gas is trading roughly 35% below “fair value,” according to Numera Analytics.
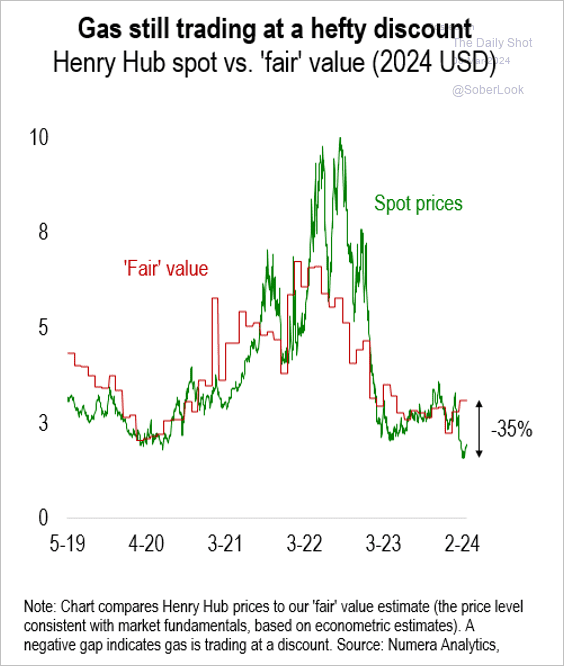 Source: Numera Analytics (@NumeraAnalytics)
• The spread between European and US natural gas prices has ample room to converge.
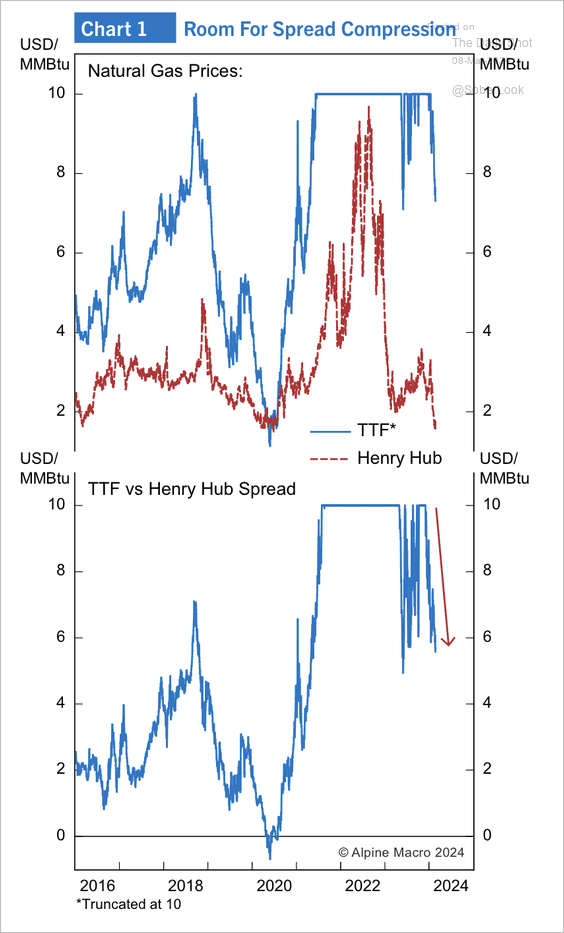 Source: Alpine Macro
• US LNG export capacity is expected to nearly double over the next few years.
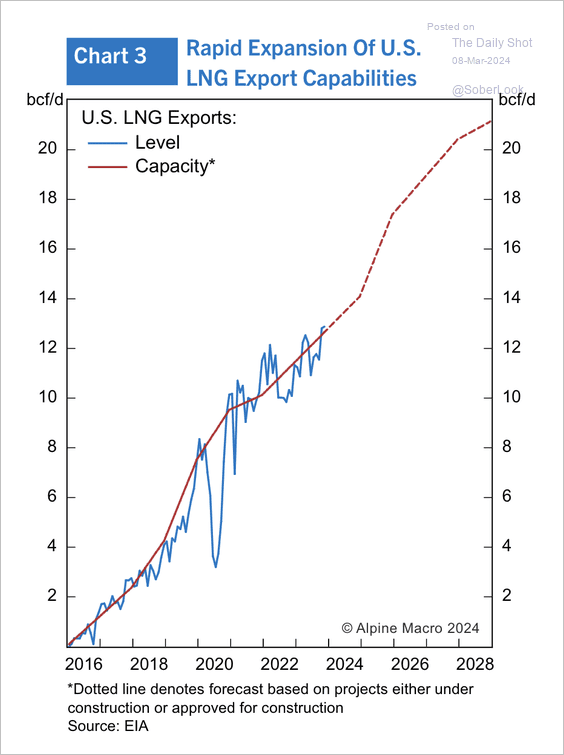 Source: Alpine Macro
Back to Index
Equities
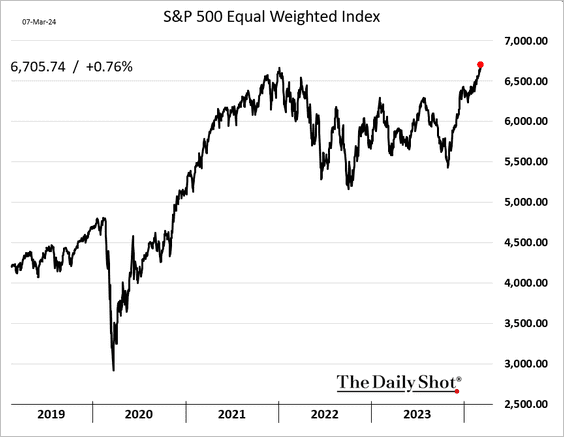
1. The S&P 500 equal-weight index hit a record high.
2. The S&P 500 is up 25% in five months.
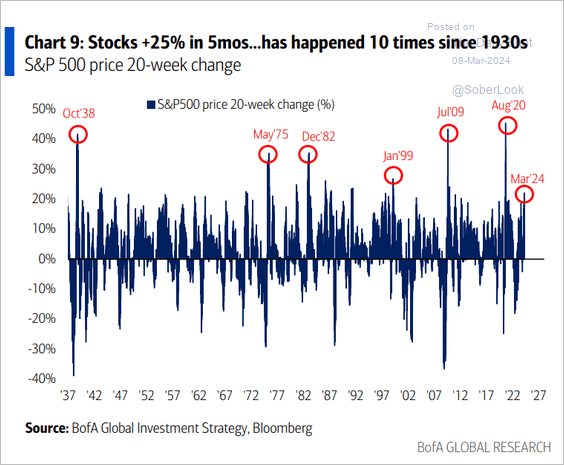 Source: Bank of America Institute
3. Semiconductor companies’ outperformance has been unprecedented, …
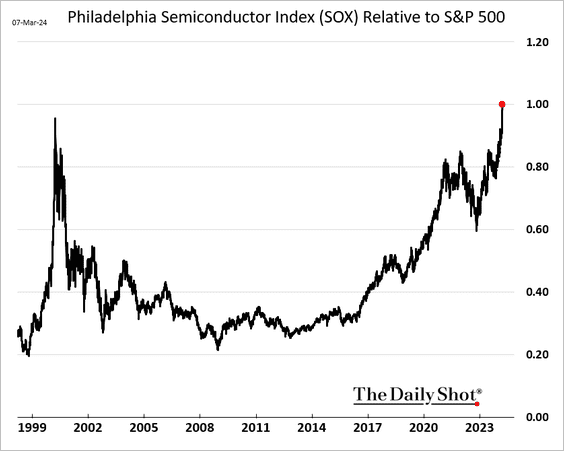
… as the SOX index moves back into overbought territory.
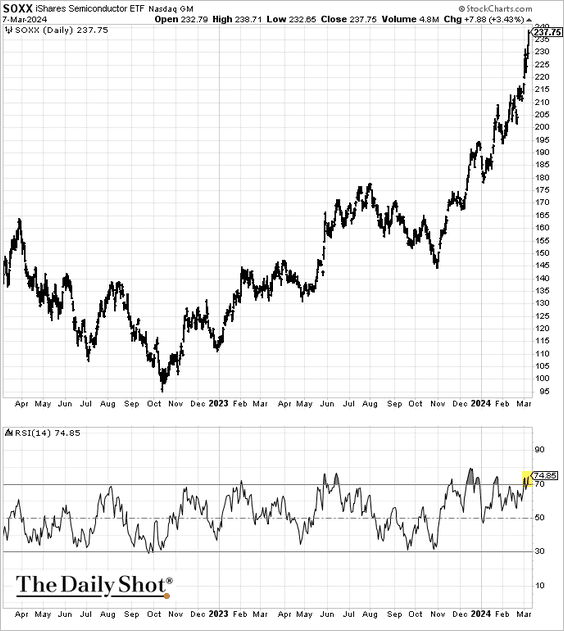
Options activity in semiconductors has been surging.
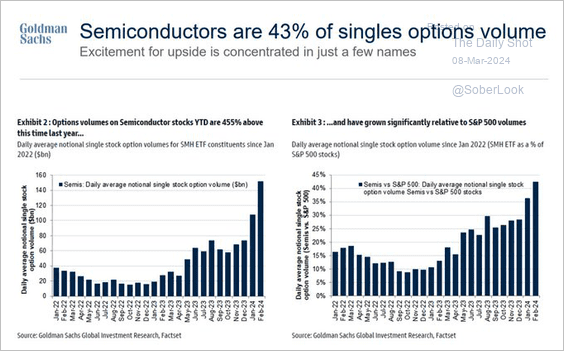 Source: Goldman Sachs; @WallStJesus
——————–
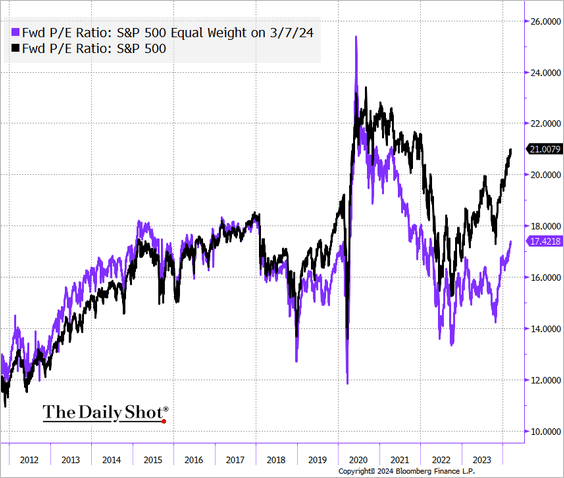
4. The S&P 500 12-month forward P/E ratio is back above 21x.
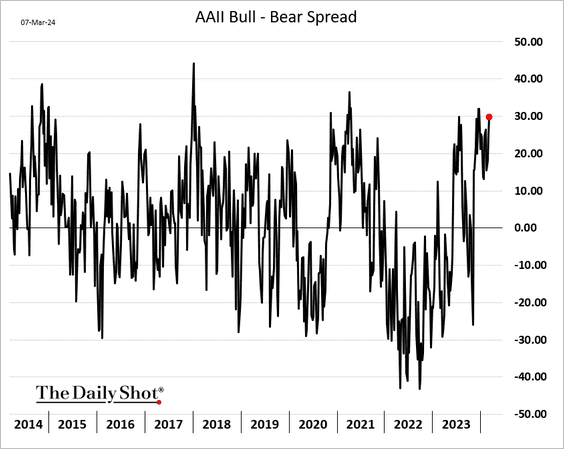
5. Investor confidence is on the rise.
• Retail investors:
• Investment managers:
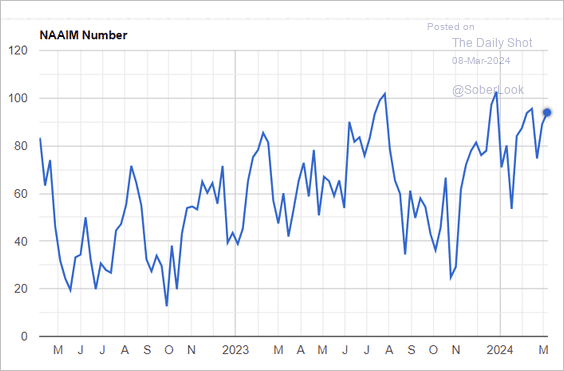 Source: NAAIM
• Fund flows:
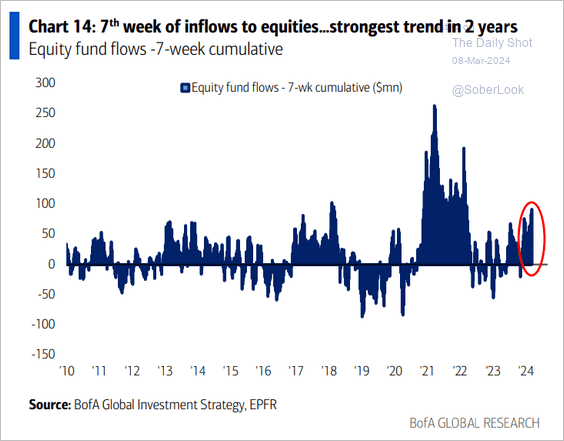 Source: Bank of America Institute
——————–
6. Tech funds saw some outflows.
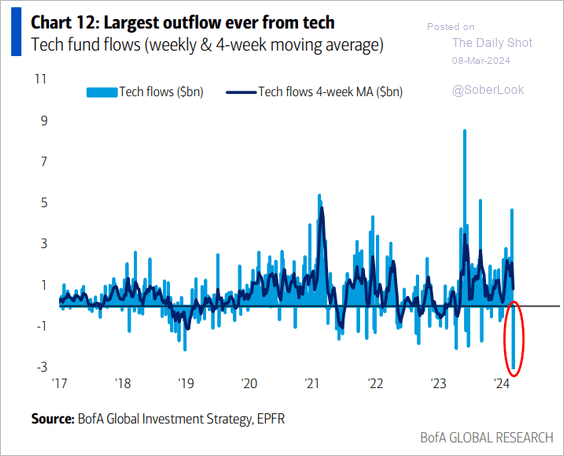 Source: Bank of America Institute
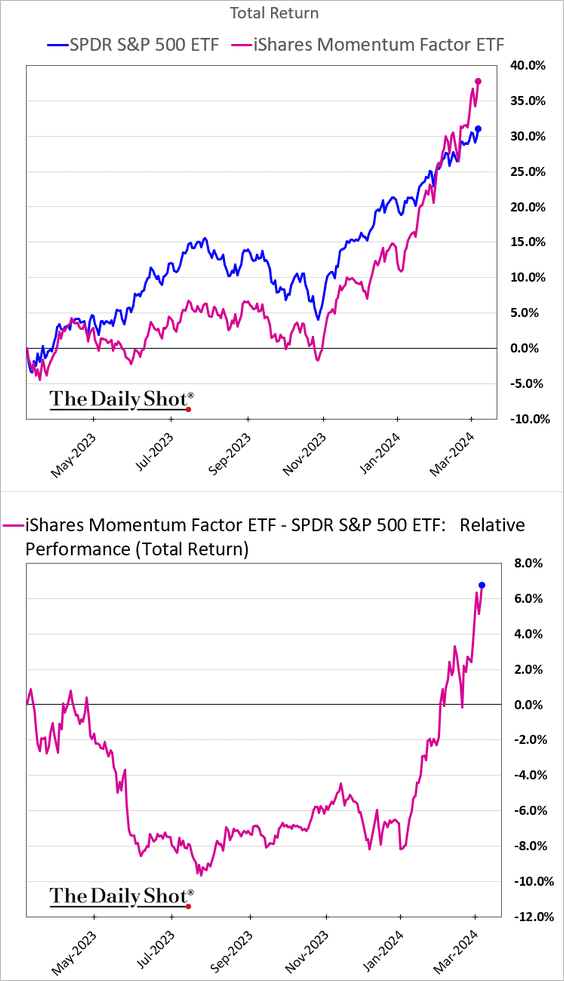
7. The momentum factor continues to outperform.
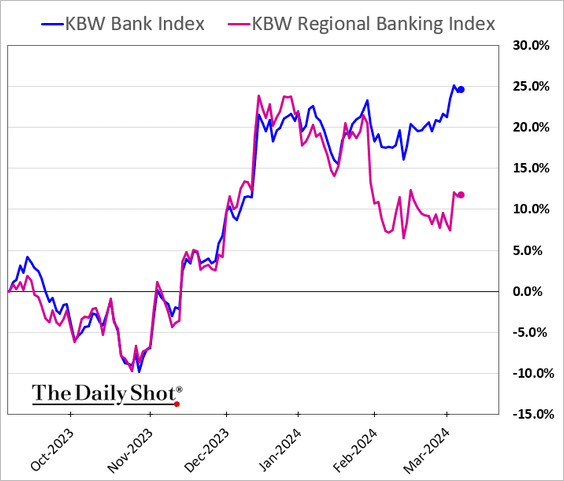
8. Regional banks have been underperforming since the NYCB mess.
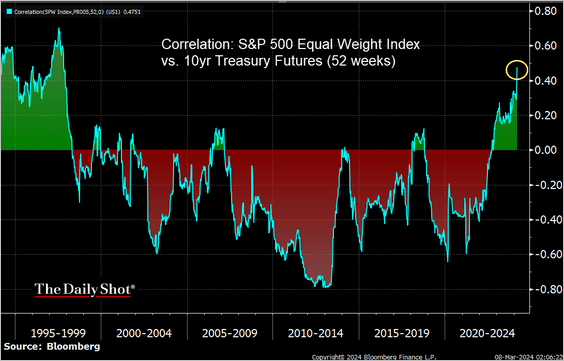
9. On a 52-week basis, the S&P 500 Equal Weight Index has shown the highest correlation with Treasuries since the 1990s.
10. Here is a look at industry weights for the US and UK markets in 1900 and 2024.
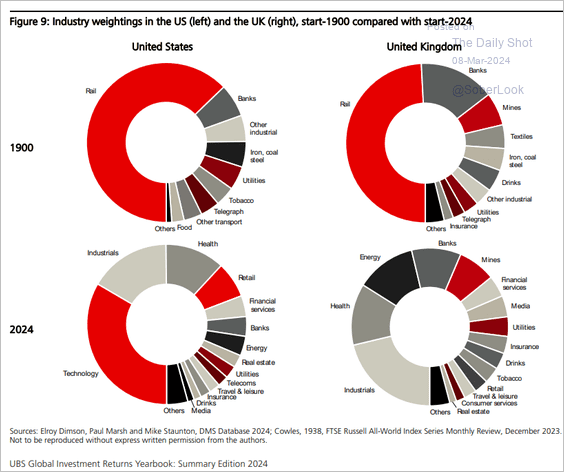 Source: UBS Asset Management
Back to Index
Credit
1. IG bond fund flows are holding up well.
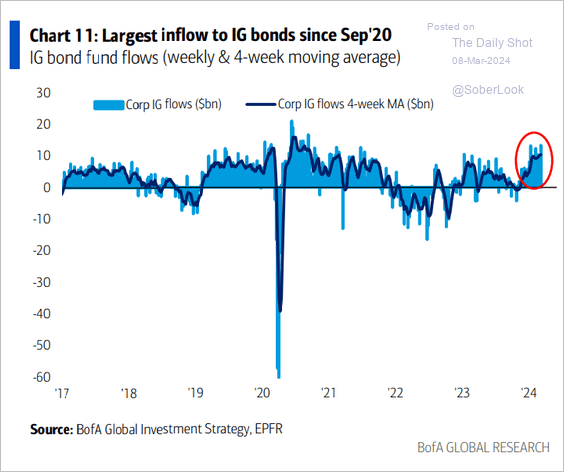 Source: Bank of America Institute
2. Does a stronger US labor market signal tighter credit spreads?
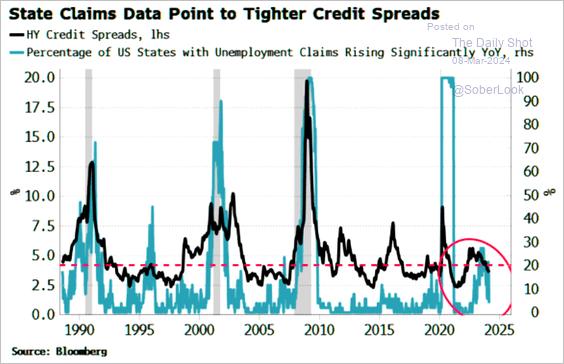 Source: Simon White, Bloomberg Markets Live Blog
Back to Index
Rates
As reserves begin to decline, short-term rates could move higher (which is what happened in 2019).
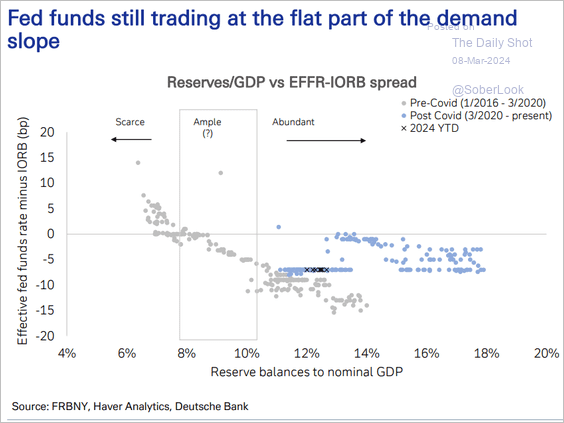 Source: Deutsche Bank Research
• The Fed will be watching for overnight rate dislocations among some of the weaker lenders.
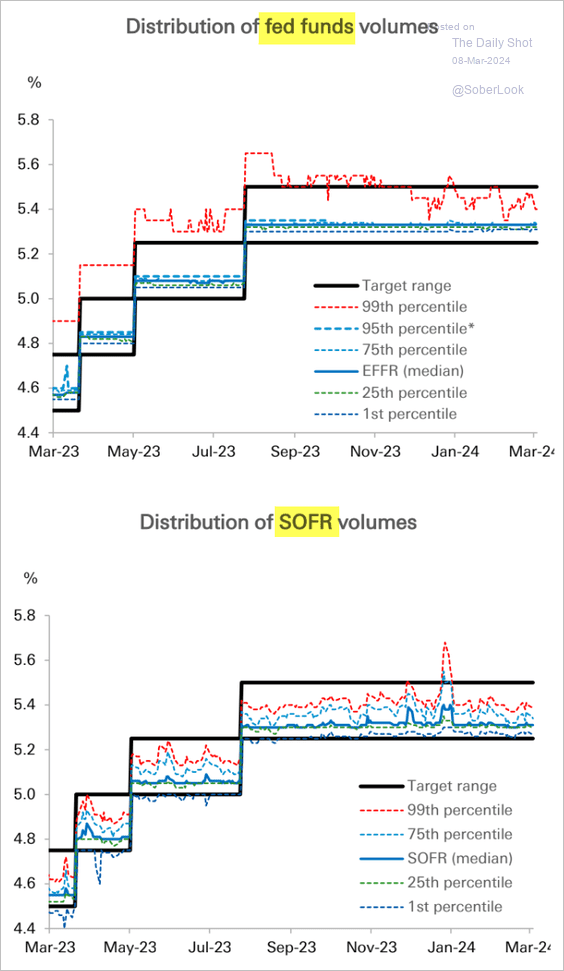 Source: Deutsche Bank Research
• Tighter liquidity will boost short-term rate volatility
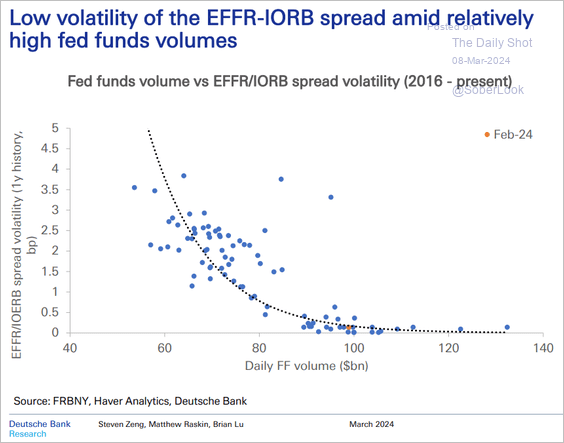 Source: Deutsche Bank Research
Back to Index
Global Developments
1. Global economic growth indicators have been improving.
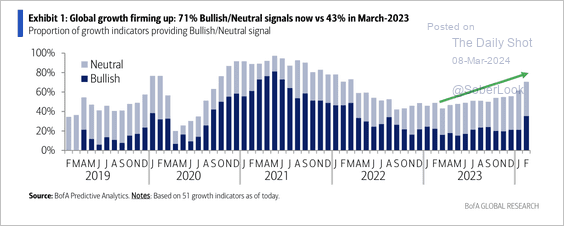 Source: BofA Global Research
2. Here is a look at debt-to-GDP ratios for select economies.
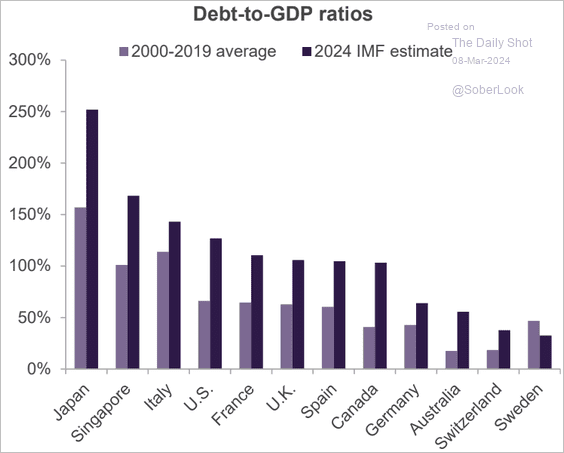 Source: Truist Advisory Services
——————–
Food for Thought
1. Worst 20-year stock performance:
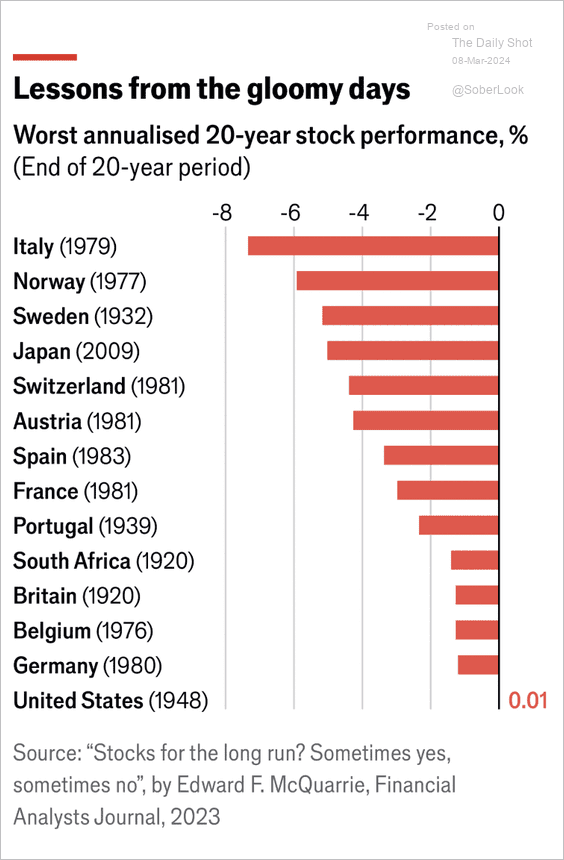 Source: The Economist
2. Childcare inflation:
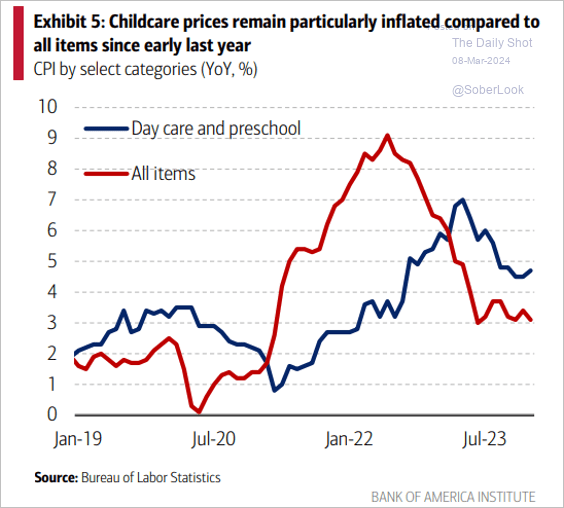 Source: BofA Global Research
3. US centenarian population:
 Source: Pew Research Center Read full article
4. China’s container shipments to Mexico:
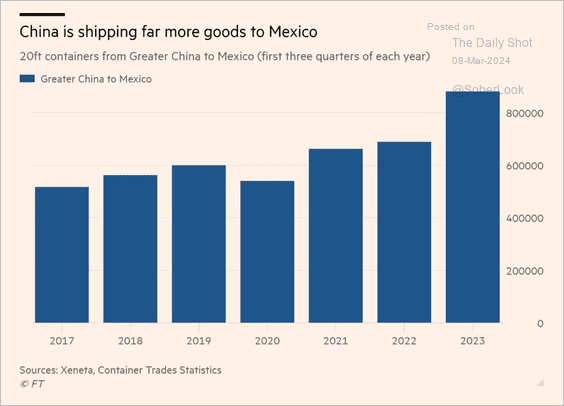 Source: @financialtimes Read full article
5. Defense companies’ rising order backlogs:
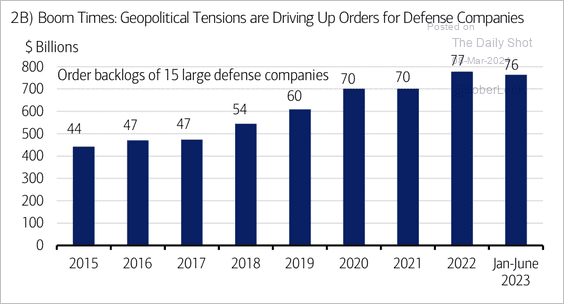 Source: Merrill Lynch
6. Locations where children found firearms in unintentional shootings:
 Source: @axios Read full article
7. UFO hotspots:
 Source: @axios Read full article
——————–
Have a great weekend!
Back to Index