
The Daily Shot: 11-Mar-24
• The United States
• Canada
• The United Kingdom
• Europe
• Asia-Pacific
• China
• Emerging Markets
• Cryptocurrency
• Commodities
• Equities
• Credit
• Global Developments
• Food for Thought
The United States
1. February’s job gains exceeded expectations, yet the underlying trends in the employment report indicate a softening labor market.

• Three sectors continue to propel job gains: healthcare, leisure & hospitality, and government (primarily public school teachers).
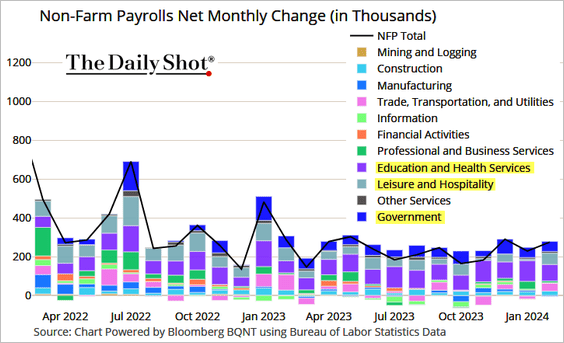 Source: @TheTerminal, Bloomberg Finance L.P.
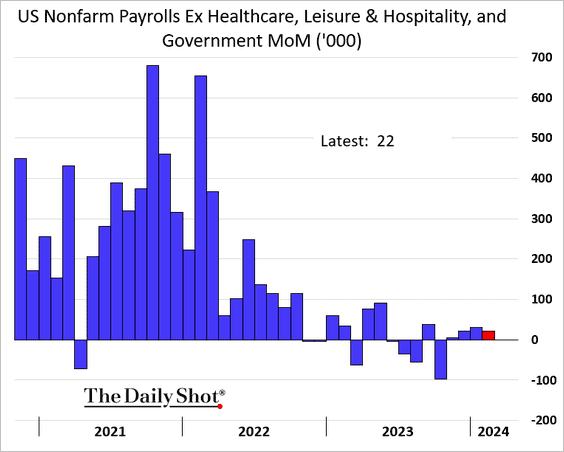
Excluding these sectors, job gains have been tepid.
• We continue to see a divergence between the Establishment Survey (the official figures above) and the Household Survey.
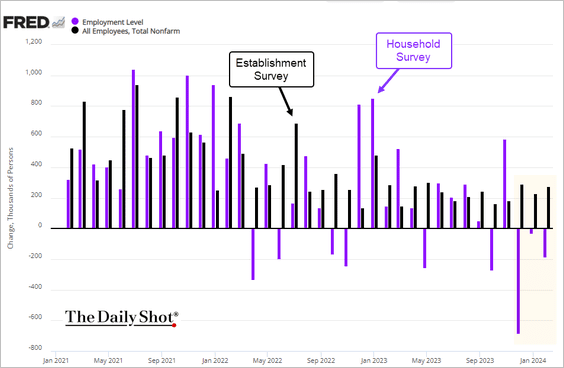
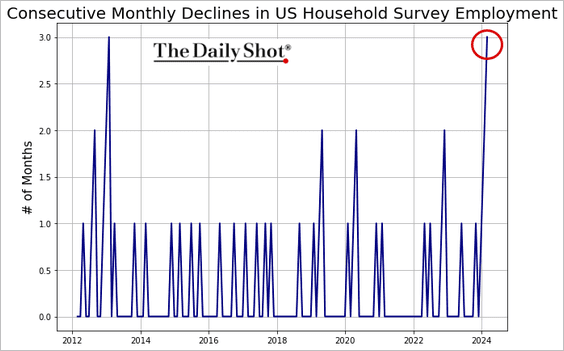
It has been some time since the Household Survey reported three consecutive months of employment contraction.
• The unemployment rate climbed last month.
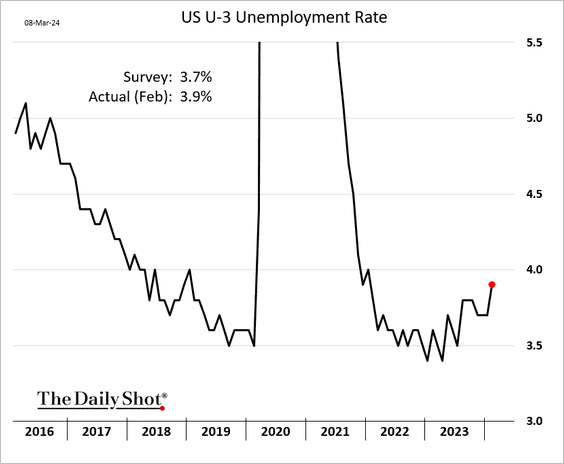
Numera Analytics expects the unemployment rate to approach 5% by early next year, which could occur alongside an easing cycle.
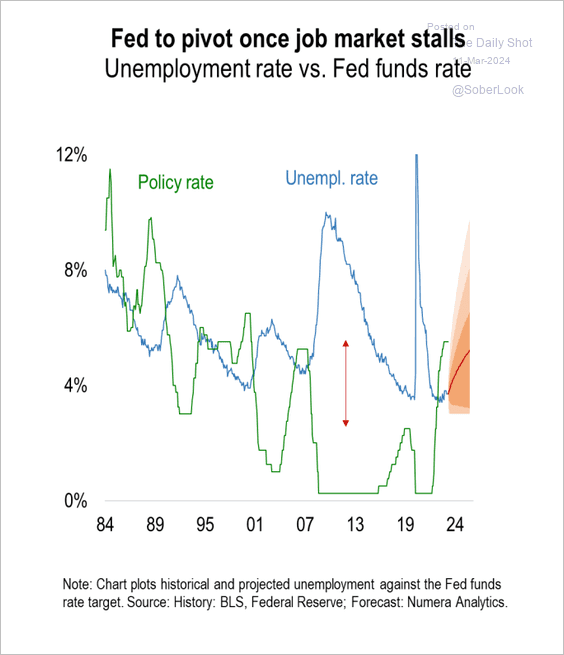 Source: Numera Analytics (@NumeraAnalytics)
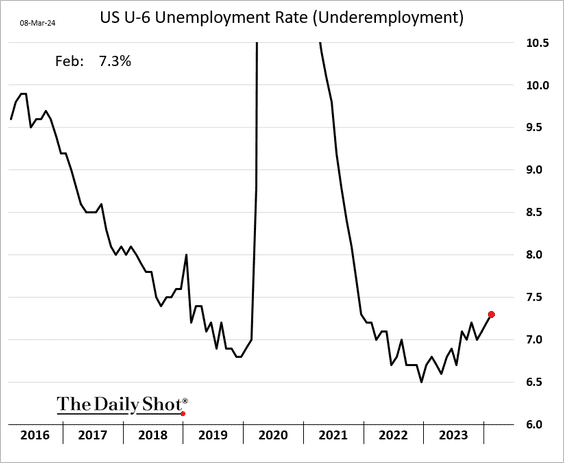
– Underemployment is also trending higher.
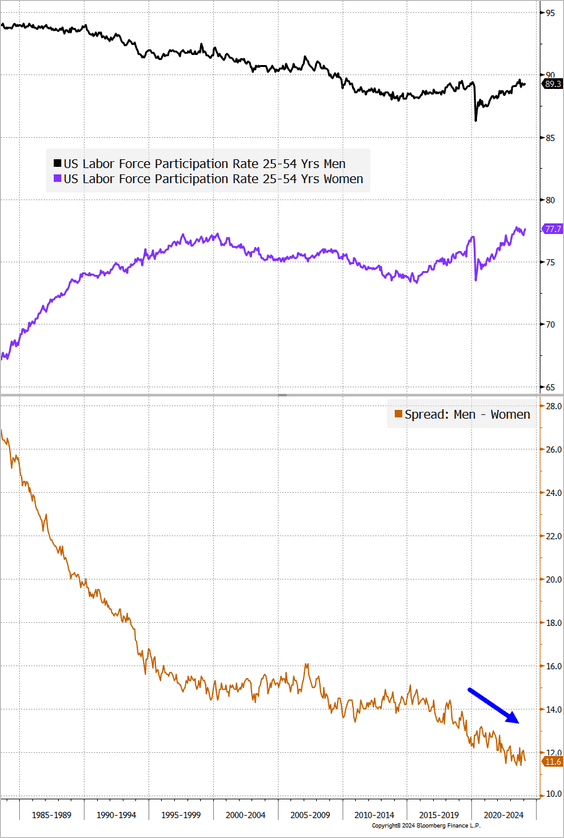
• Prime-age labor force participation is back near the highs.
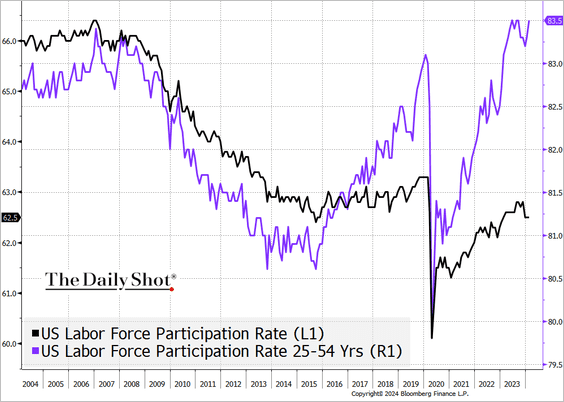
– The gap between labor force participation rates among men and women continues to narrow.
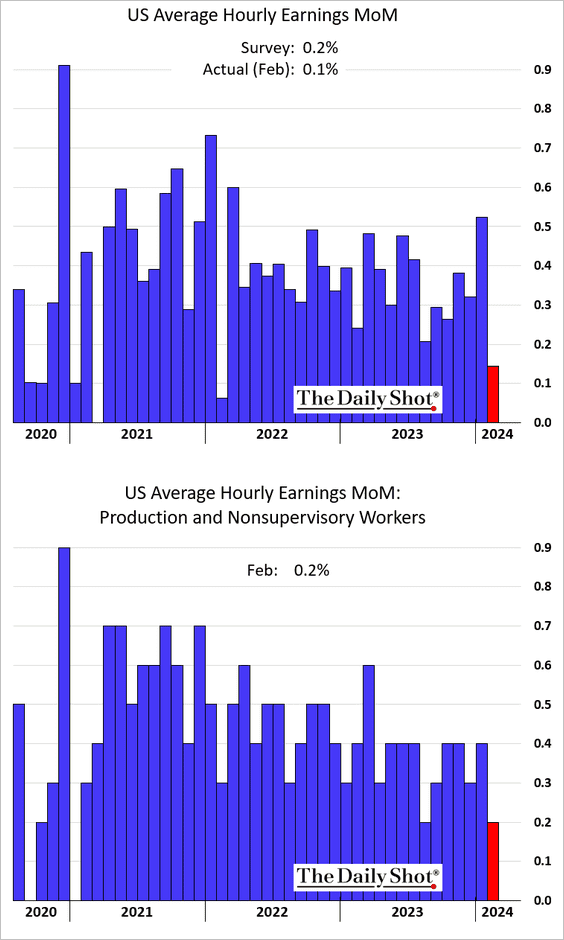
• Wage growth slowed last month.
——————–
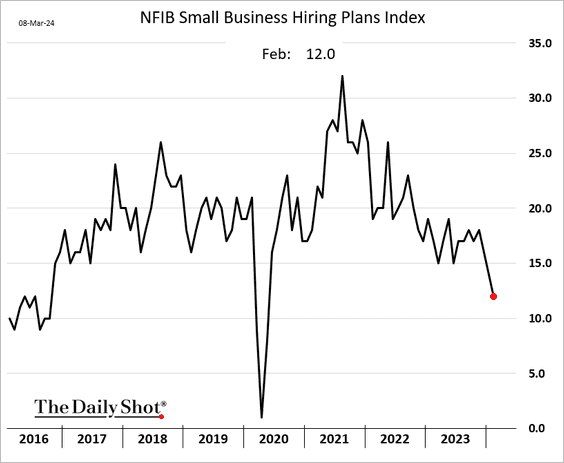
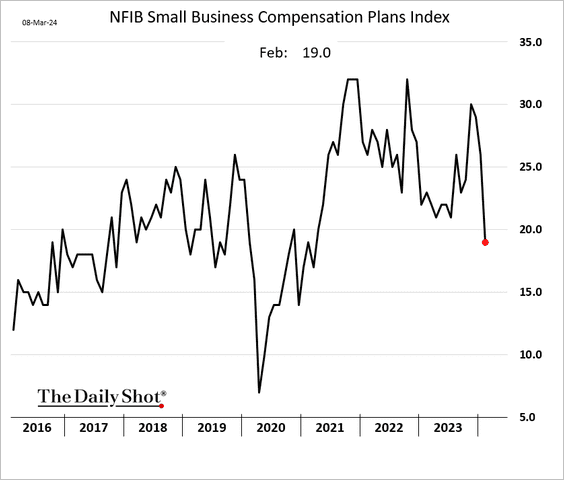
2. The NFIB reported another decline in small businesses intending to hire or increase wages, reinforcing the trend of a softening labor market.
– Hiring plans:
– Compensation plans:
——————–
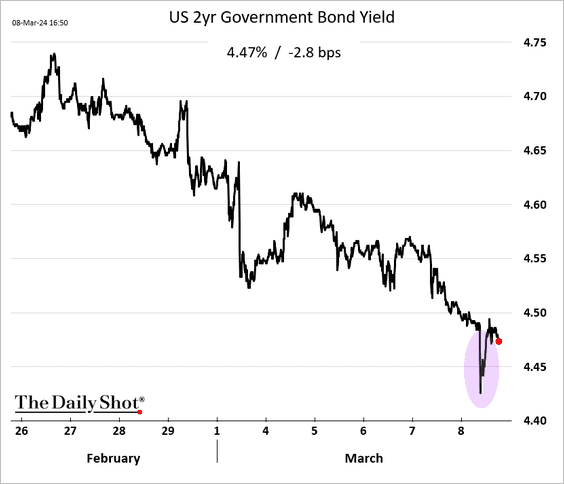
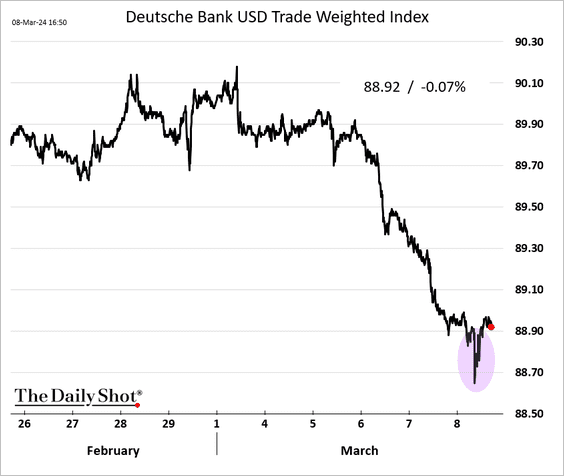
3. The markets’ reaction to the payrolls report was muted.
• Stock prices edged lower.
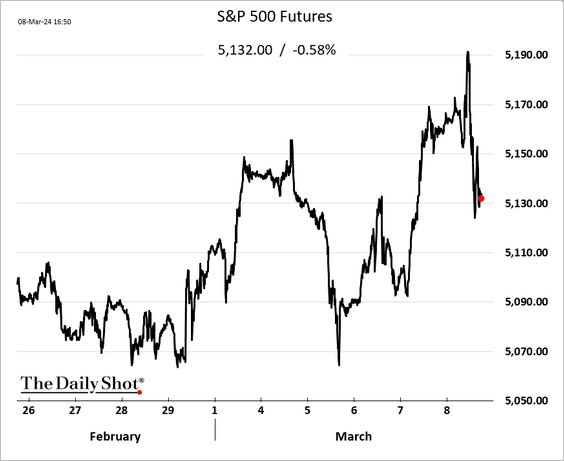
• Bond yields and the dollar initially fell in response to the jobs report but subsequently rebounded.
——————–
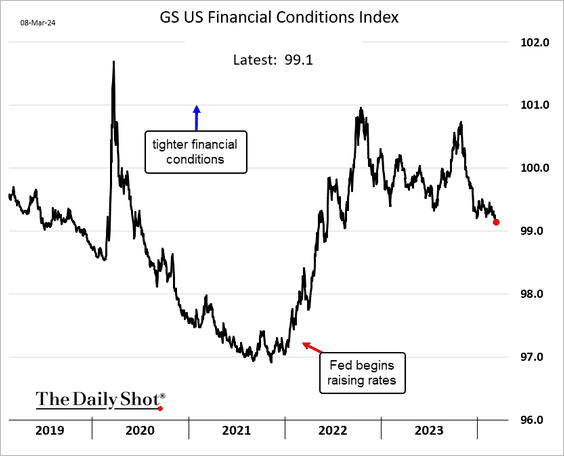
4. Financial conditions have been easing.
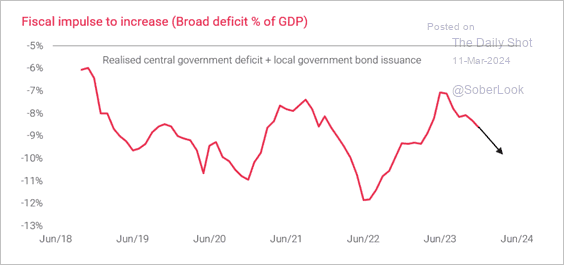
5. This chart shows the US fiscal policy contributions to GDP growth.
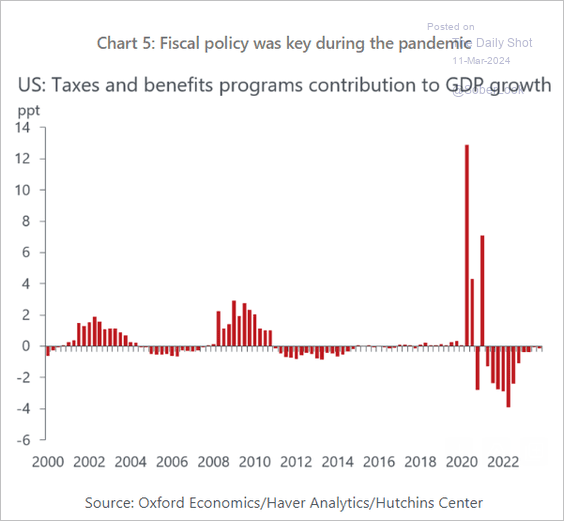 Source: Oxford Economics
6. Truckload demand is improving, which could signal an upturn in the manufacturing PMI.
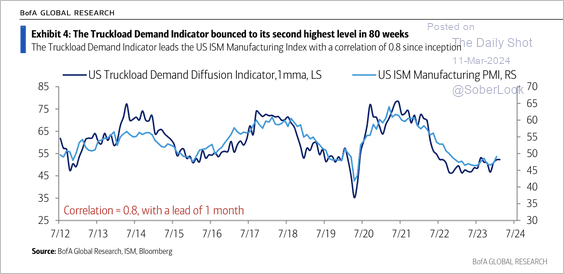 Source: BofA Global Research
Back to Index
Canada
1. The jobs report from last month showed strength, featuring a significant increase in full-time employment
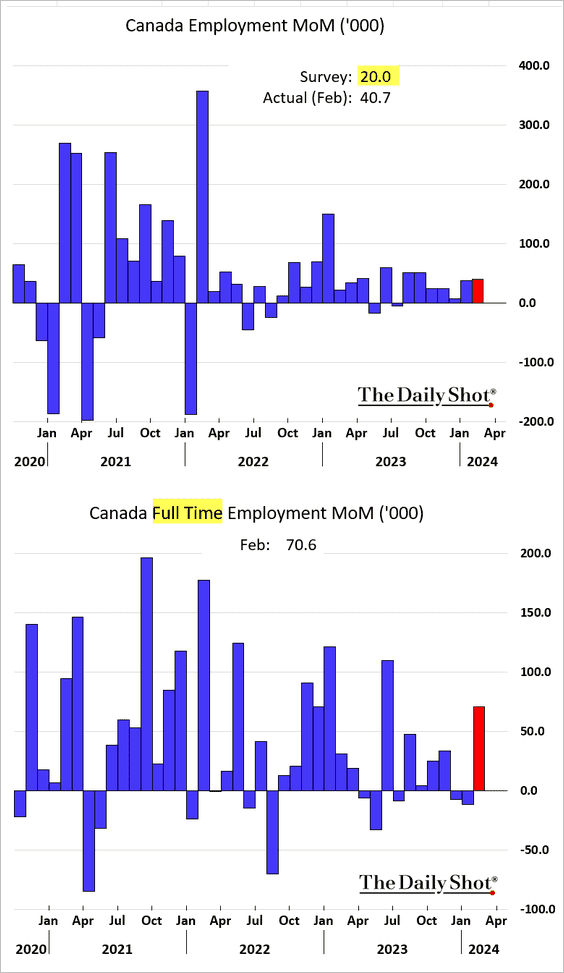
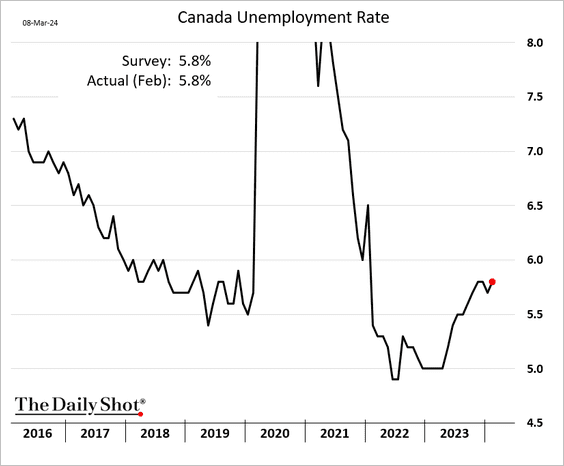
• The unemployment rate edged higher.
• The labor force participation rate was unchanged.
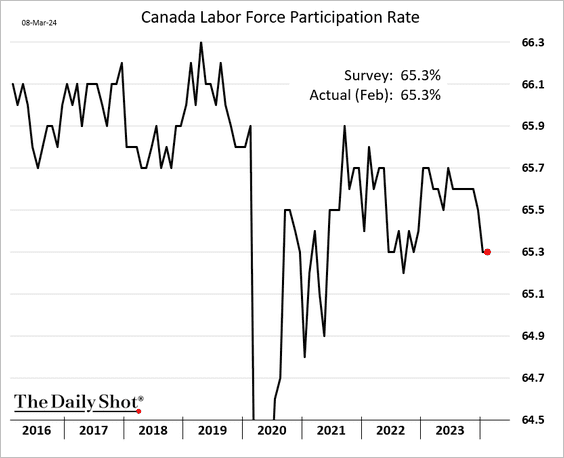
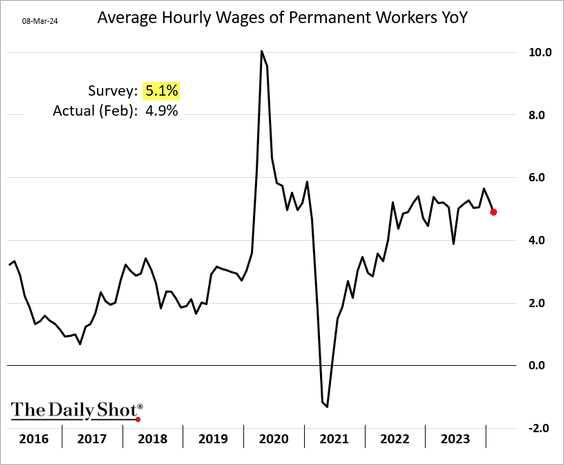
• Wage growth slowed.
——————–
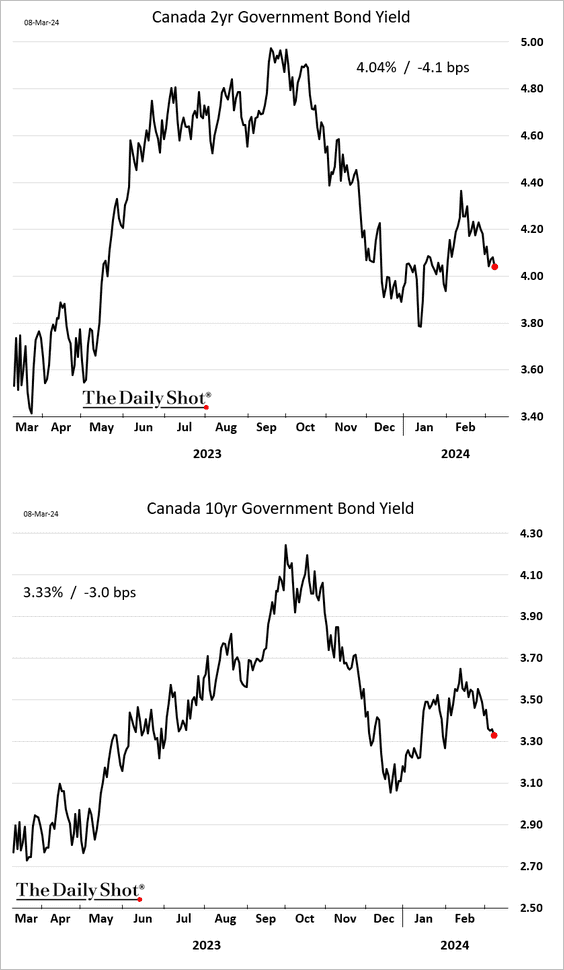
2. Traders boosted their bets on the July rate cut.
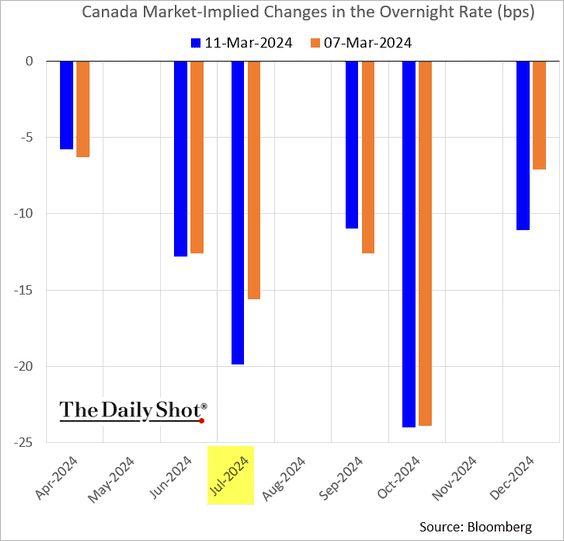
Bond yields continue to trend lower.
——————–
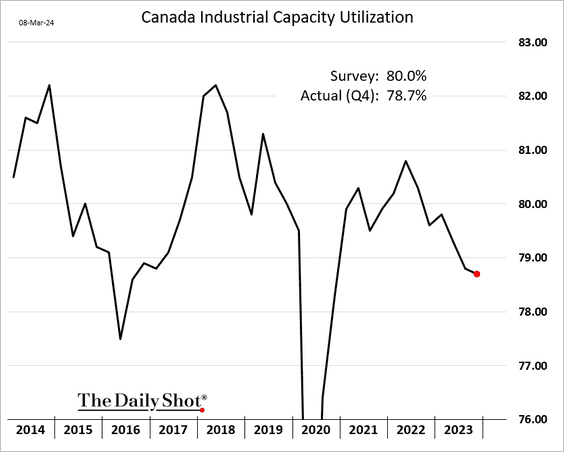
3. Industrial capacity utilization eased further last quarter.
4. Business insolvencies have been surging.
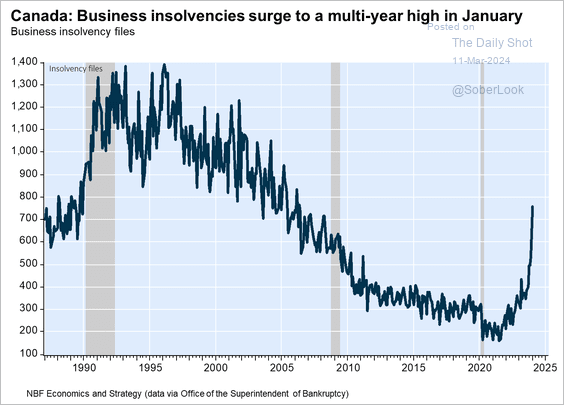 Source: Economics and Strategy Group, National Bank of Canada
Back to Index
The United Kingdom
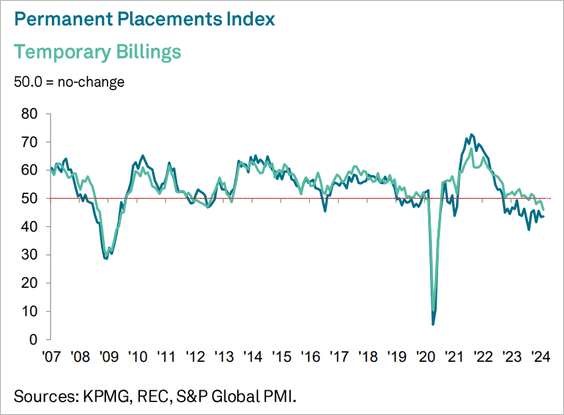
1. The employment PMI signals a contraction in permanent placements and temp agency billings.
2. Wage growth remains elevated.
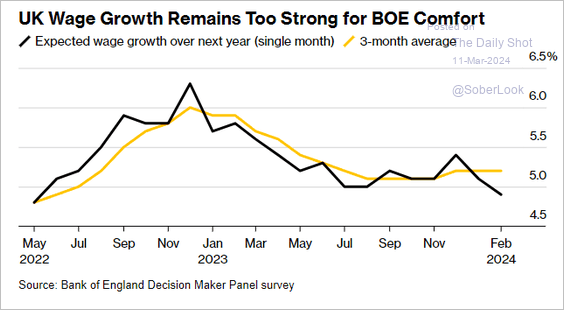 Source: @economics Read full article
3. The pound is testing short-term resistance.
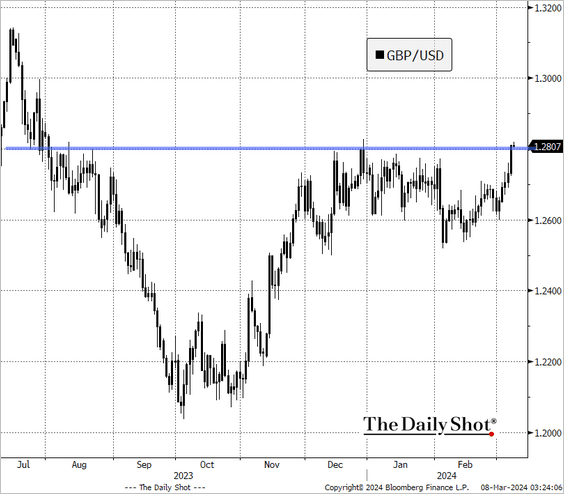 Source: @TheTerminal, Bloomberg Finance L.P.
Back to Index
Europe
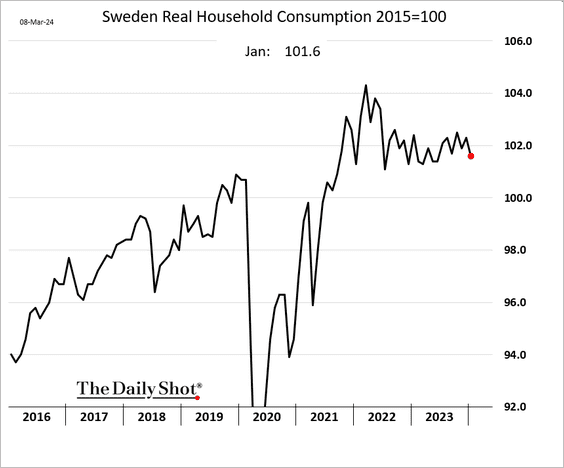
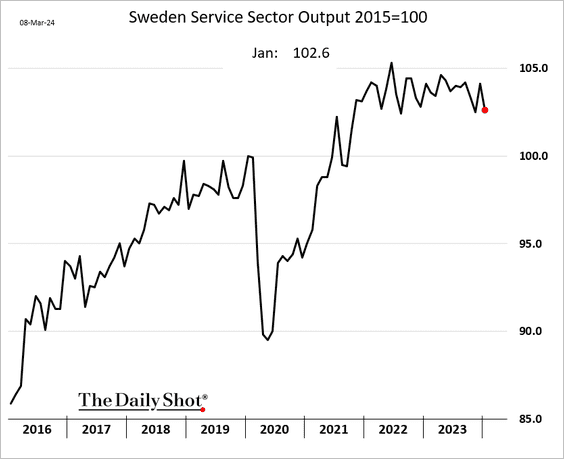
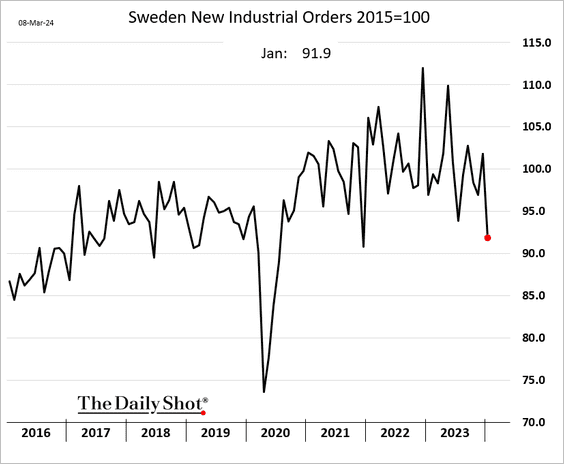
1. Sweden’s domestic economic activity softened in January.
• Household consumption:
• Services output:
• Industrial production was higher, …
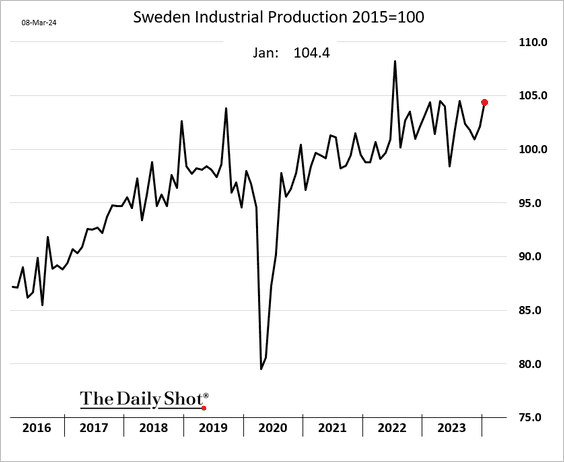
… but new orders slowed sharply.
——————–
2. What are the EU’s most imported goods from China?
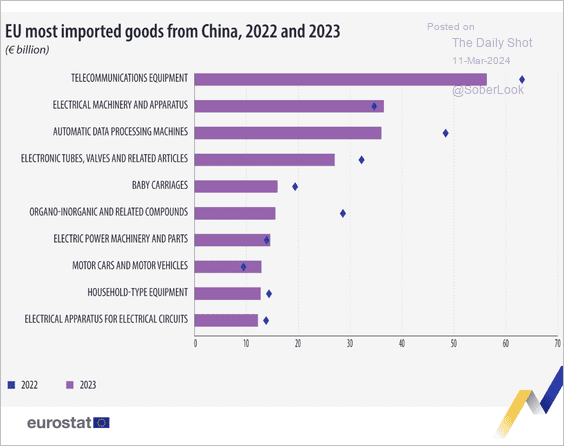 Source: Eurostat Read full article
3. Here is the production share by country for key fruits, berries, nuts, and vegetables in 2022.
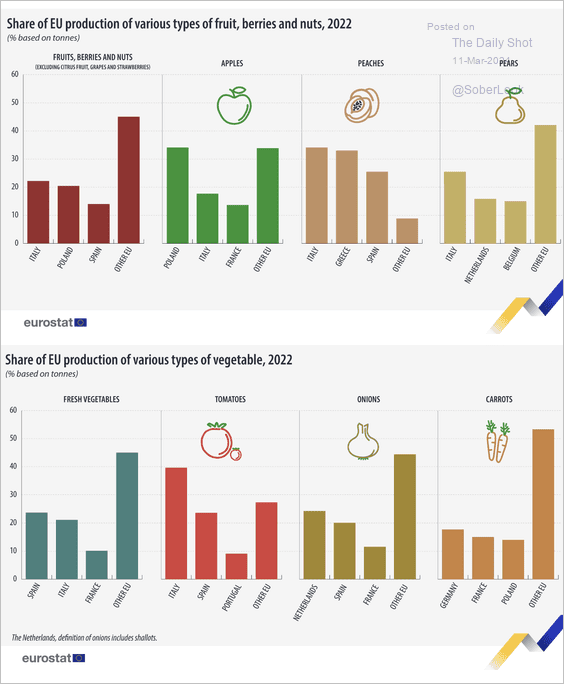 Source: Eurostat Read full article
Back to Index
Asia-Pacific
1. Japan avoided a technical recession based on the revised Q4 GDP figures.
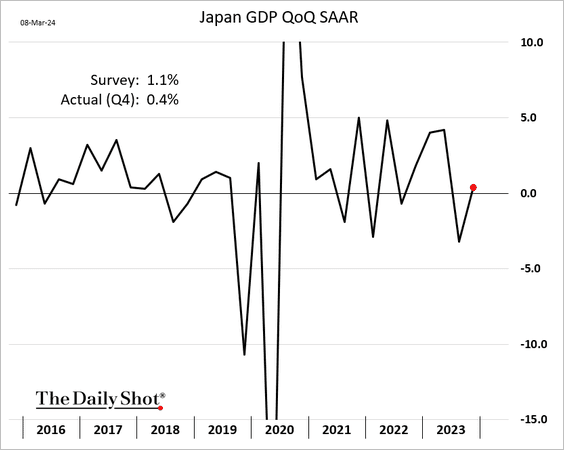
 Source: CNBC Read full article
——————–
2. Taiwan’s trade surplus surged last month.
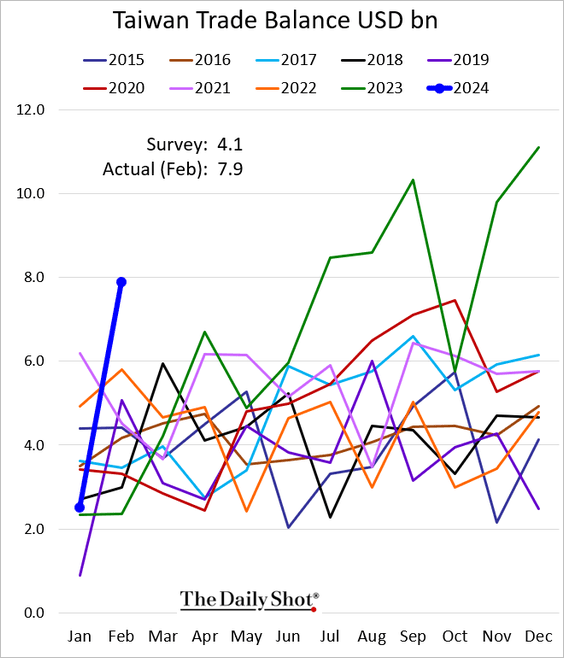
 Source: @economics Read full article
——————–
3. Australia’s trade surplus has been holding up well.
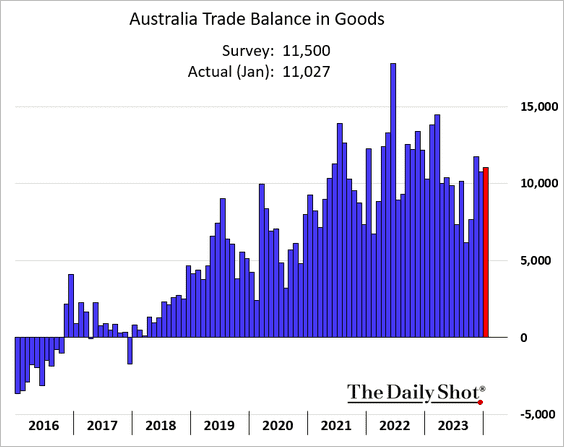
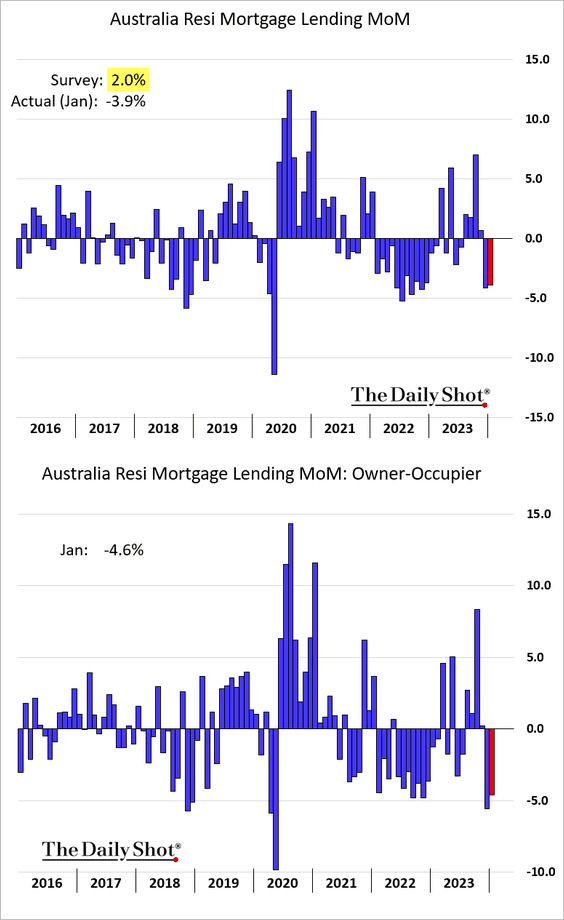
• Mortgage lending unexpectedly declined in January.
Back to Index
China
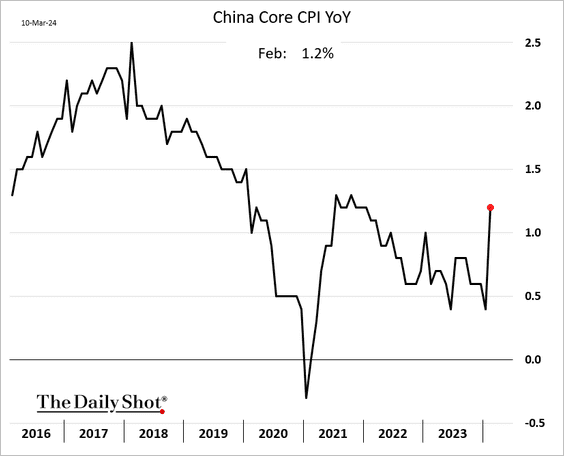
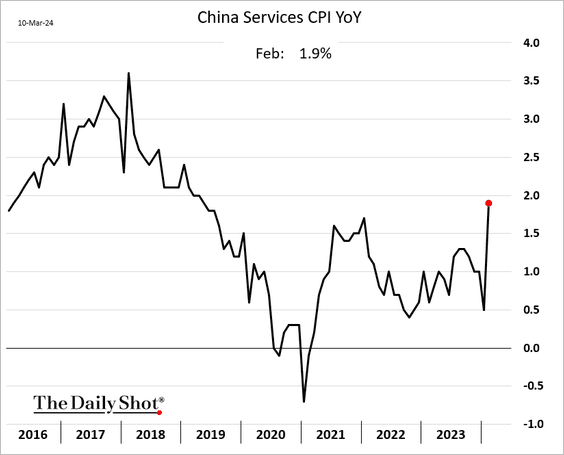
1. The CPI experienced a surge in February, largely attributed to the timing of the Lunar New Year holiday.
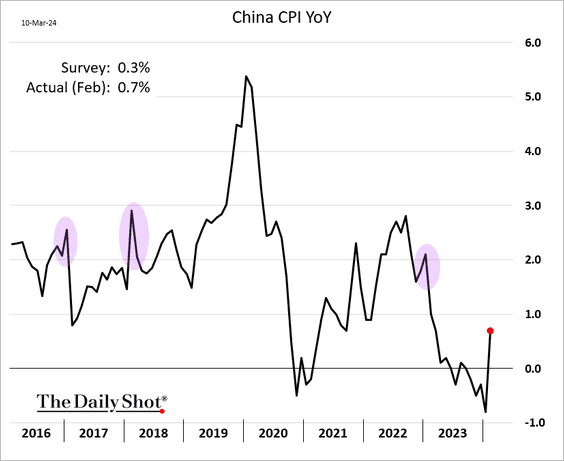
 Source: Reuters Read full article
——————–
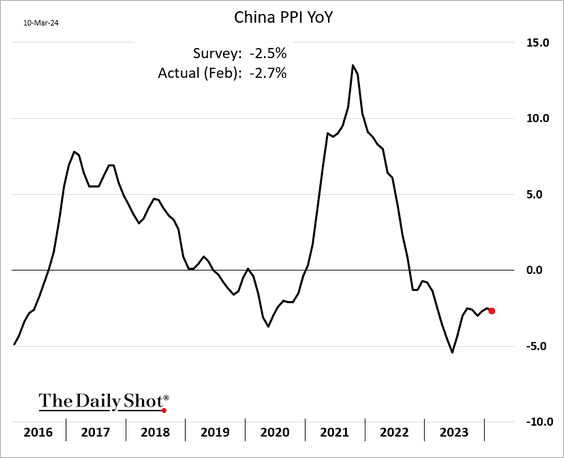
2. The PPI remains in negative territory.
3. Beijing is ramping up stimulus this year (2 charts).
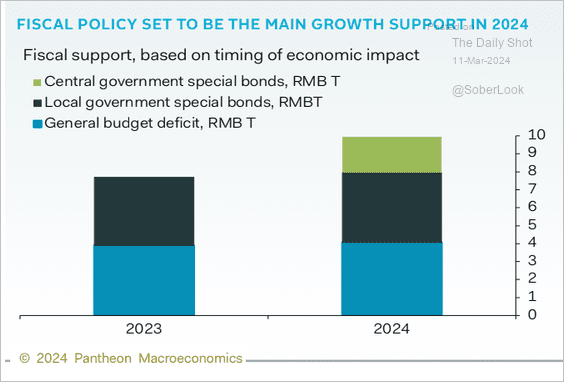 Source: Pantheon Macroeconomics
 Source: TS Lombard
——————–
4. The labor force participation rate for older workers is relatively low and falling. This could be due to forced retirement measures during 2015-2017 and COVID-related disruptions, according to Gavekal.
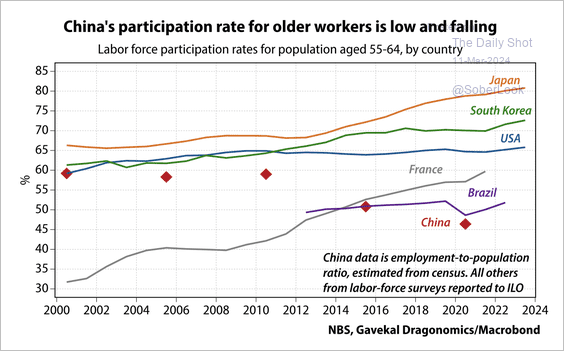 Source: Gavekal Research
Back to Index
Emerging Markets
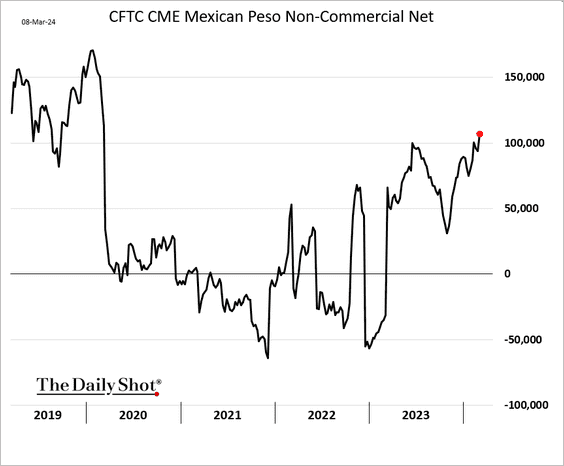
1. Speculative accounts are boosting their bets on the Mexican peso.
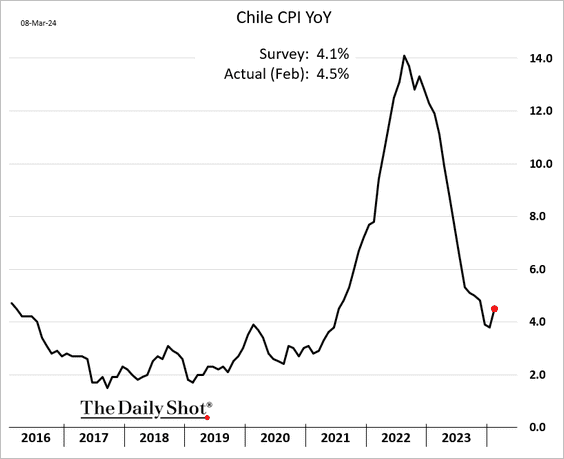
2. The increase in Chile’s CPI limits the scope for substantial rate cuts.
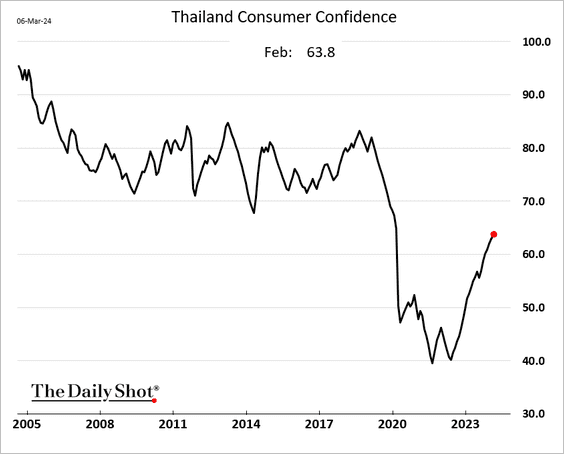
3. Thai consumer confidence is rebounding.
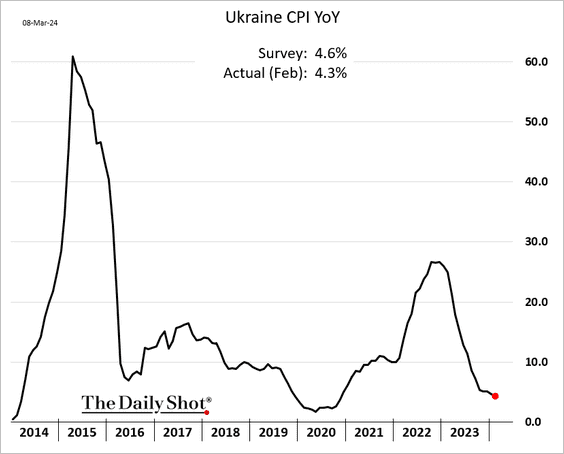
4. Ukraine’s CPI continues to trend lower.
5. EM local-currency sovereign bond yields are historically low relative to Treasury yields.
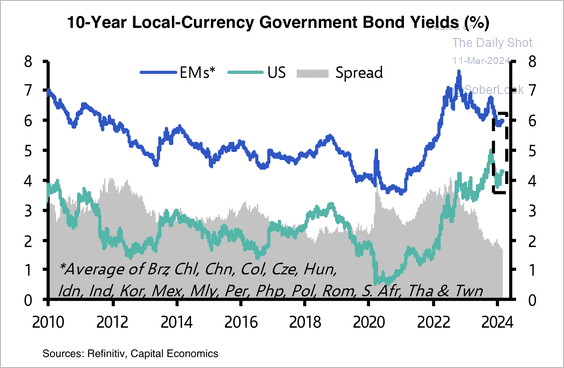 Source: Capital Economics
Local-currency yields are generally below their post-financial crisis averages in EM Asia but above them in EM Europe, LatAm, and South Africa.
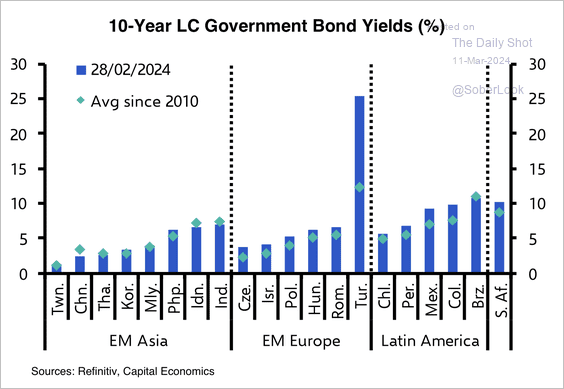 Source: Capital Economics
——————–
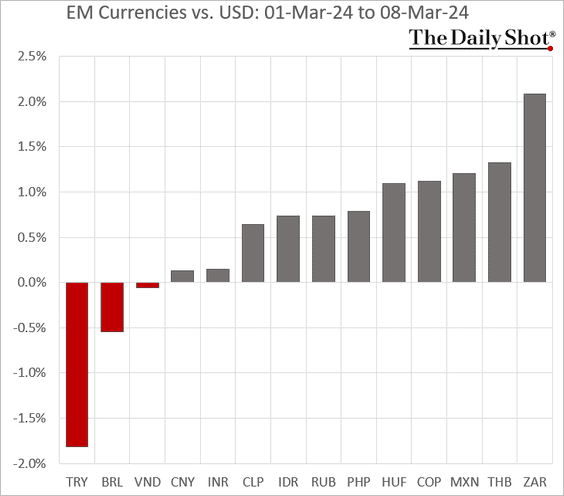
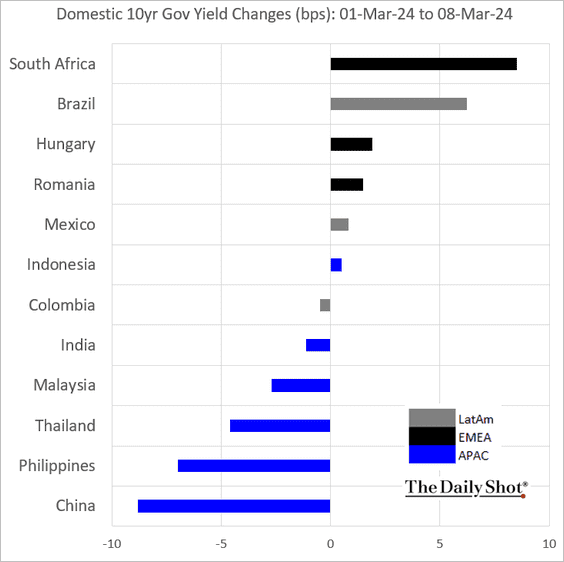
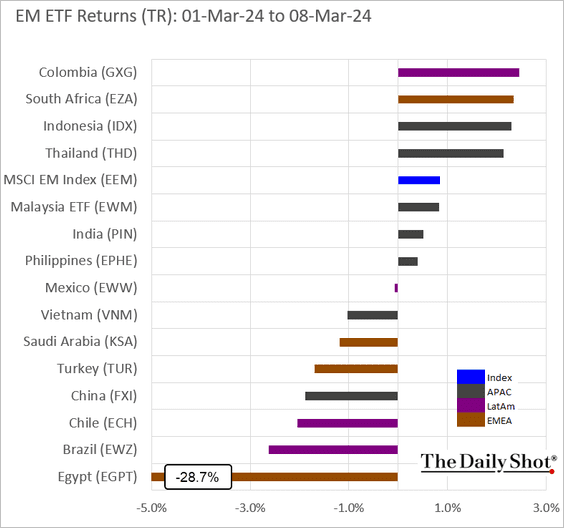
6. Next, we have some performance data from last week.
• Currencies:
• Bond yields:
• Equity ETFs:
Back to Index
Cryptocurrency
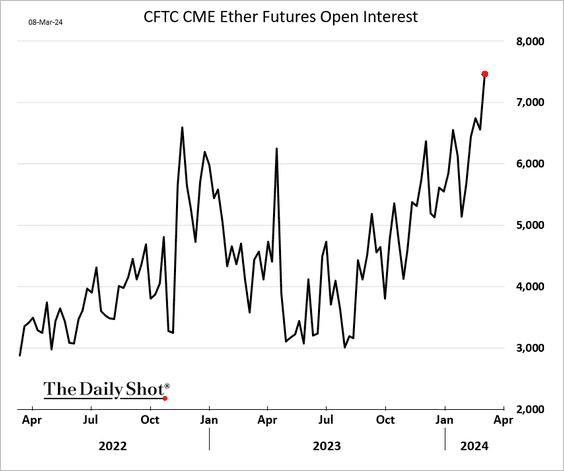
1. Open interest in the CME ether futures has been surging.
2. There is an active market for bitcoin call options with strikes near $100k.
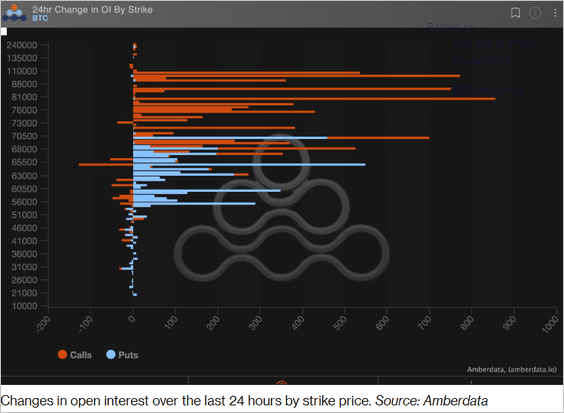 Source: @crypto Read full article
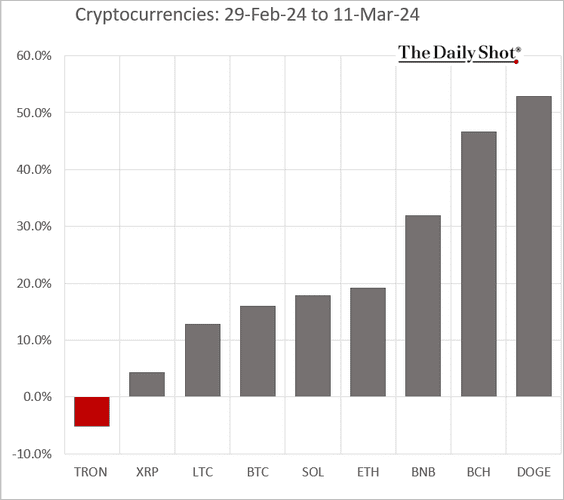
3. Here is the month-to-date performance for select cryptos.
Back to Index
Commodities
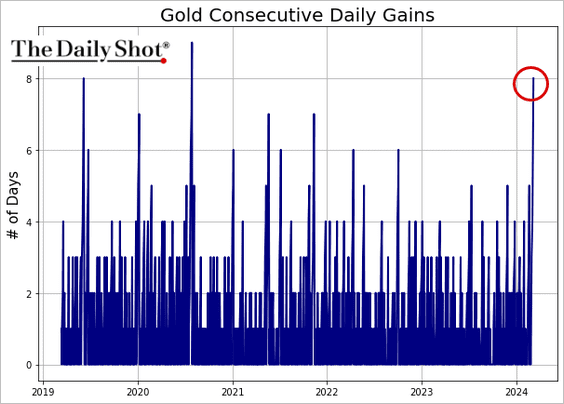
1. Gold has been up for eight consecutive trading sessions.
• Gold miners continue to underperform gold.
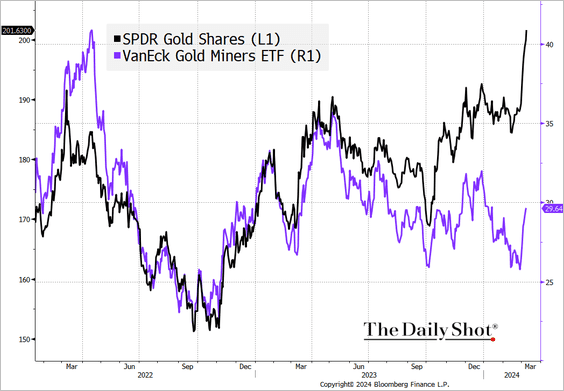 Source: @TheTerminal, Bloomberg Finance L.P.
• ETFs’ gold holdings keep sinking even as prices surge.
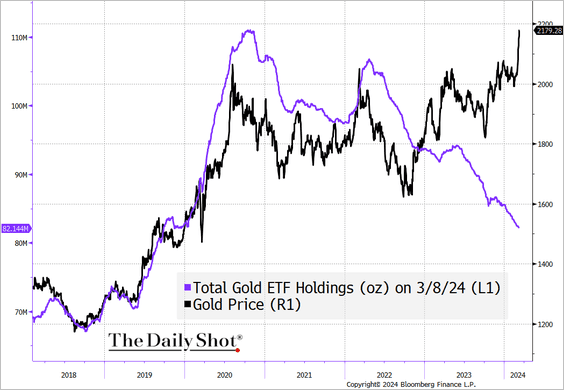 Source: @TheTerminal, Bloomberg Finance L.P.
• The silver/gold ratio has diverged from BCA’s US economic sentiment indicator (difference between equity valuations and bond valuations).
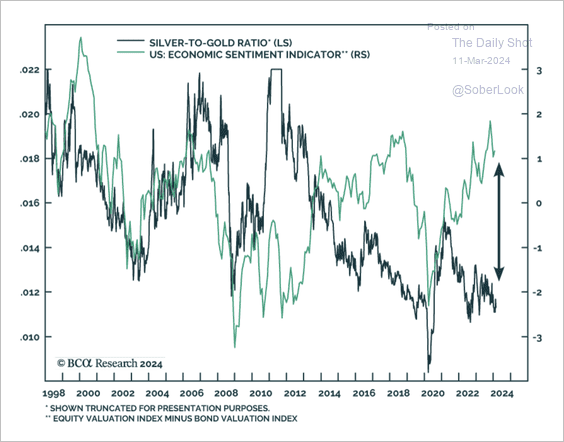 Source: BCA Research
——————–
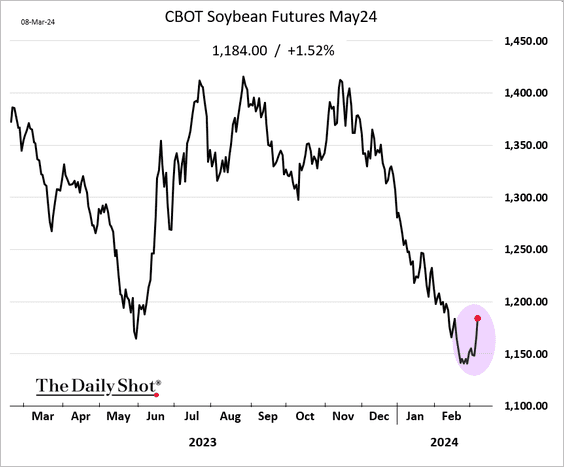
2. Soybean futures’ bearish positioning is stretched.
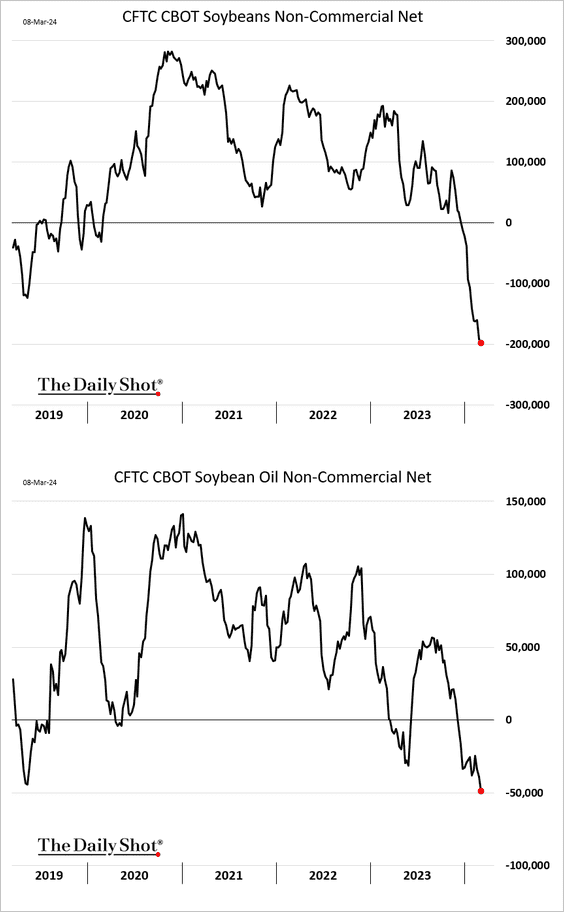
Will the rebound continue?
——————–
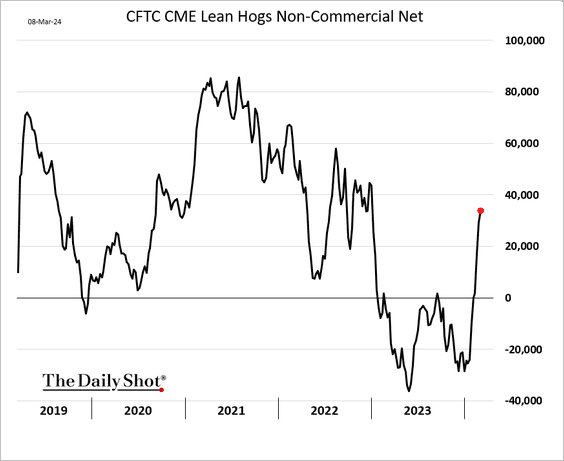
3. Traders are boosting their bets on hog futures.
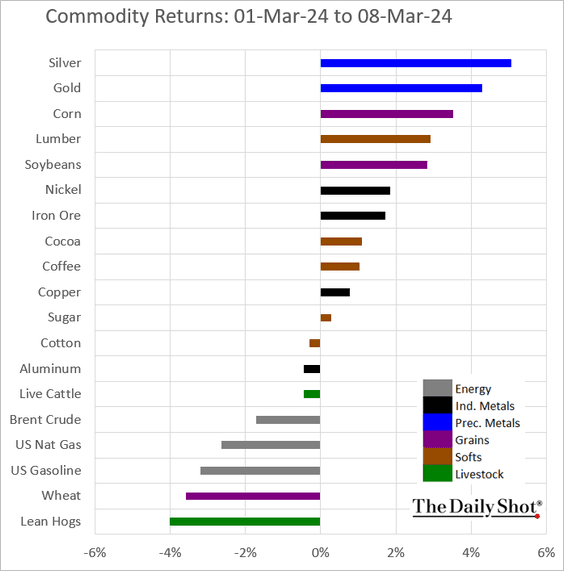
4. Here is last week’s performance across key commodity markets.
Back to Index
Equities
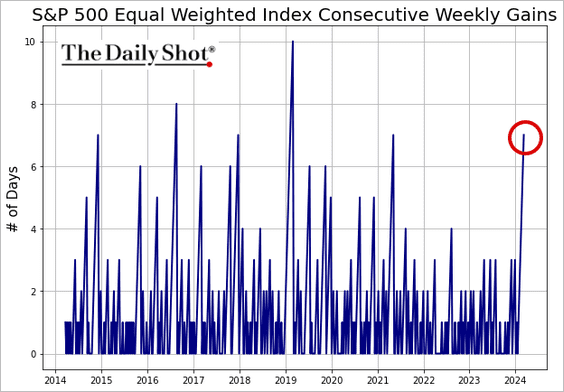
1. Midcaps and the average S&P 500 stock have been outperforming the S&P 500.
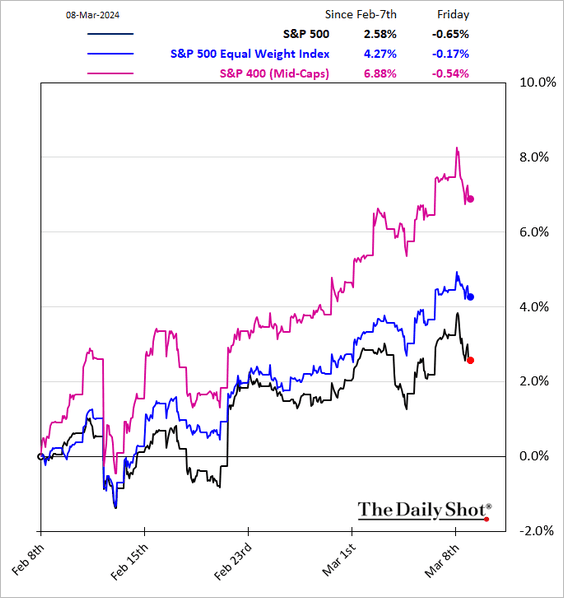
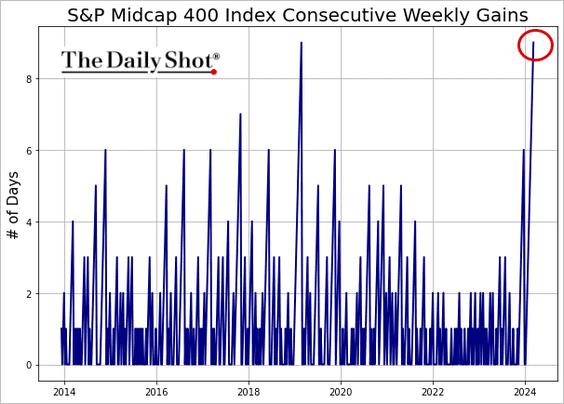
• Midcaps have been up for nine consecutive weeks.
– The S&P 500 Equal Weighted Index has been up seven weeks in a row.
• US mid-cap valuations are at historically low levels relative to the S&P 500.
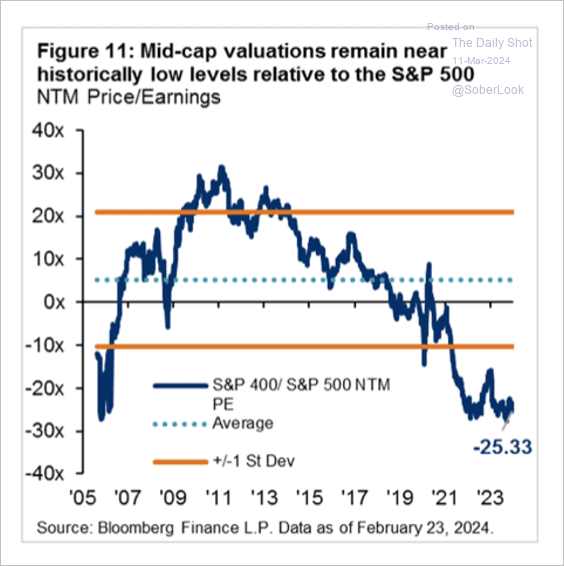 Source: JP Morgan Research
——————–
2. The S&P 500 is approaching overbought levels based on short-term breadth measures.
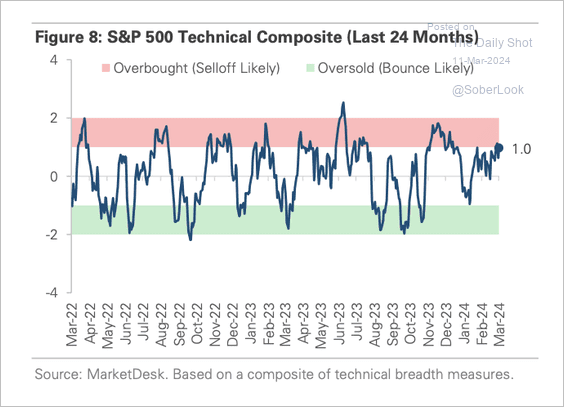 Source: MarketDesk Research
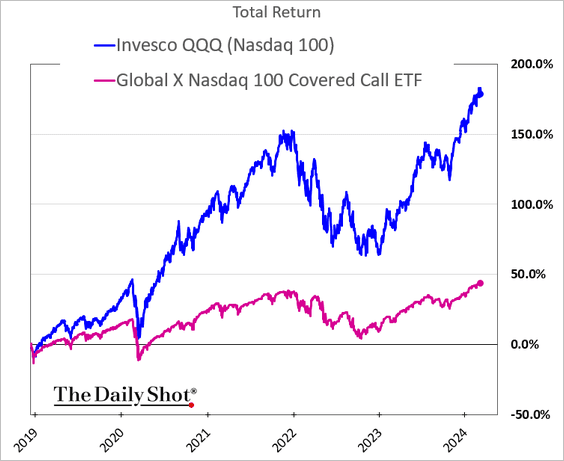
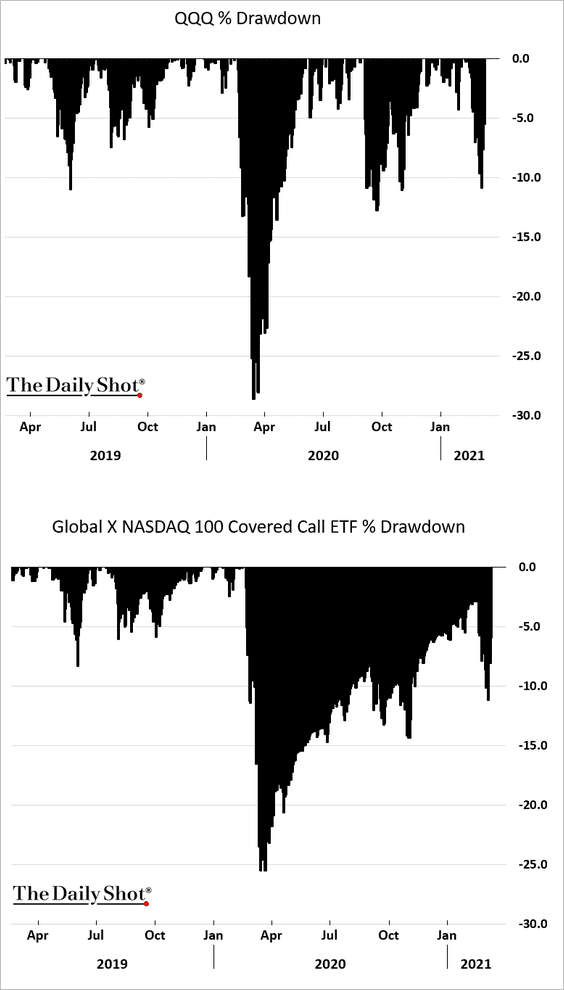
3. ETFs that use options strategies have become very popular.
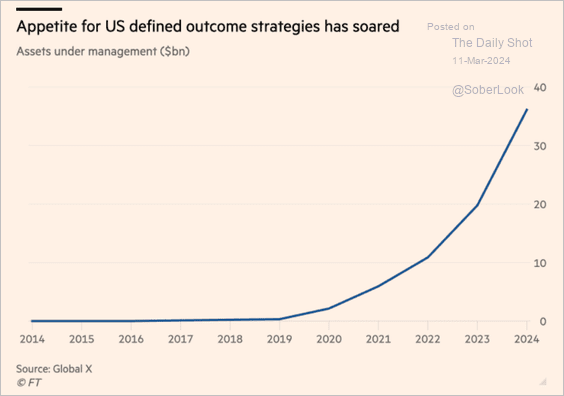 Source: @financialtimes Read full article
• Nasdaq 100 covered calls ETFs saw almost a 90% downside capture ratio in the initial COVID shock and a much slower recovery.
——————–
4. Goldman expects the Magnificent 7 firms to accelerate share buybacks.
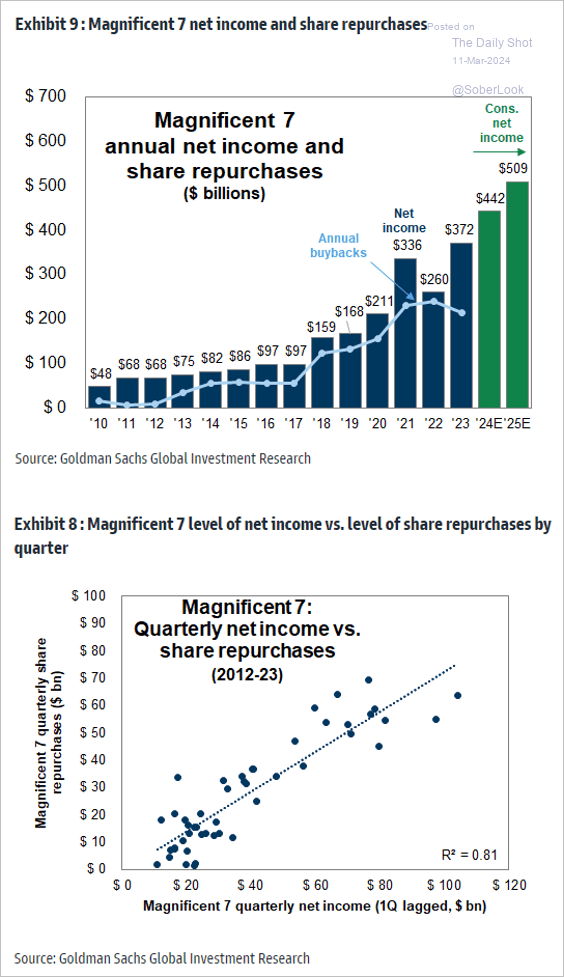 Source: Goldman Sachs; @MikeZaccardi
• The Magnificent 7 stocks’ return dispersion surged this year.
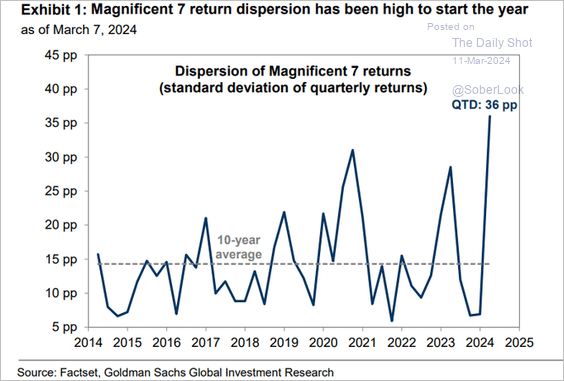 Source: Goldman Sachs; @MikeZaccardi
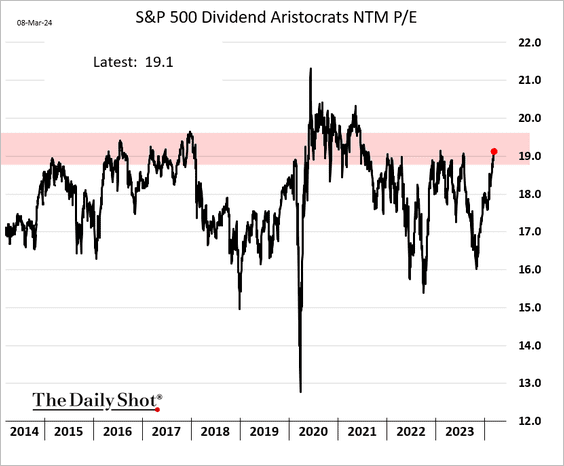
5. Dividend Aristocrat valuations are now in the upper range of their pre-COVID levels.
6. Historically, a “Misery Index” (unemployment plus inflation rate) reading of less than 6.1% has been consistent with current S&P 500 valuation levels. However, this could also point to a period of low forward returns.
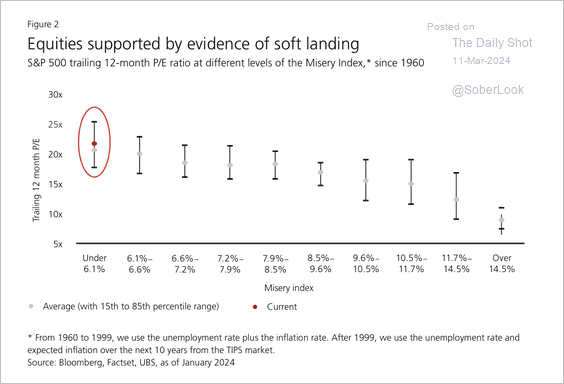 Source: UBS Research
7. Real estate funds are seeing robust inflows.
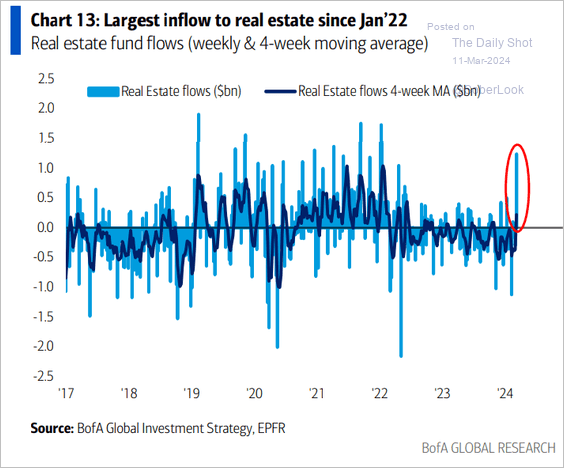 Source: BofA Global Research
• BofA’s private clients are buying REIT ETFs.
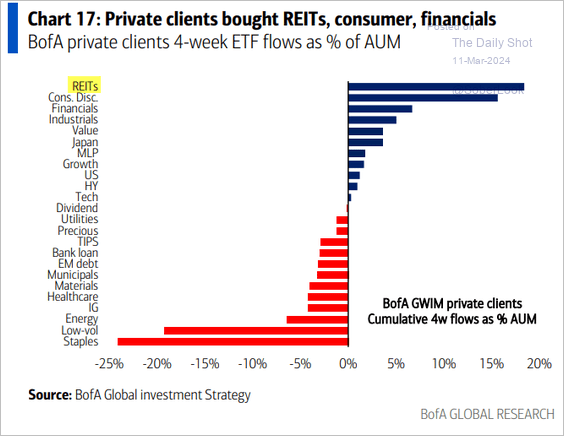 Source: Bank of America Institute
<-.>
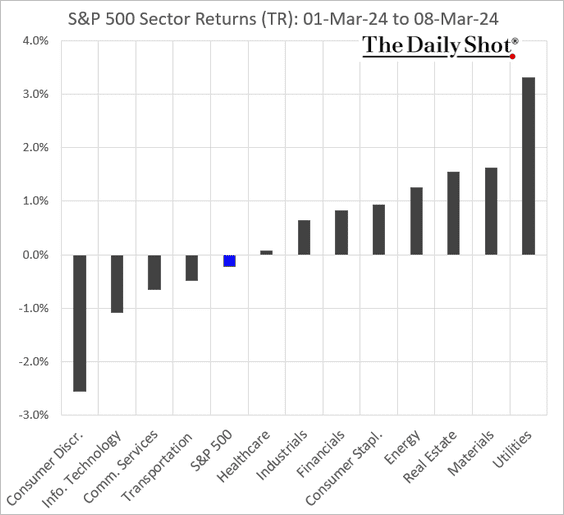
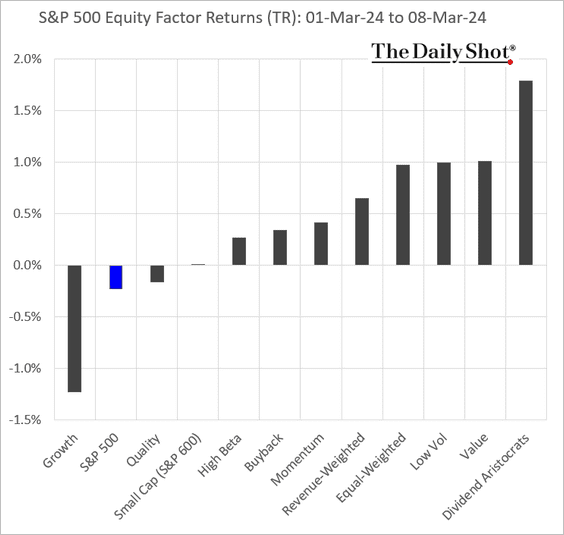
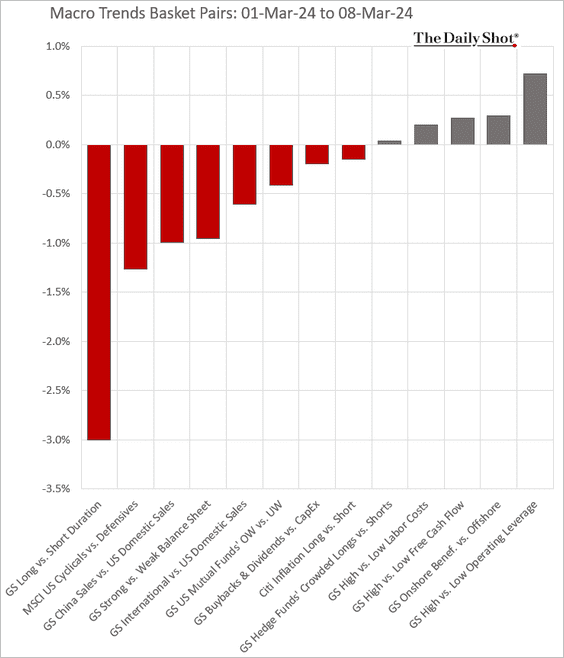
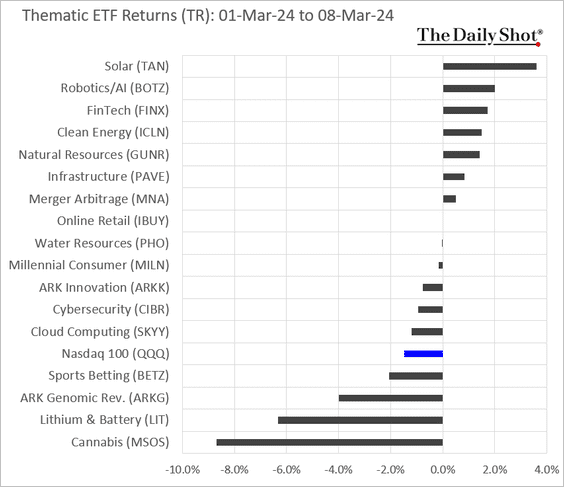
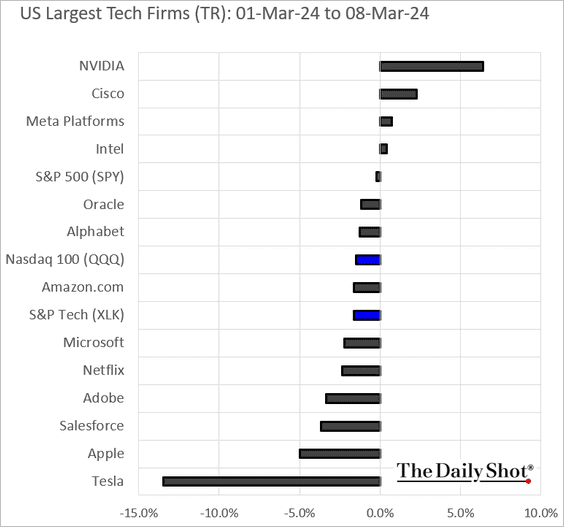
8. Finally, we have some performance data from last week.
• Sectors:
• Equity factors/styles:
• Macro basket pairs’ relative performance:
• Thematic ETFs:
• The largest US tech stocks:
Back to Index
Credit
1. US high-yield new-issue volume picked up last week.
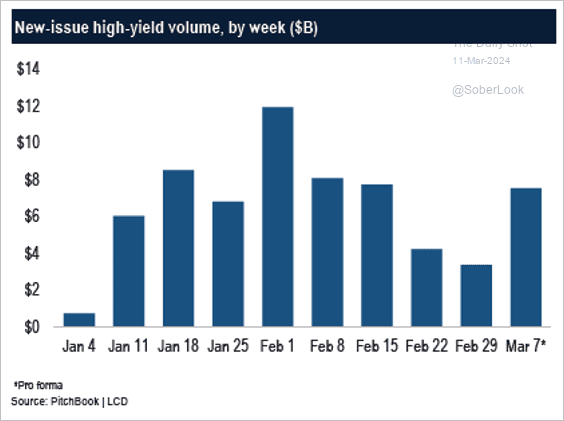 Source: PitchBook
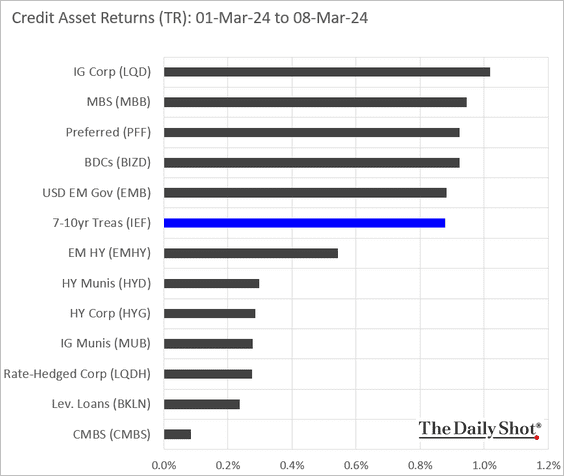
2. Here is last week’s performance across credit asset classes.
Back to Index
Global Developments
1. Cash tends to underperform in the later stages of a rate-hike cycle and during rate-cut cycles.
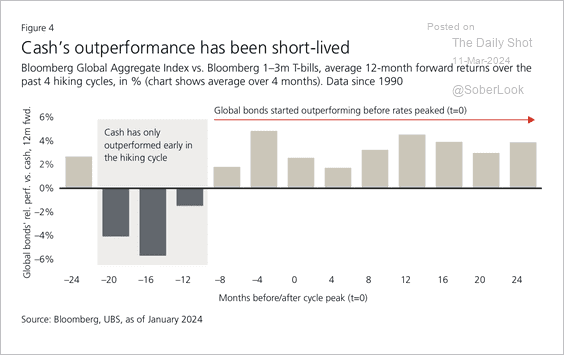 Source: UBS Research
2. Here is a look at Goldman’s forecast for central banks’ policy changes in the months ahead.
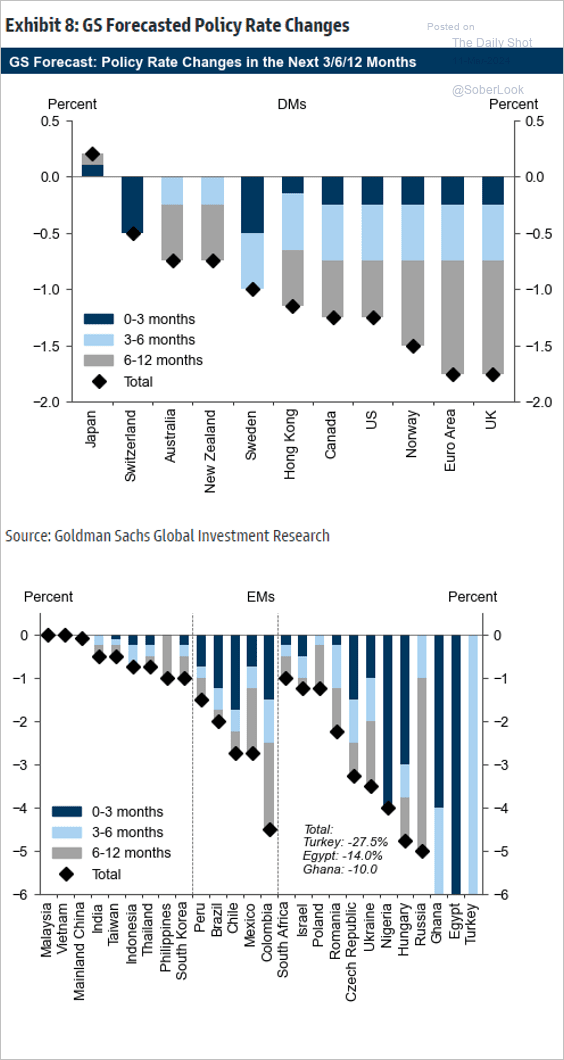 Source: Goldman Sachs; @MikeZaccardi
3. Services inflation has been sticky relative to historical inflation spikes.
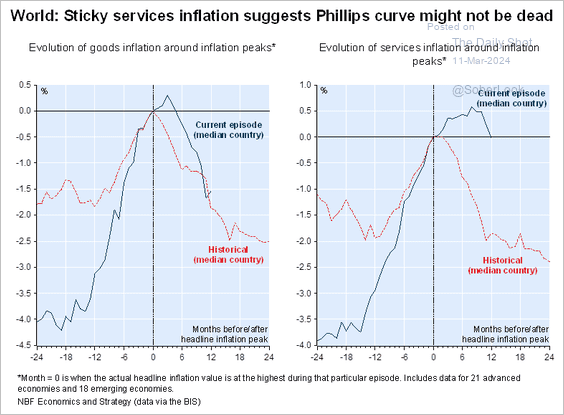 Source: Economics and Strategy Group, National Bank of Canada
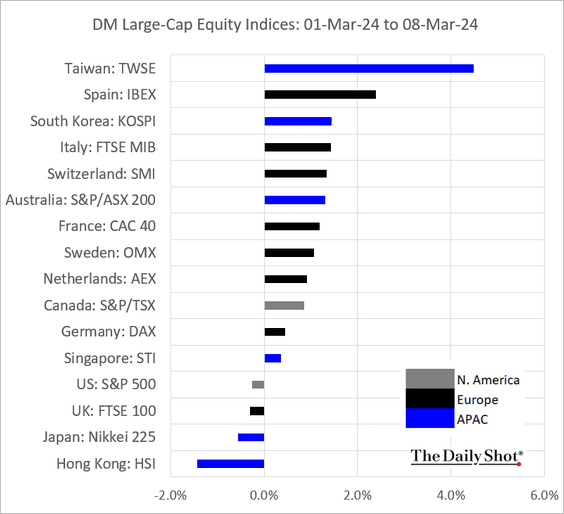
4. Finally, we have last week’s performance data.
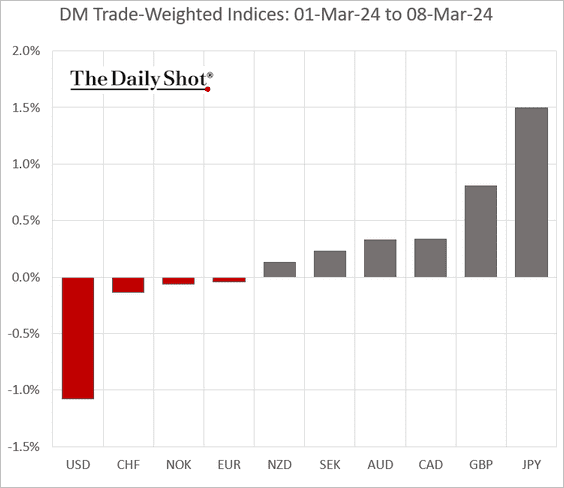
• Currencies:
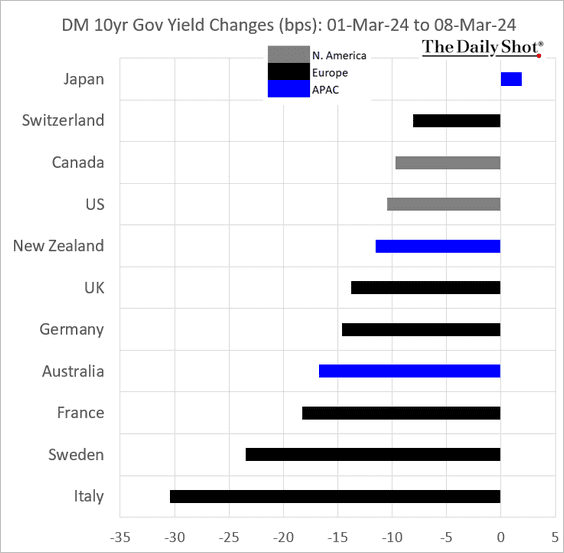
• Bond yields:
• Large-cap equity indices:
——————–
Food for Thought
1. 401(k) and IRA millionaires:
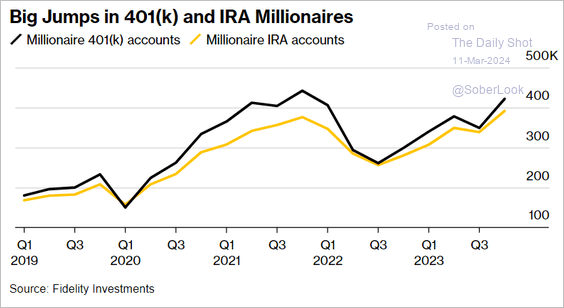 Source: @wealth Read full article
2. Market capitalization comparison of major US tech companies vs. European indices:
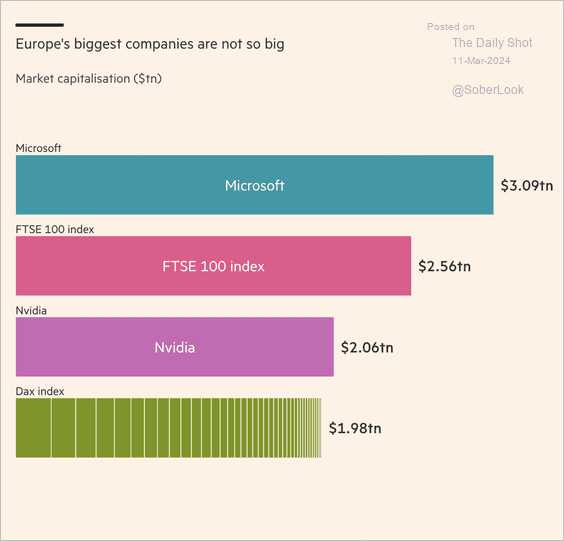 Source: @financialtimes Read full article
3. Smartphone shipments:
 Source: Statista
4. The luxury watch market:
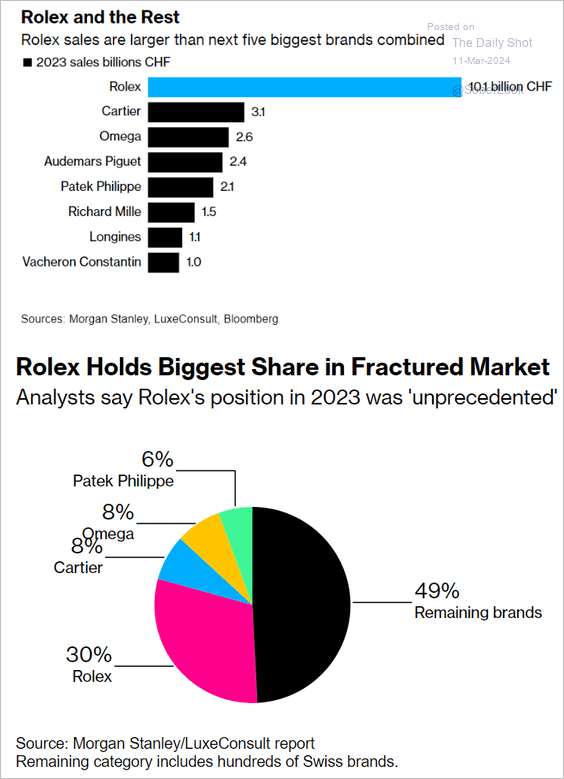 Source: @luxury Read full article
5. Russian military fatalities in Ukraine (estimates, demographics, and backgrounds):
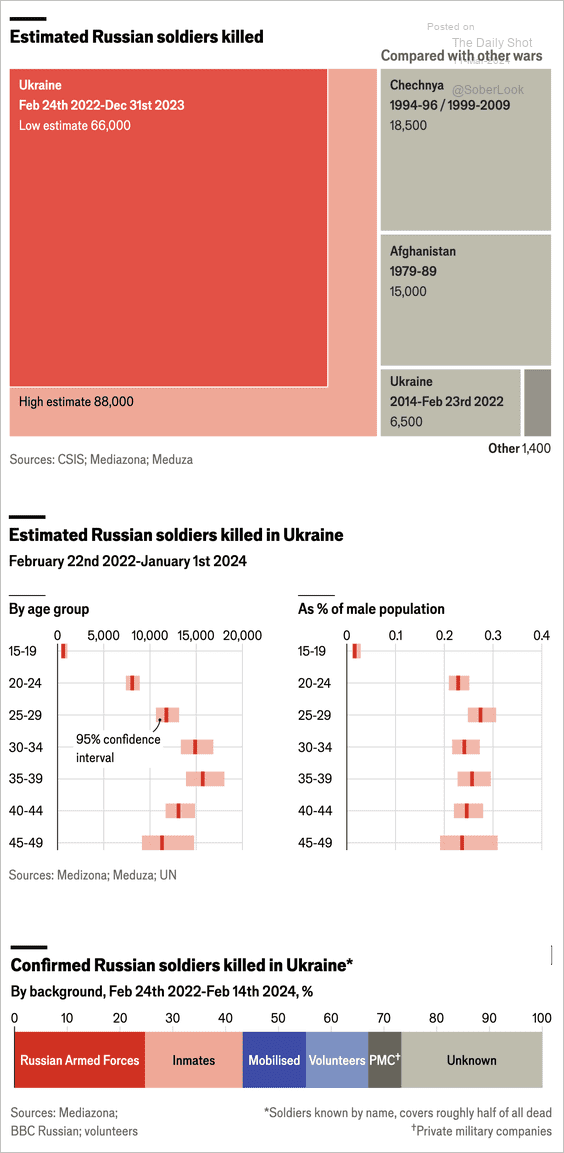 Source: The Economist Read full article
6. The ten states with the highest percentage of fatal crashes at night:
 Source: Omega Law Group
7. Duration of the daily Ramadan fast (2 charts):
 Source: Statista
 Source: Al Jazeera Read full article
——————–
Back to Index