
The Daily Shot: 03-Feb-21
• Administrative Update
• The United States
• The United Kingdom
• The Eurozone
• Asia – Pacific
• China
• Emerging Markets
• Commodities
• Energy
• Equities
• Credit
• Rates
• Global Developments
• Food for Thought
Administrative Update
If you suddenly stop receiving The Daily Shot or encounter other technical issues (such as navigation or image loading problems), please see the Technical Issues FAQ or contact us at [email protected].
Back to Index
The United States
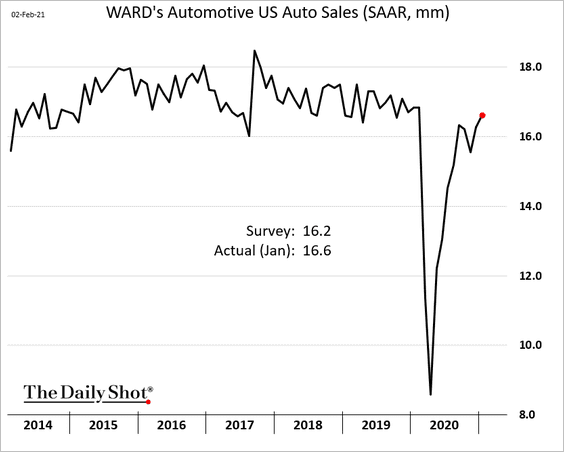
1. January automobile sales exceeded forecasts.
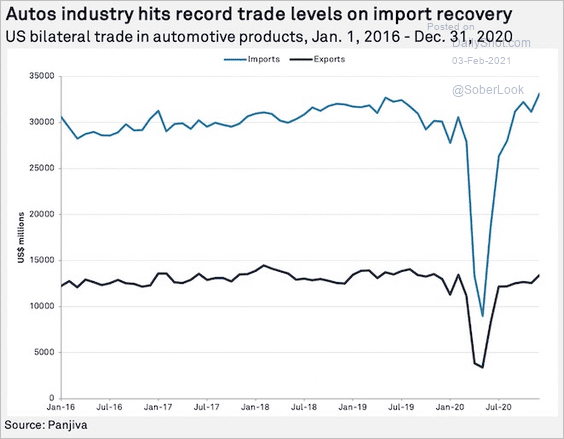
US automotive products international trade hit a record at the end of last year.
 Source: S&P Global Market Intelligence
——————–
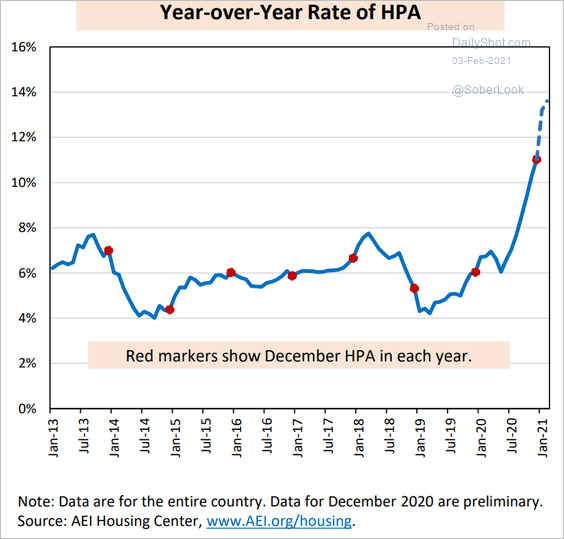
2. Next, we have some updates on housing.
• According to the AEI Housing Center, home price appreciation (HPA) is approaching 14% (per year).
 Source: AEI Housing Center
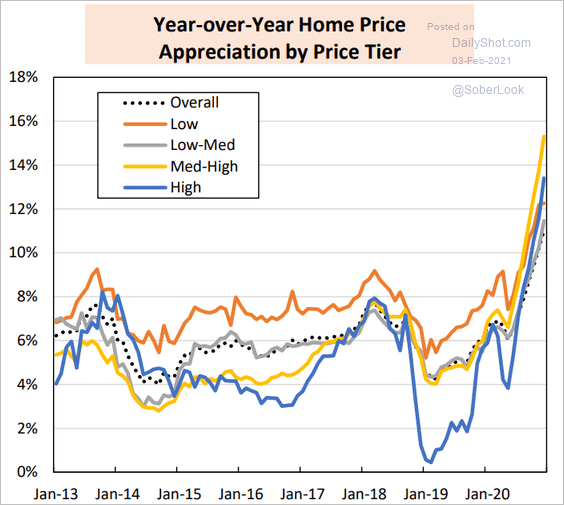
Below is the breakdown by price tier.
 Source: AEI Housing Center
• The Evercore ISI Homebuilders Survey hit a record high.
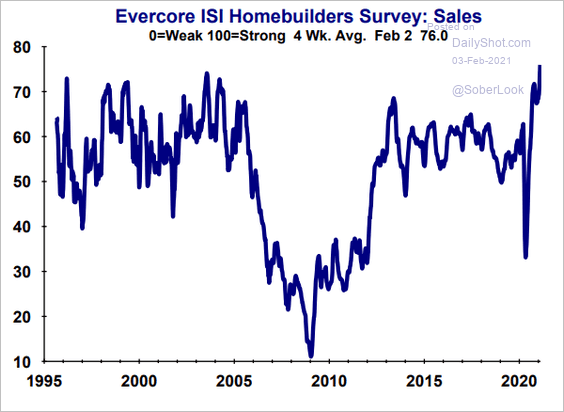 Source: Evercore ISI
——————–
3. Here are some updates on inflation.
• Will home price appreciation boost rent inflation and owners’ equivalent rent (OER) costs? Rent has been a significant drag on the CPI.
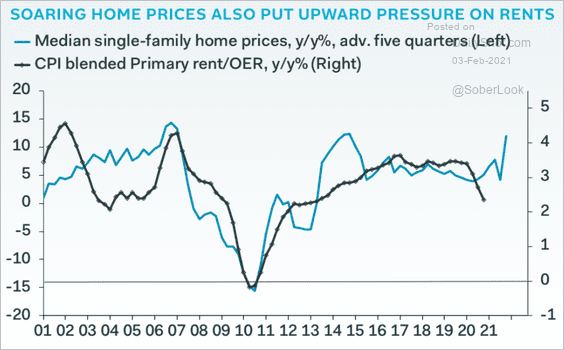 Source: Pantheon Macroeconomics
• High-frequency indicators suggest that rent inflation is already rebounding.
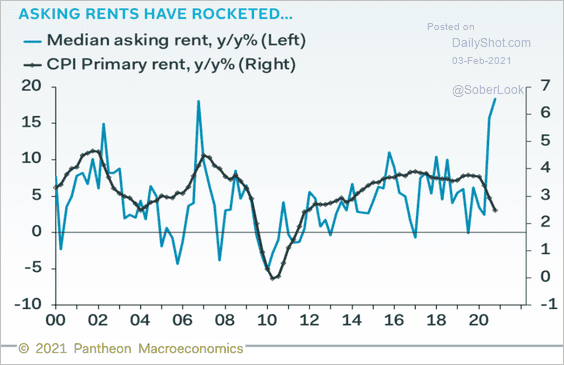 Source: Pantheon Macroeconomics
• As discussed yesterday, manufacturers’ prices paid are expected to put upward pressure on consumer inflation in the near-term.
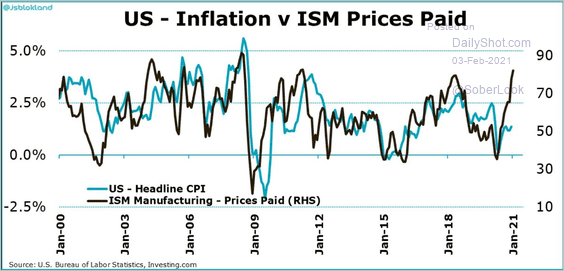 Source: @jsblokland
By the way, manufacturers’ prices-paid indicators have risen faster than prices received, suggesting some margin pressures.
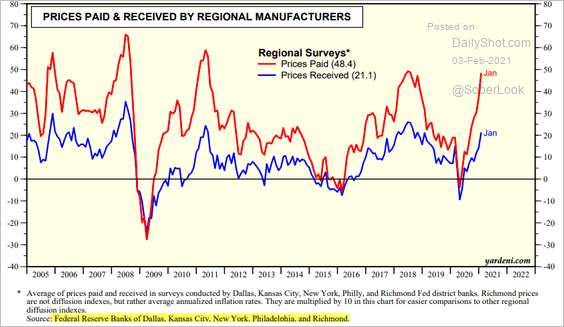 Source: Yardeni Research
• Rising output prices in China could also push US inflation higher.
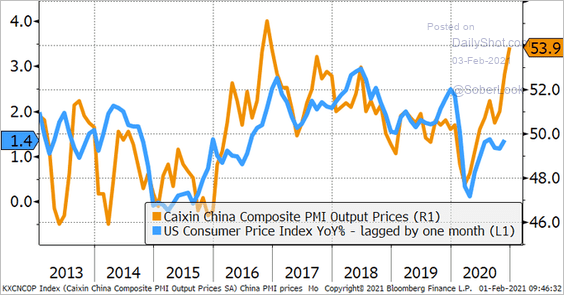 Source: @JeffreyKleintop
• What happens to the CPI if expenditure weights are rebalanced based on COVID-driven changes in spending patterns? See this discussion.
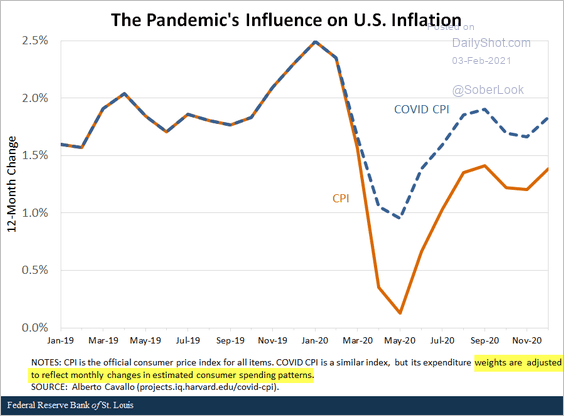 Source: @stlouisfed Read full article
——————–
4. Next, let’s take a look at the labor market.
• US semiconductor employment never recovered after the dot-com crash.
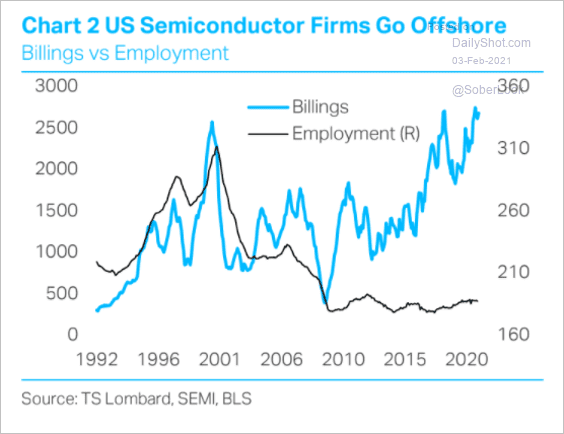 Source: TS Lombard
• The Paychex/IHS Markit Small Business Employment Index shows no signs of recovery.
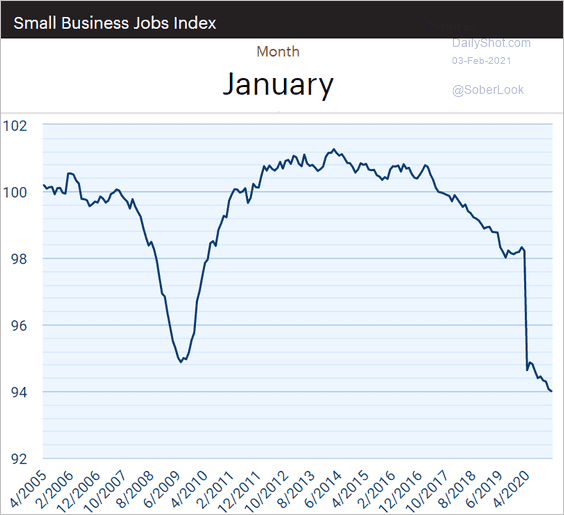 Source: Paychex | IHS Markit Small Business Employment Watch
• The Homebase small business employment index has been flat over the past month relative to the previous year. This would indicate a “flattish” payrolls report for January.
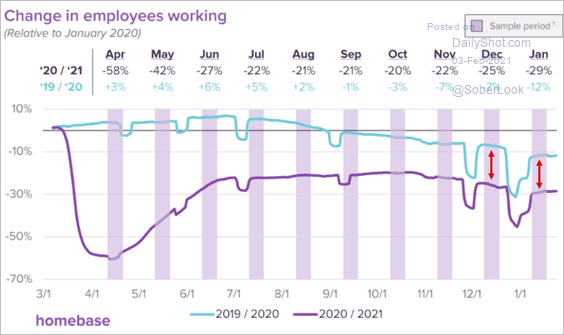 Source: @joinhomebase
And that is what the Oxford Economics’ projection shows.
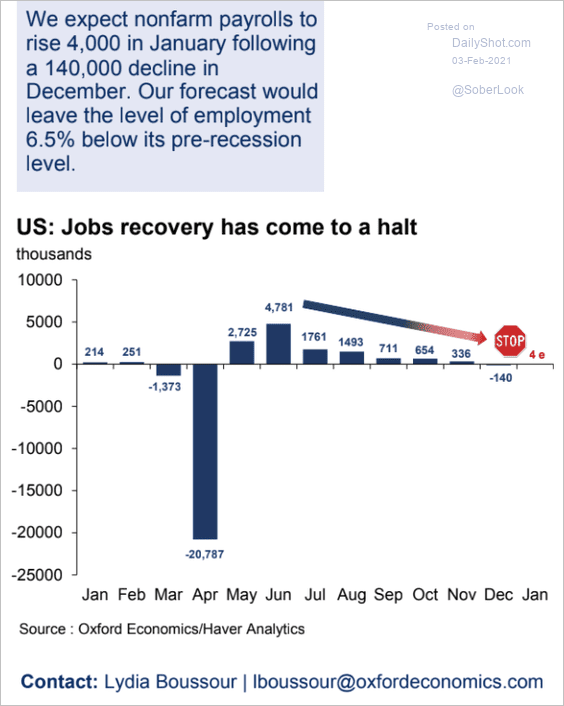 Source: Oxford Economics
——————–
5. What are the differences between the Gang of 10 and Biden’s stimulus plans?
• Dollar allocations:
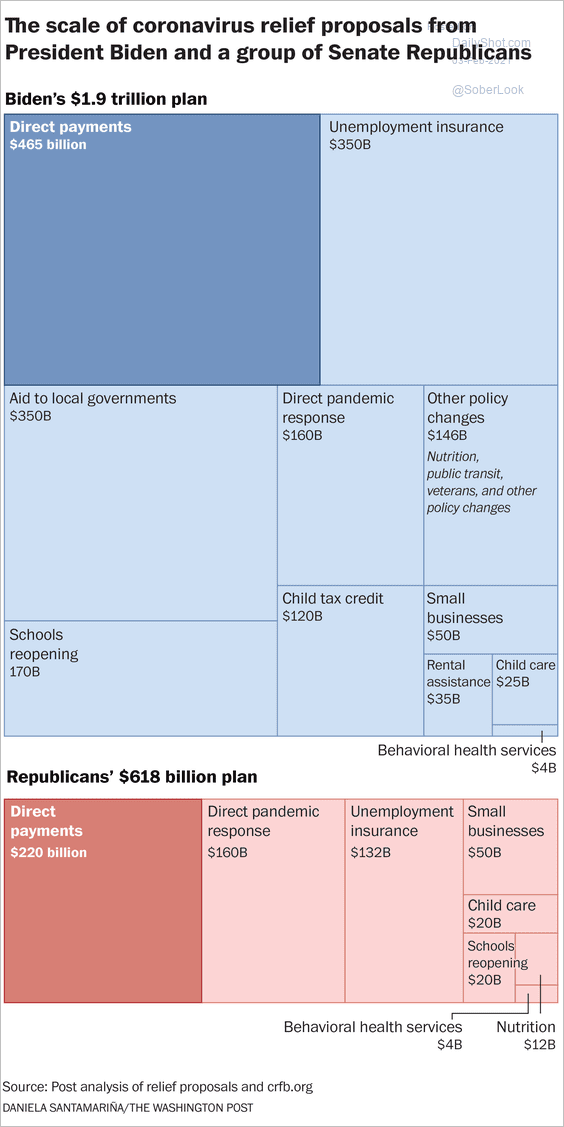 Source: The Washington Post
• Impact on incomes:
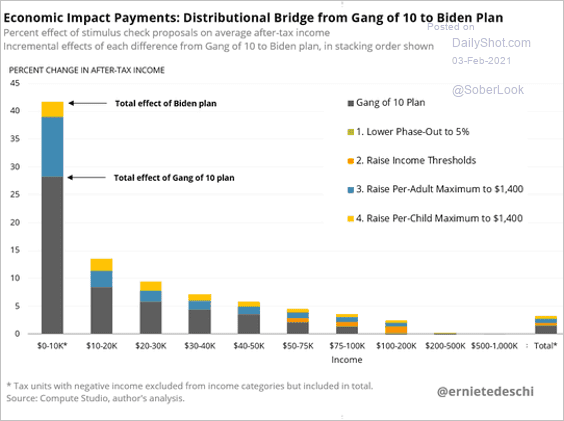 Source: @ernietedeschi
Back to Index
The United Kingdom
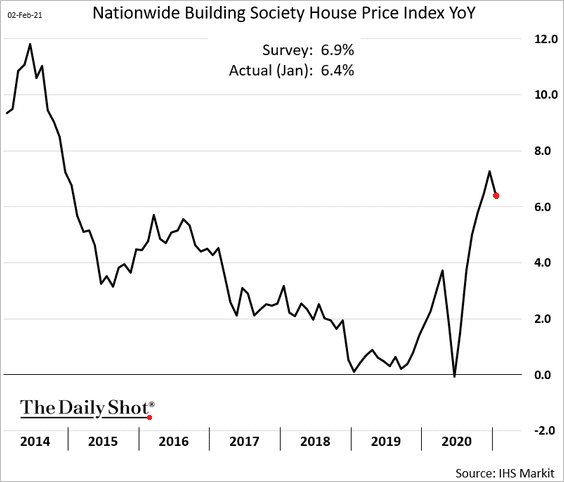
1. Home prices declined for the first time in months.
2. UK job losses have been concentrated in low-wage sectors.
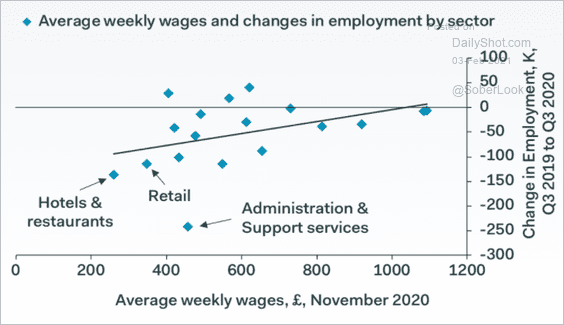 Source: Pantheon Macroeconomics
Back to Index
The Eurozone
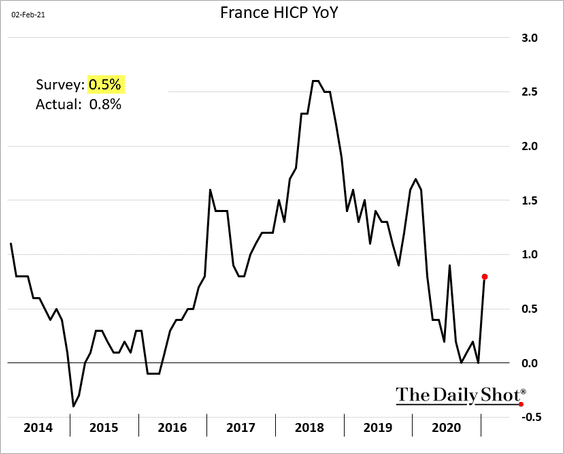
1. Euro-area market-based inflation expectations climbed further as oil prices rise.
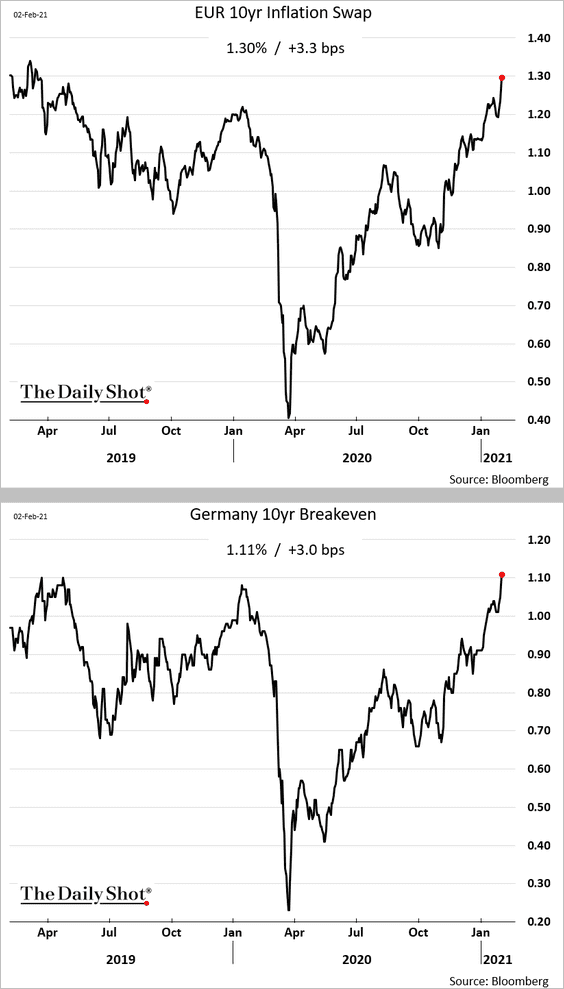
Similar to Germany and Spain, French CPI jumped in January.
——————–
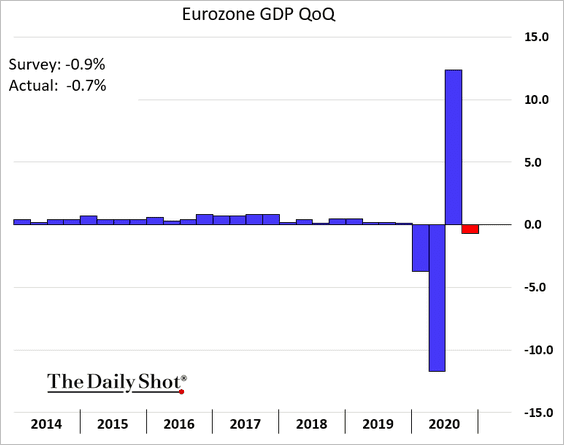
2. The Eurozone Q4 GDP surprised to the upside (the “double-dip” wasn’t as bad as expected).
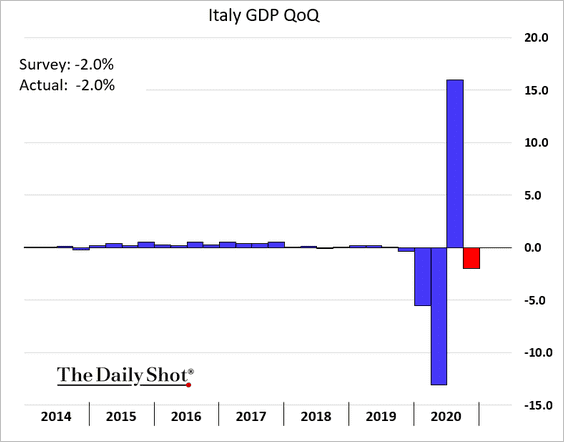
The Italian economy contracted by 2%.
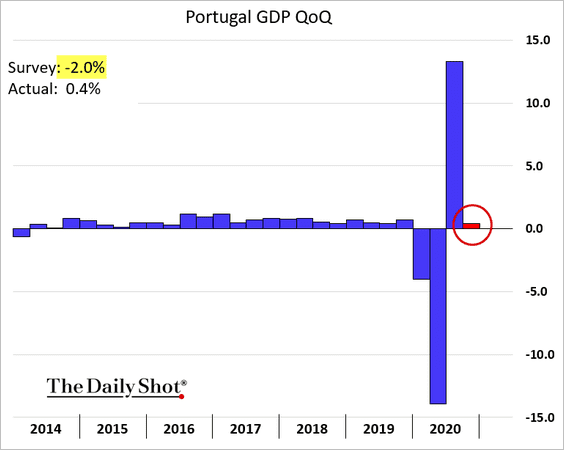
But Portugal avoided the double-dip altogether.
Here is the GDP map.
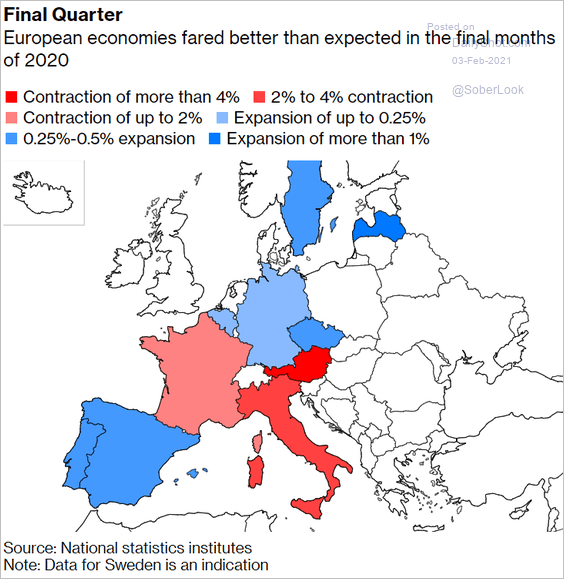 Source: @markets Read full article
——————–
3. Ireland’s service sector activity tumbled last month.
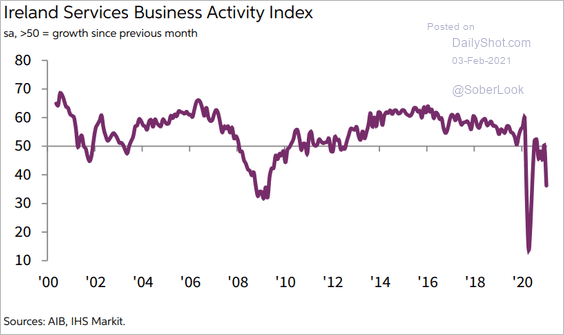 Source: IHS Markit
4. Euro-area electricity usage has almost fully recovered.
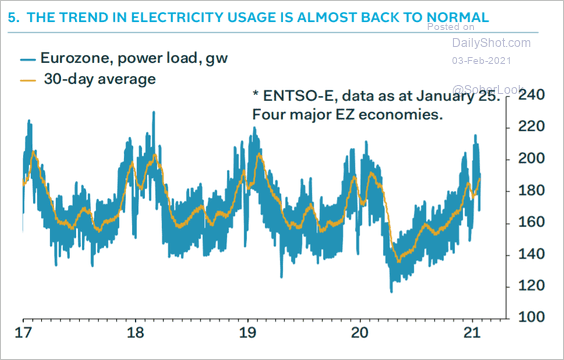 Source: Pantheon Macroeconomics
5. Finally, we have Germany’s political polls.
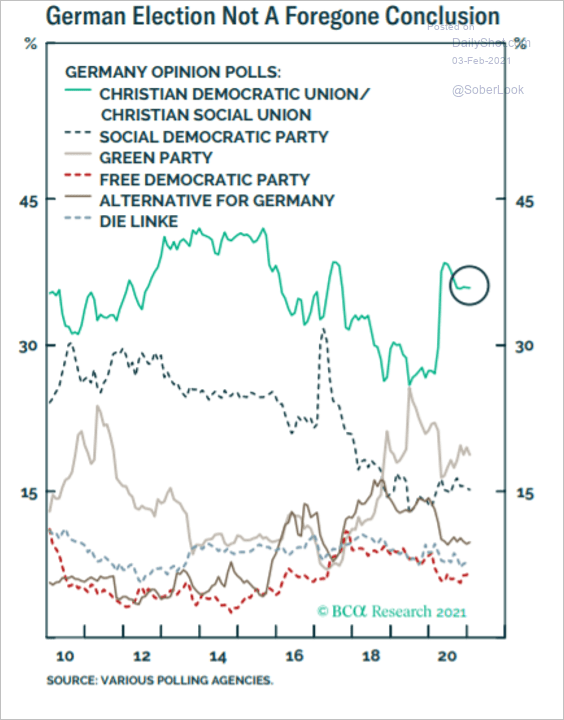 Source: BCA Research
Back to Index
Asia – Pacific
1. Singapore’s business activity is now firmly in growth mode.
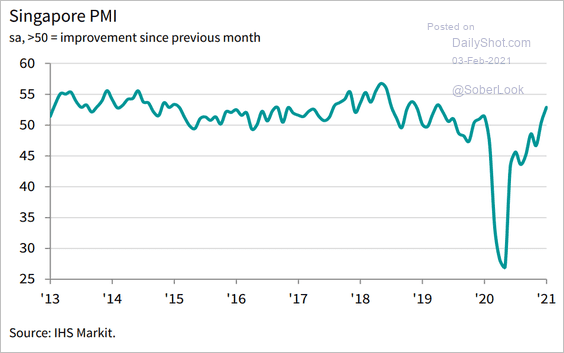 Source: IHS Markit
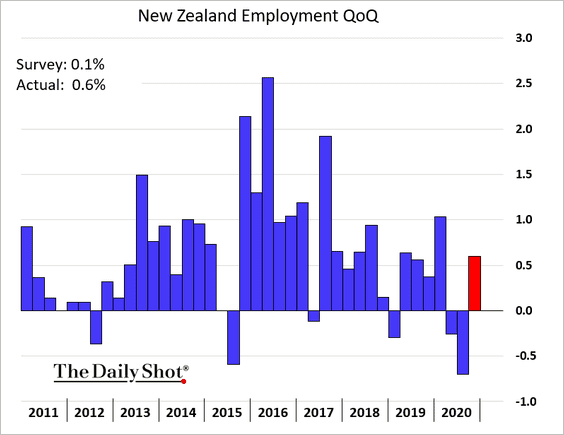
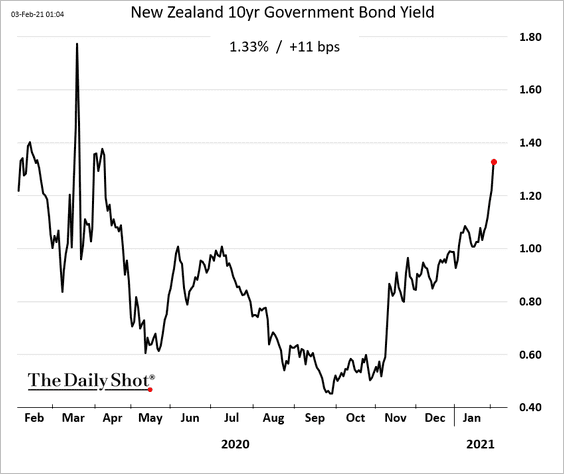
2. Next, we have some updates in New Zealand
• The Q4 employment report surprised to the upside.
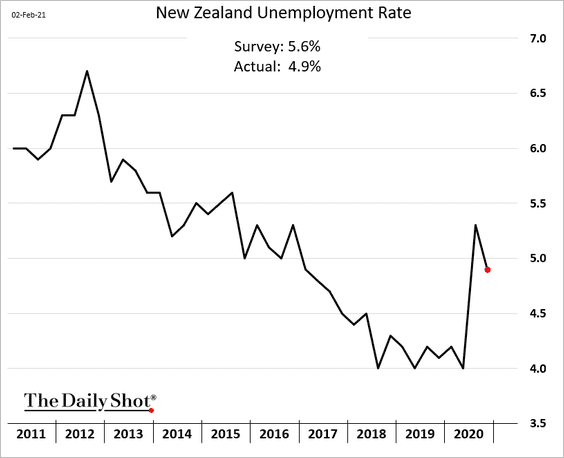
The unemployment rate unexpectedly declined.
• New Zeland’s home prices are up almost 13% from January of 2020.
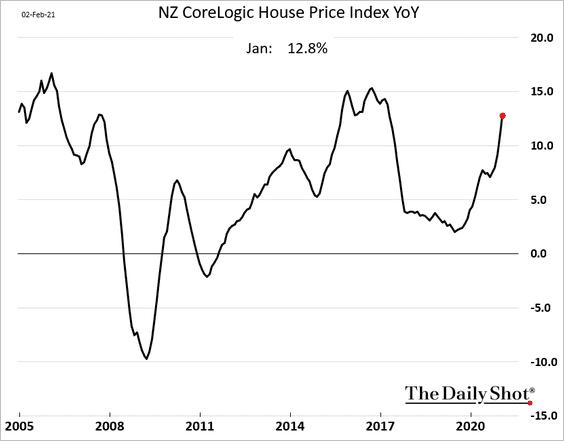
• Combining the two trends above points to a strengthening economy. Bond yields are climbing rapidly.
——————–
3. Australia’s residential building approvals exceeded economists’ forecasts.
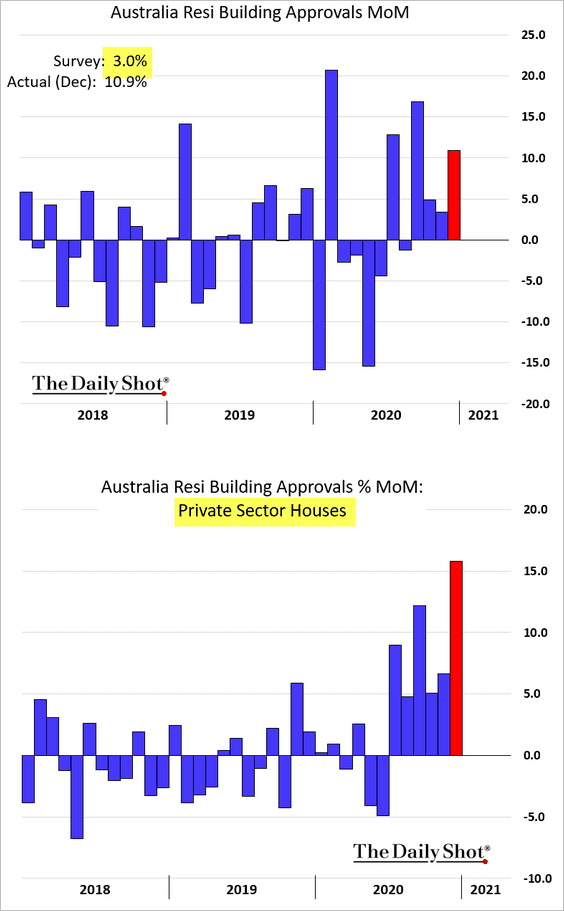
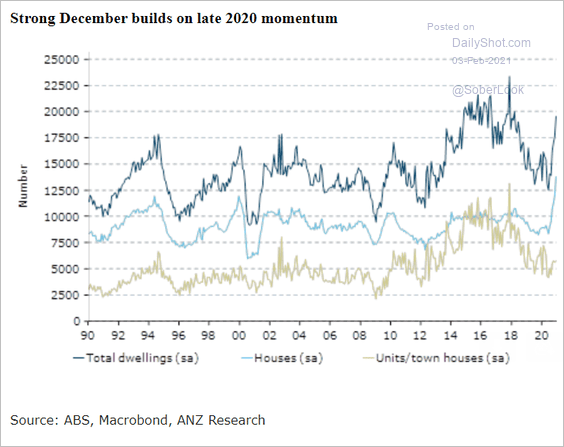 Source: ANZ Research
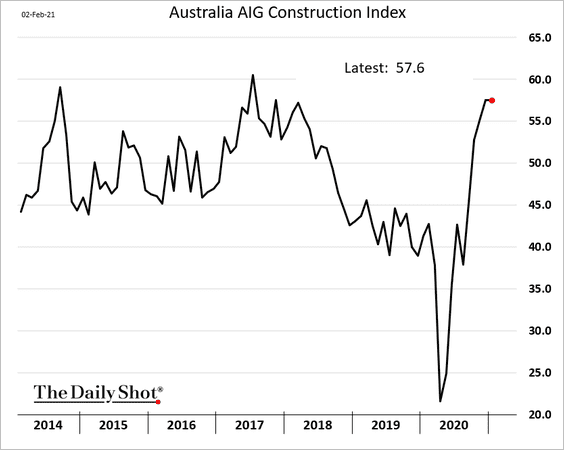
Construction activity remains robust.
Back to Index
China
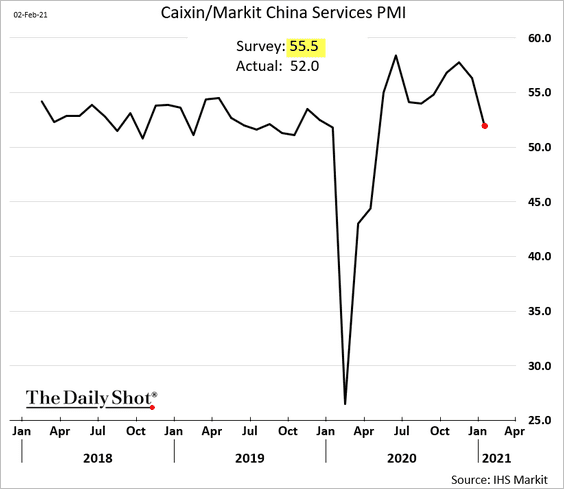
1. As we saw in the official report, China’s service sector growth lost momentum last month.
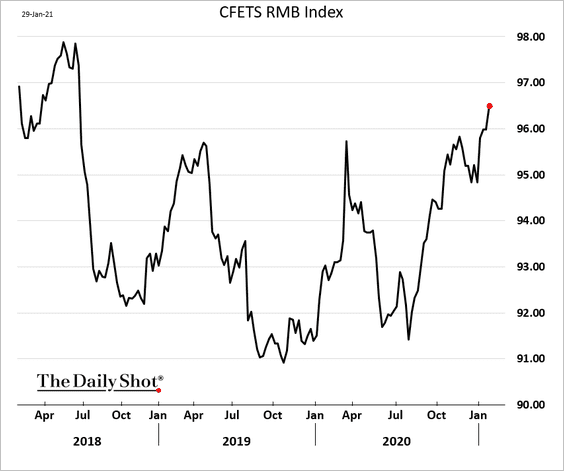
2. The renminbi is at the highest level since early 2018 relative to a basket of currencies.
3. Semiconductor imports have been soaring.
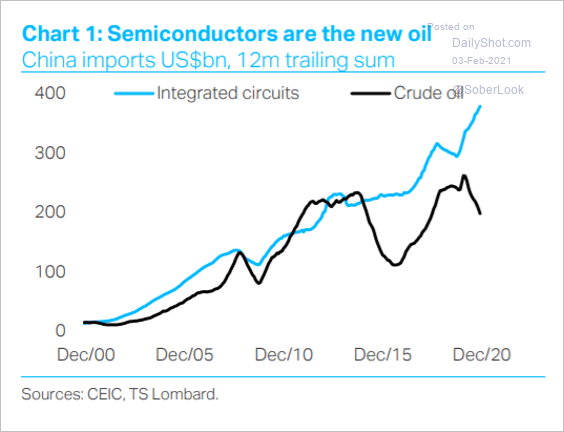 Source: TS Lombard
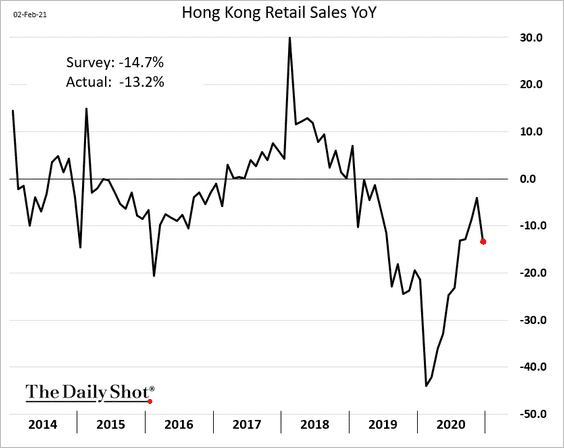
4. Hong Kong’s retail sales have not recovered since the 2019 protests.
Back to Index
Emerging Markets
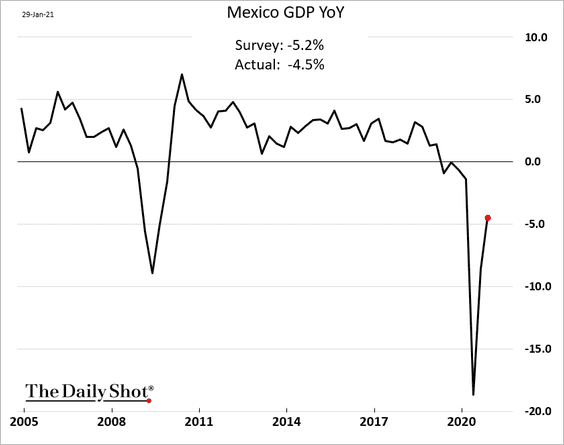
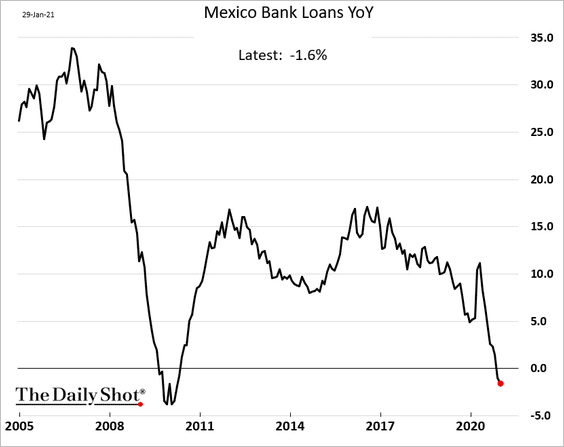
1. Let’s begin with Mexico.
• The Q4 GDP (better than expected):
• Manufacturing activity through January (still soft):
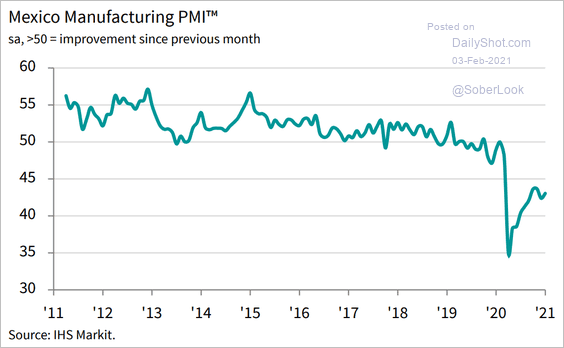 Source: IHS Markit
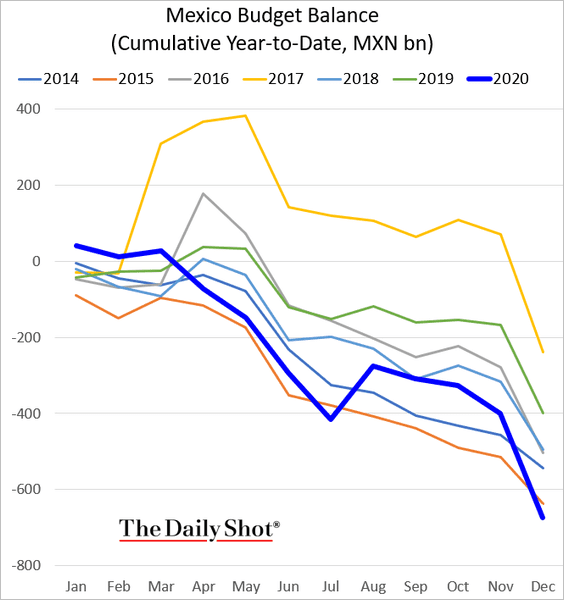
• Budget deficit:
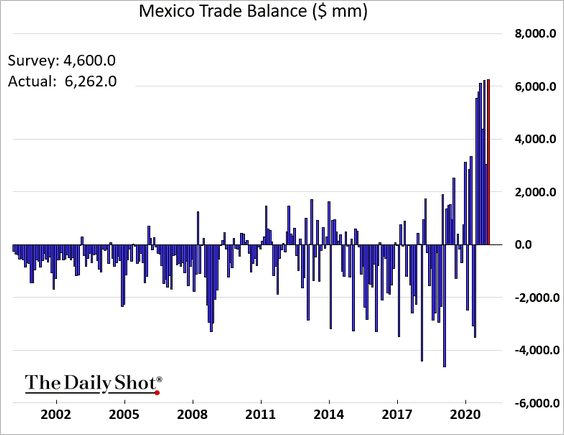
• Trade balance:
• Loan growth:
——————–
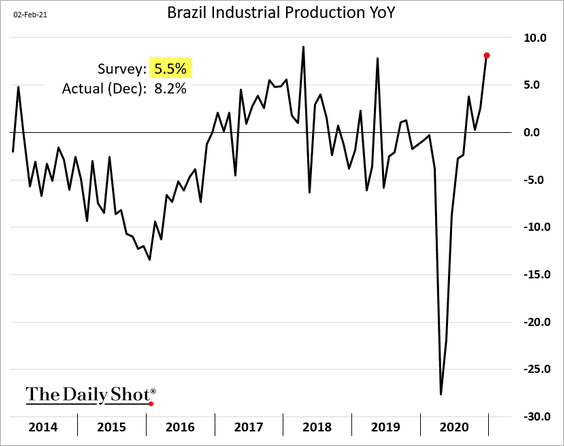
2. Brazil’s industrial production soared in December.
3. Colombia’s manufacturing PMI strengthened last month.
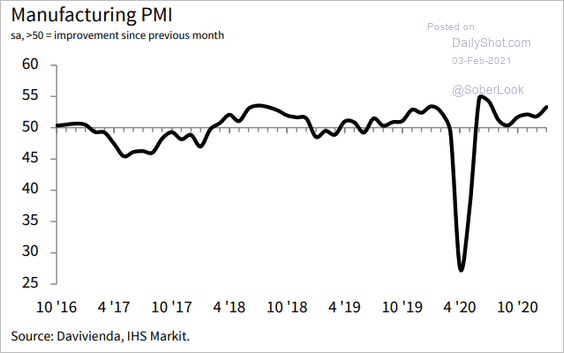 Source: IHS Markit
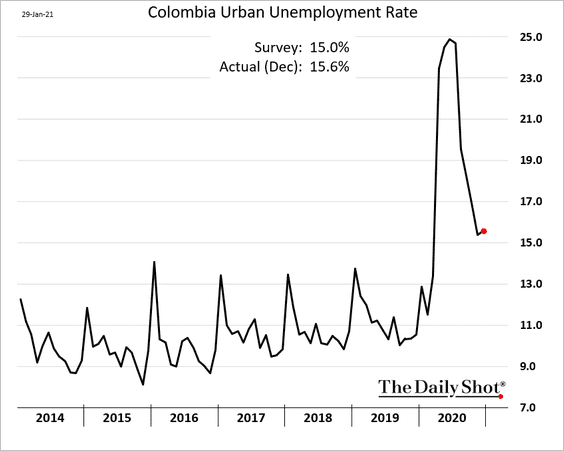
But unemployment remains elevated.
——————–
4. It will take time for Latin American economies to recover fully.
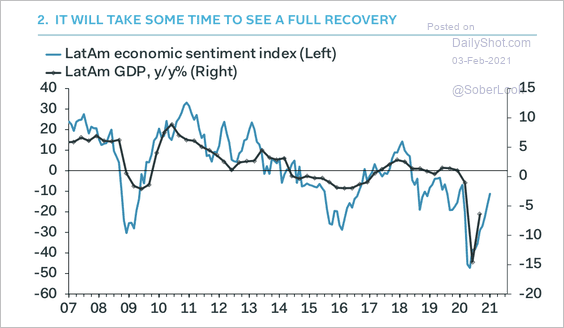 Source: Pantheon Macroeconomics
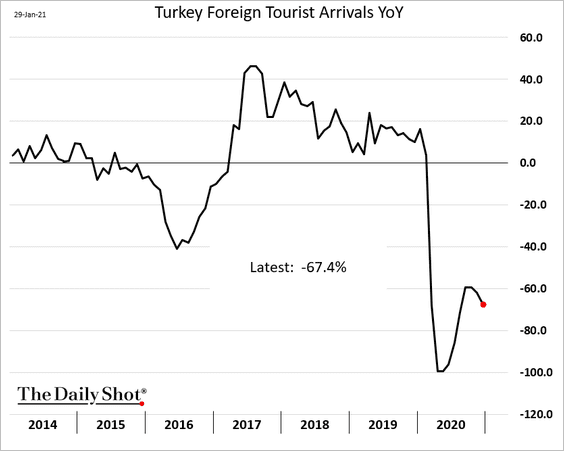
5. Turkey’s tourism industry is struggling.
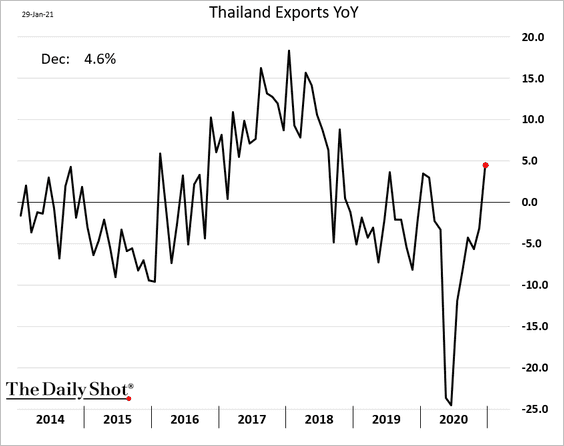
6. Thai exports roared back in December.
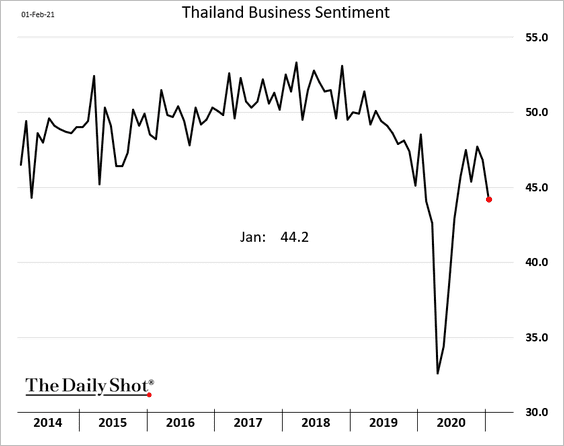
But business sentiment deteriorated last month.
——————–
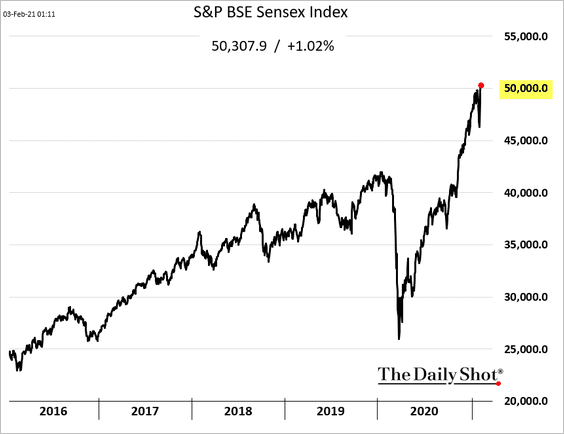
7. India’s benchmark stock index hit a new high as the government prepares to spend heavily.
8. The MSCI Emerging Markets ETF (EEM) is at support relative to the SPDR S&P 500 ETF (SPY).
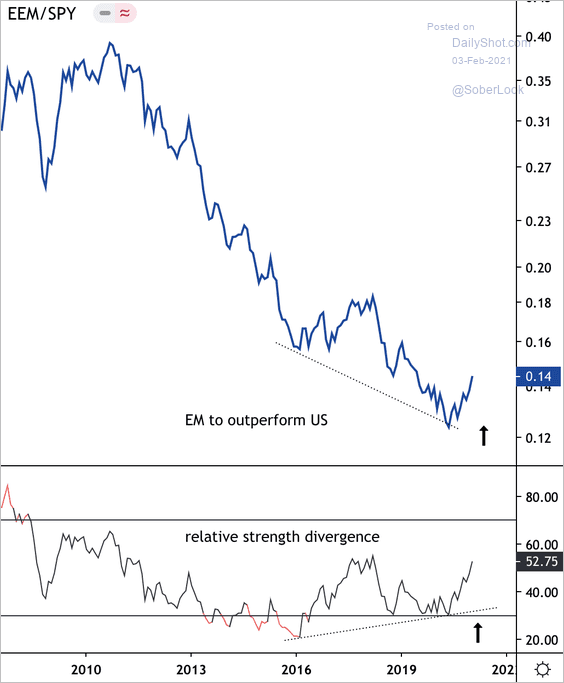 Source: Dantes Outlook
Back to Index
Commodities
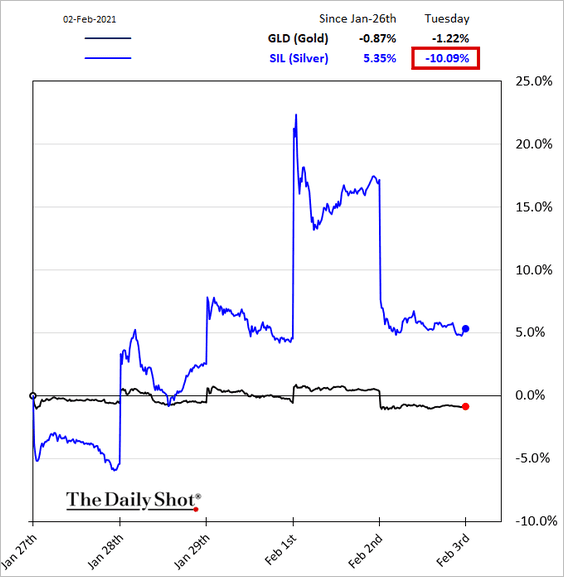
1. The largest silver ETF tumbled on Tuesday as the Reddit (retail) trade soured.
2. Shortages are creating a squeeze in tin markets as the curve hits massive backwardation.
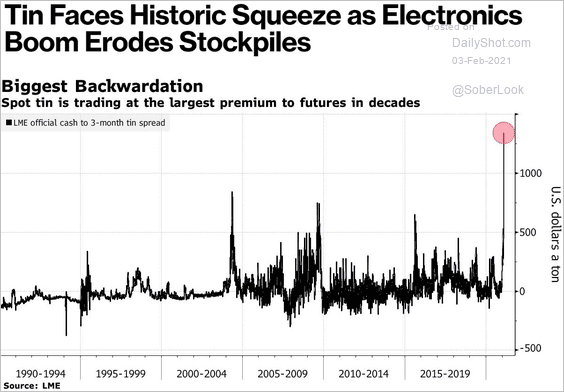 Source: @business Read full article
3. Pulp prices are surging in China.
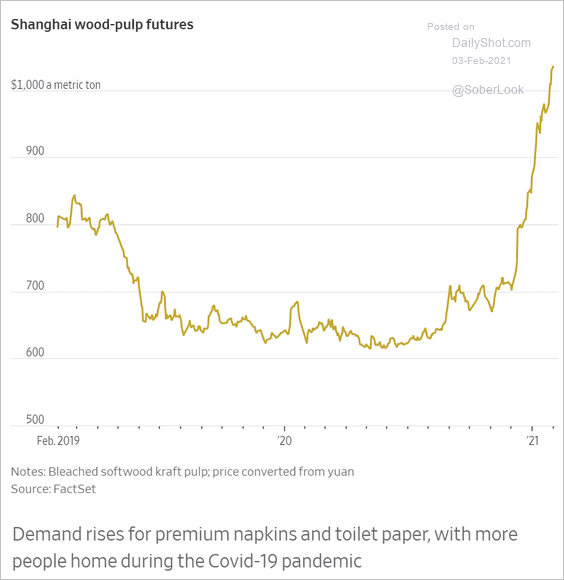 Source: @WSJ Read full article
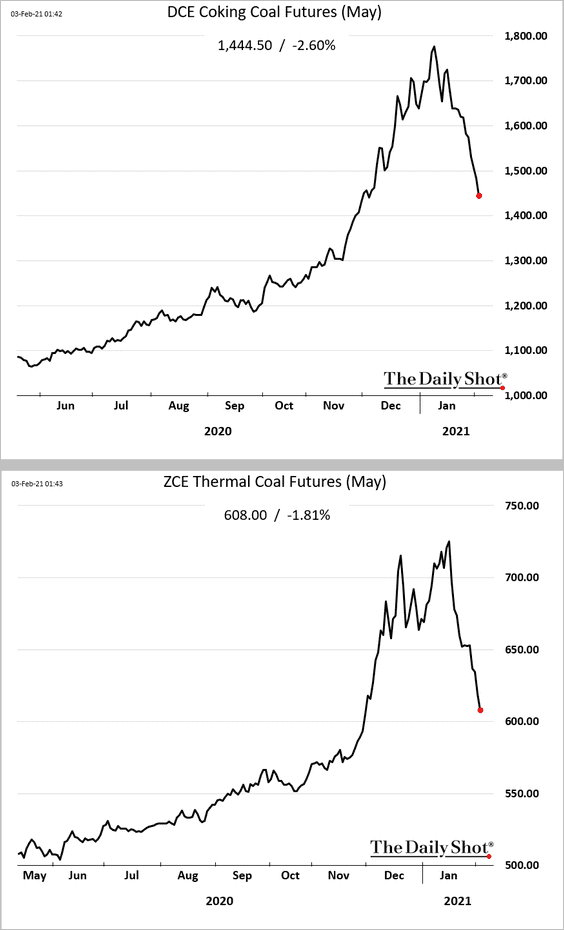
4. China’s coal prices are tumbling.
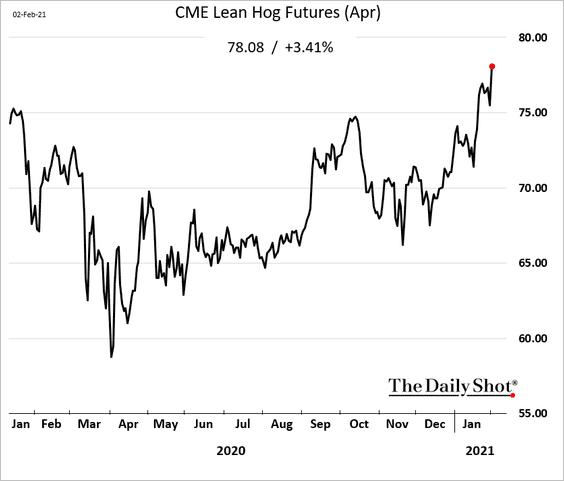
5. US hog futures are climbing.
 Source: Successful Farming Read full article
——————–
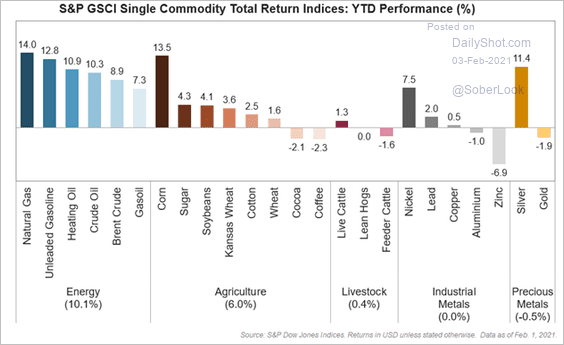
6. Here are a couple of return charts.
• Year-to-date:
 Source: S&P Global Market Intelligence
• 20 years:
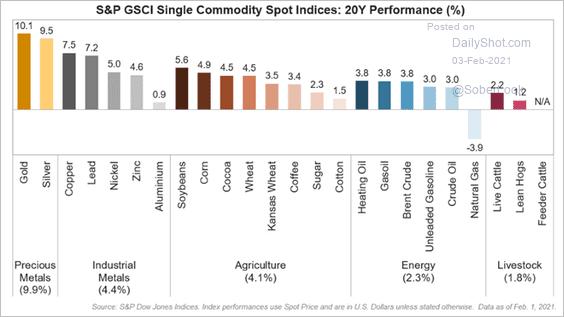 Source: S&P Global Market Intelligence
Back to Index
Energy
1. OPEC’s output has been climbing for months, but the January increase was lower than expected.
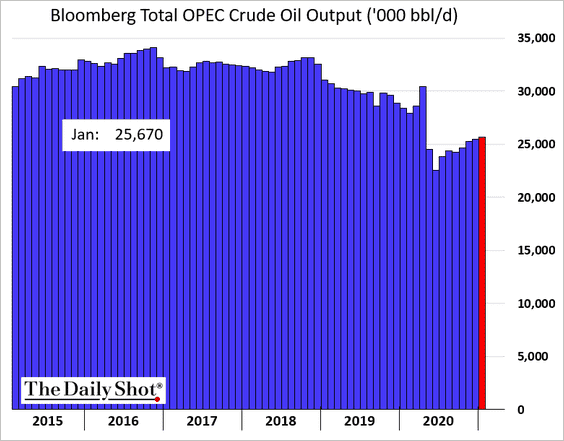 Source: @TheTerminal, Bloomberg Finance L.P.
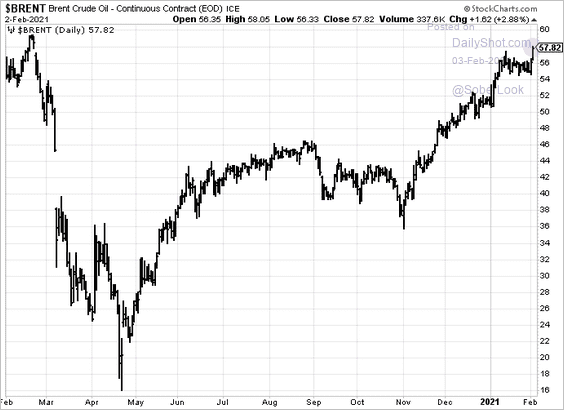
Crude oil prices rose.
——————–
2. Fitch expects higher gasoline demand this year.
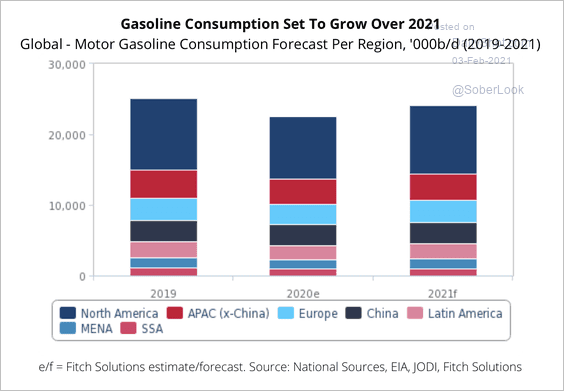 Source: Fitch Solutions Macro Research
Back to Index
Equities
1. The ratio of cyclical to defensive sectors hit a new high, …
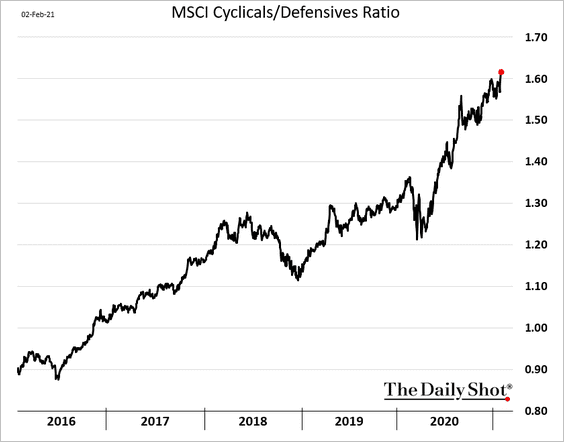
… as flows into cyclical, expansionary US sectors continued to rise last month.
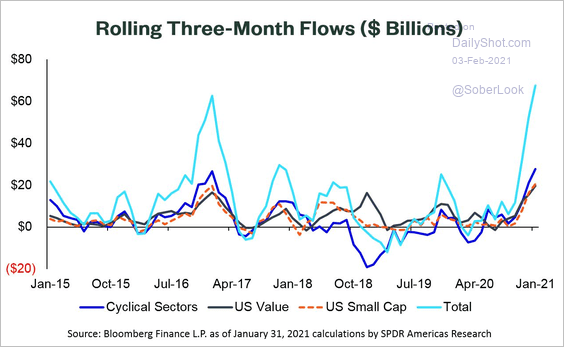 Source: SPDR Americas Research, @mattbartolini
——————–
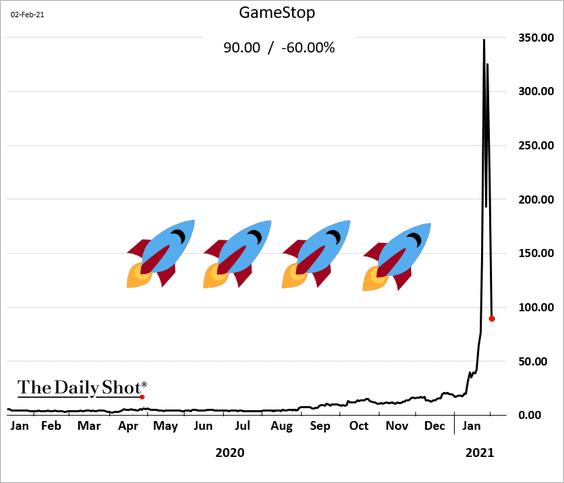
2. Bro, you told me GME is going to the moon …
——————–
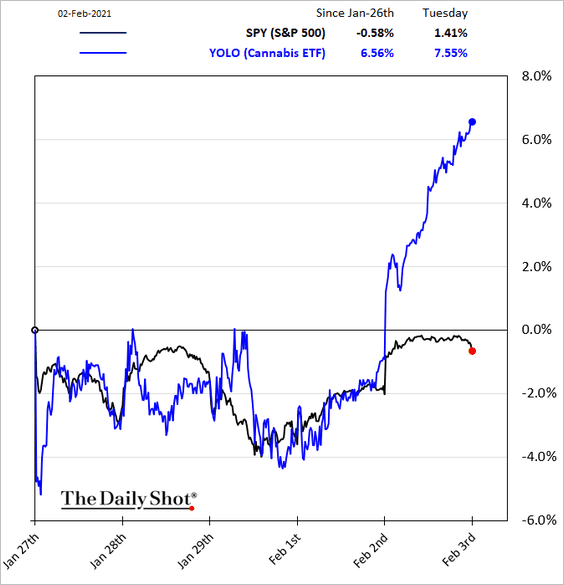
3. Cannabis stocks soared on Tuesday.
 Source: MarketWatch Read full article
——————–
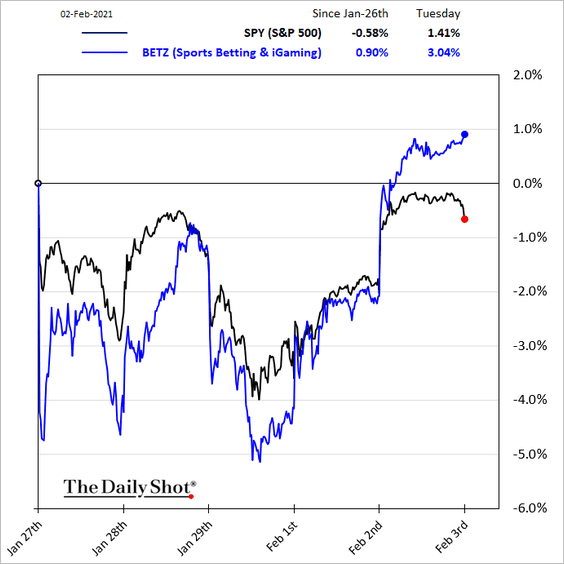
4. Betting/gaming stocks jumped.
 Source: Markets Insider Read full article
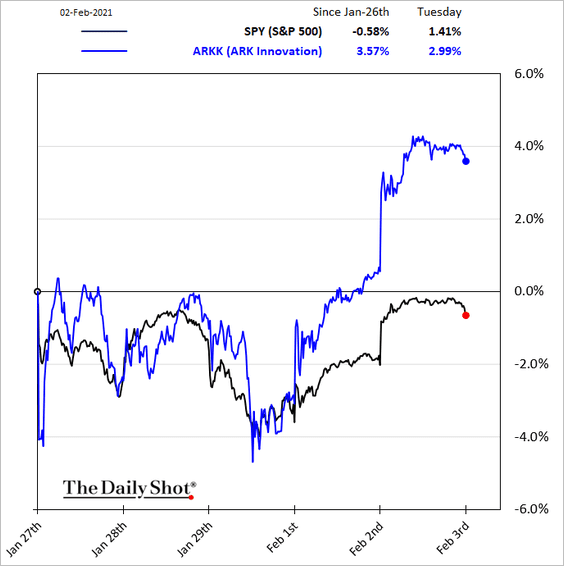
And Ark Innovation ETF is surging again.
——————–
5. Tech earnings continue to surprise to the upside.
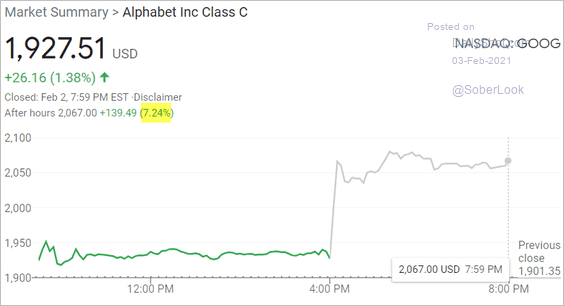 Source: Google.com
6. Short futures bets among asset managers are back near-decade lows, while risk positioning is at an extreme.
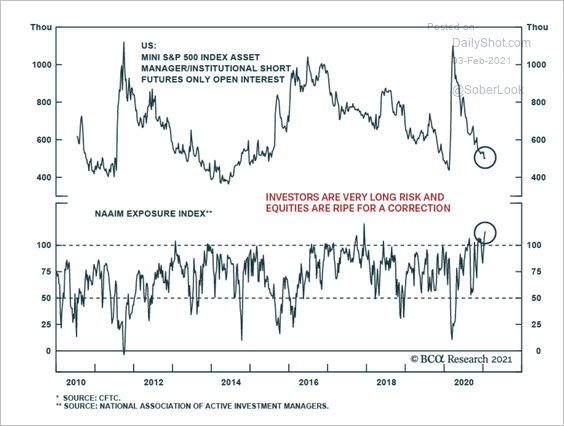 Source: BCA Research
7. Small-cap performance dispersion spiked last month due to the Reddit phenomenon.
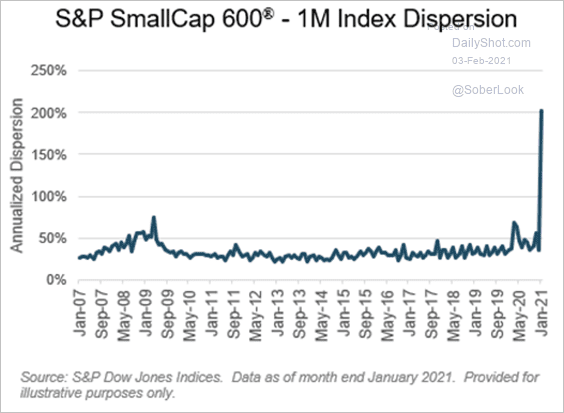 Source: S&P Global Market Intelligence
8. This chart shows the percentage of stocks beating the S&P 500.
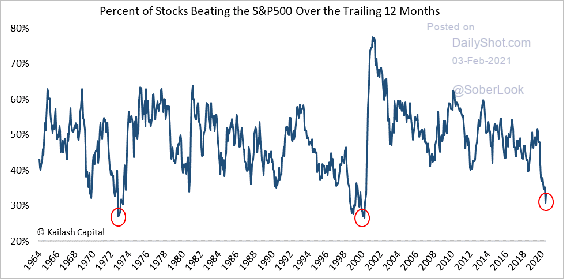 Source: @KailashConcepts Read full article
9. Investors are still buying call options on the “fabulous five.”
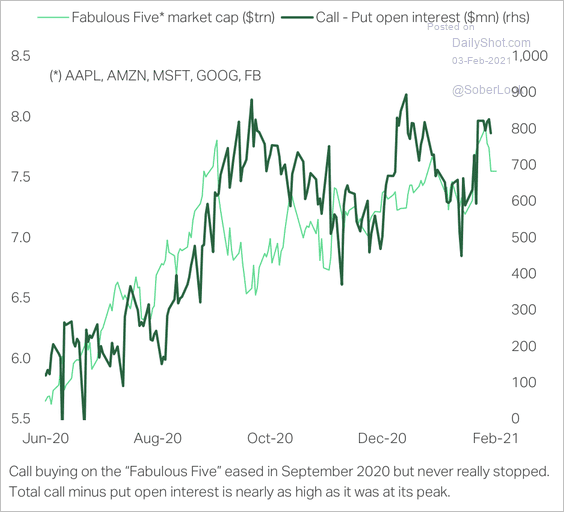 Source: TS Lombard
According to JP Morgan, “The balance of risks is for this retail impulse [options buying] to slow rather than accelerate further from here, potentially weakening one important support for the equity market.”
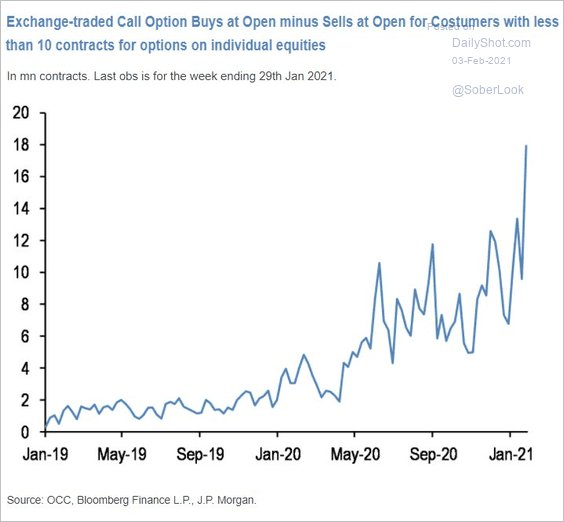 Source: JP Morgan, @tracyalloway
——————–
10. Choppy returns ahead?
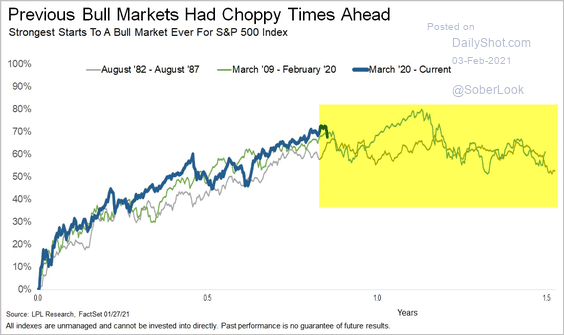 Source: LPL Research
11. Search activity for online brokers remains elevated.
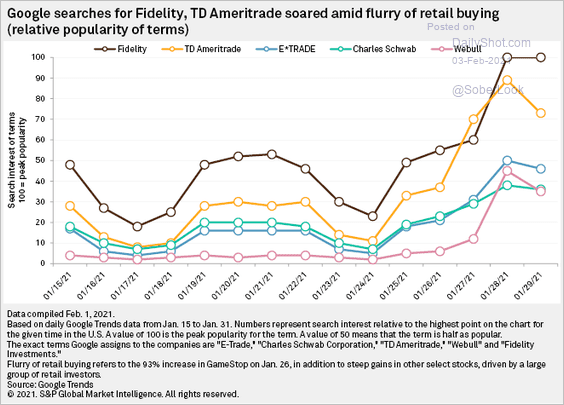 Source: S&P Global Market Intelligence
12. 80% of IPOs have no earnings but have posted stellar returns over the past year.
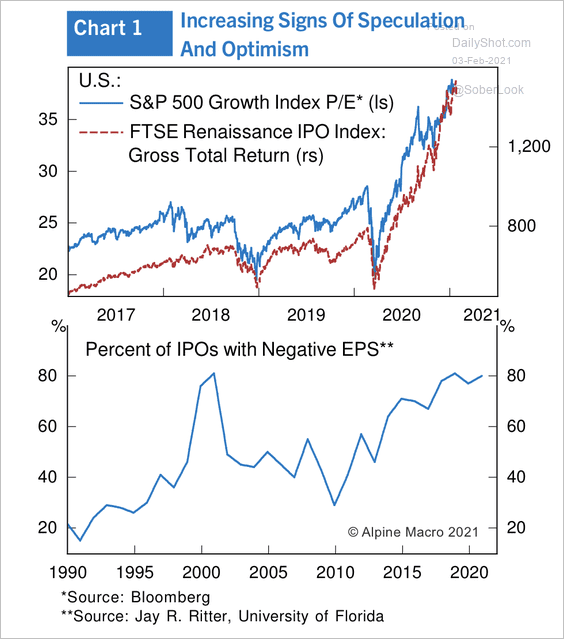 Source: Alpine Macro
Back to Index
Credit
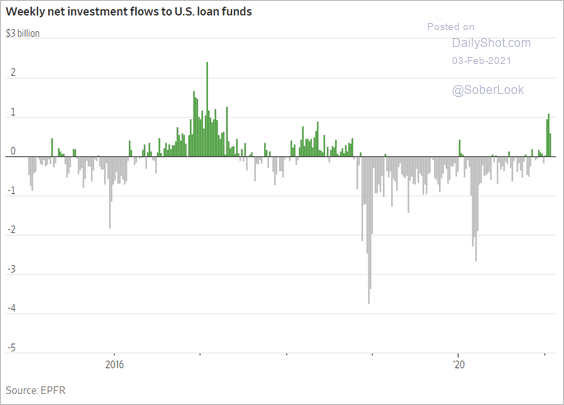
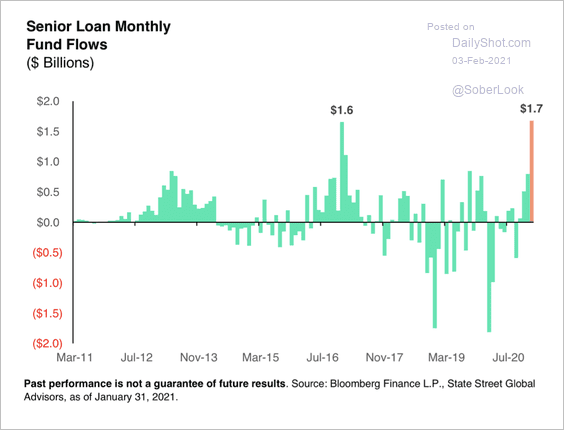
1. Leveraged loan flows have been strong in recent weeks.
 Source: @WSJ Read full article
Loans took in $1.7 billion in inflows – the highest monthly inflow total ever for this segment. Loans currently offer a yield on par with high-yield (around 4%), according to State Street.
 Source: SPDR Americas Research, @mattbartolini
——————–
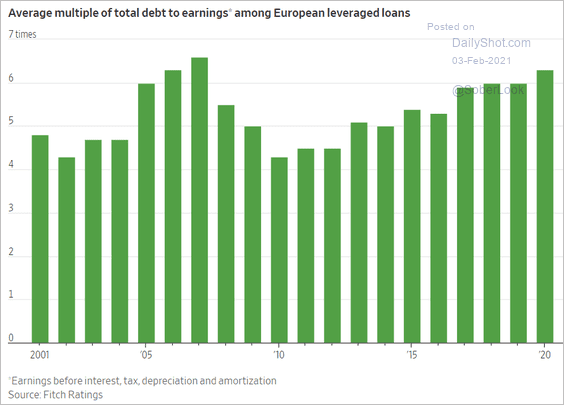
2. European syndicated loan borrowers are highly leveraged.
 Source: @WSJ Read full article
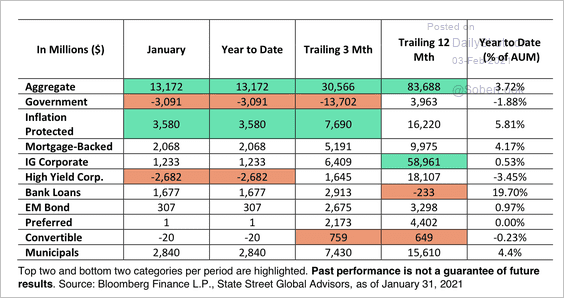
3. There was a rotation out of high-yield ETFs in January.
 Source: SPDR Americas Research, @mattbartolini
4. Weaker aircraft valuations pose risks for securities collateralized by aircraft leases.
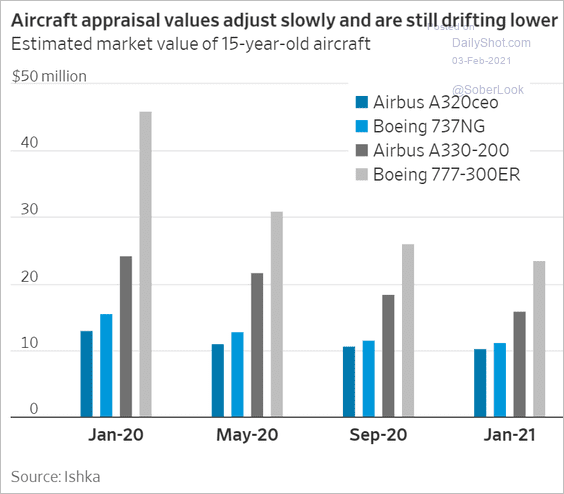 Source: @WSJ Read full article
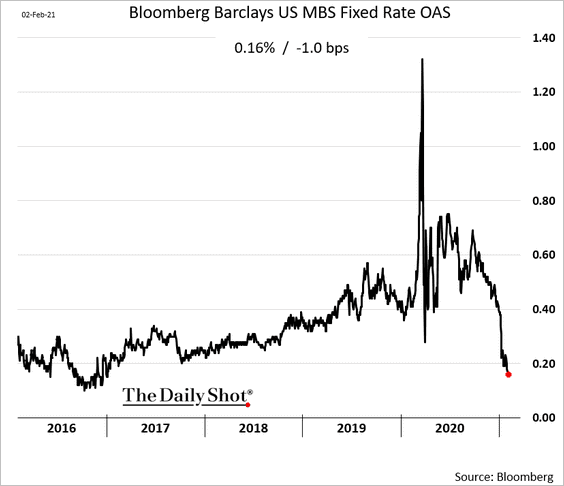
5. Agency MBS spreads continue to tighten.
Back to Index
Rates
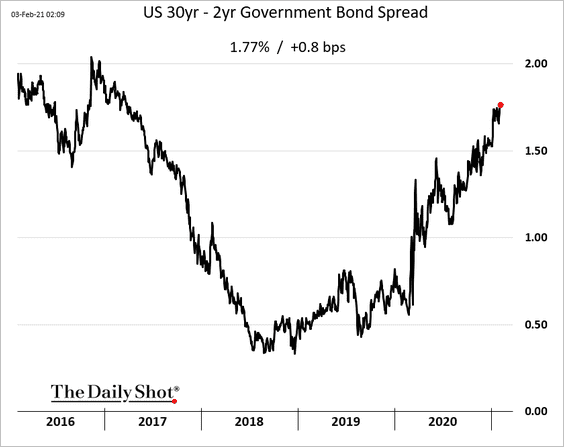
1. The Treasury curve keeps steepening.
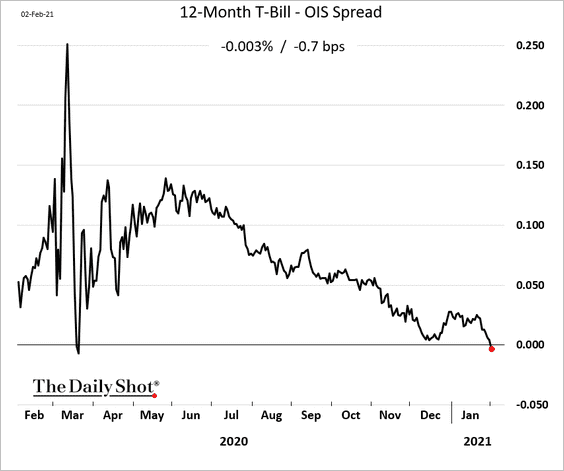
2. The US Treasury will be issuing fewer T-bills this year, tapping its cash balances at the Fed instead. The 12-month T-bill – OIS spread is now negative.
3. Here is the 3-month LIBOR – fed-funds spread.
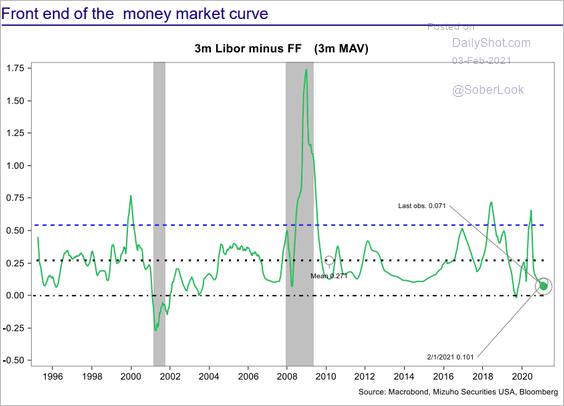 Source: Mizuho Securities USA
Back to Index
Global Developments
1. Below is the global fiscal stimulus by country vs. 2008.
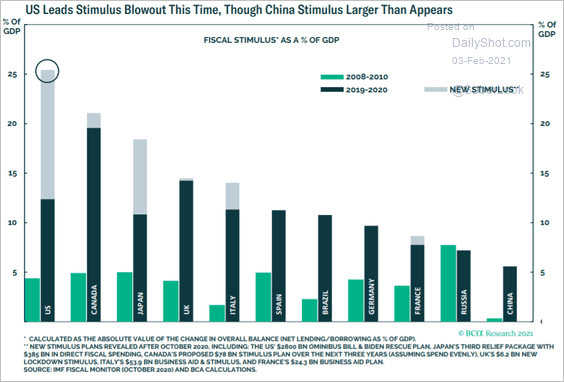 Source: BCA Research
2. The next set of charts shows the impact of higher interest rates on debt-servicing costs.
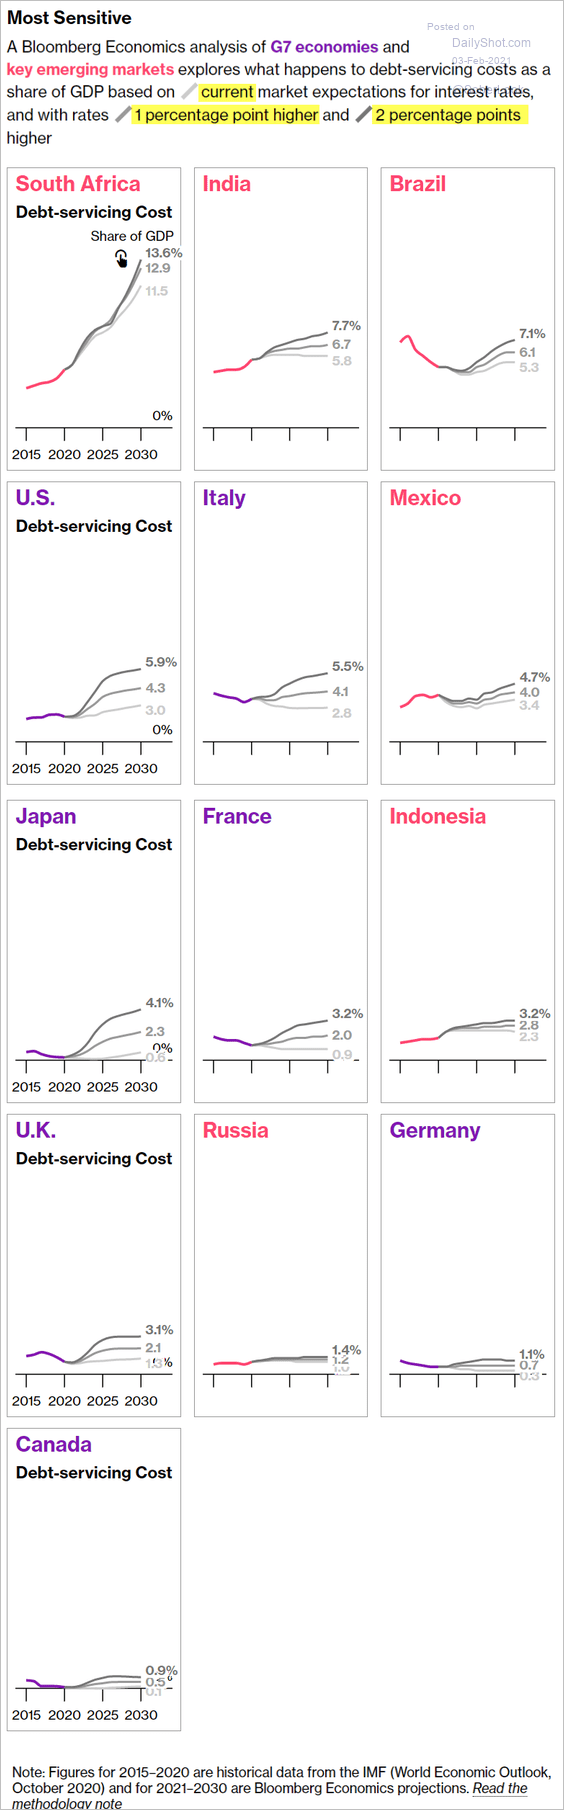 Source: @bbgvisualdata Read full article
3. The US dollar is holding resistance.
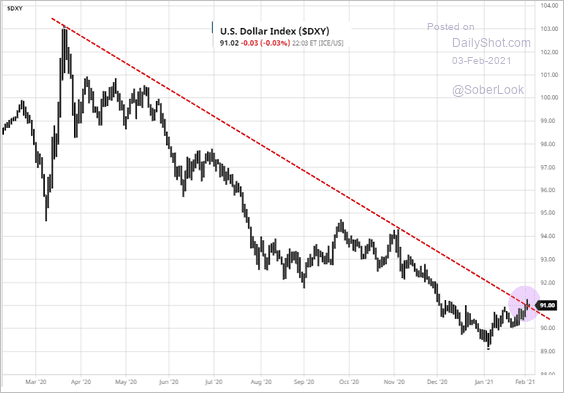 Source: barchart.com
4. Market liquidity has not kept up with policy easing.
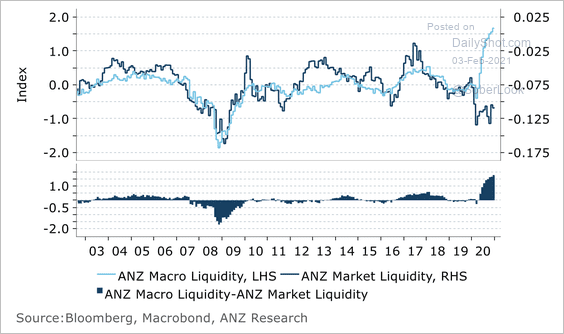 Source: ANZ Research
——————–
Back to Index
Food for Thought
1. Changes in US home price appreciation over the past year:
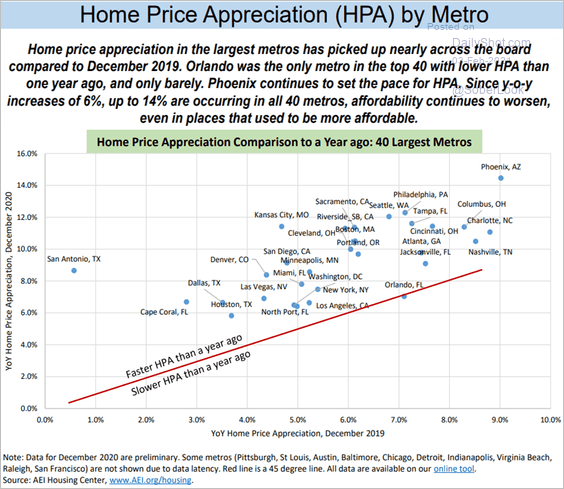 Source: AEI Housing Center
2. Spending stimulus checks:
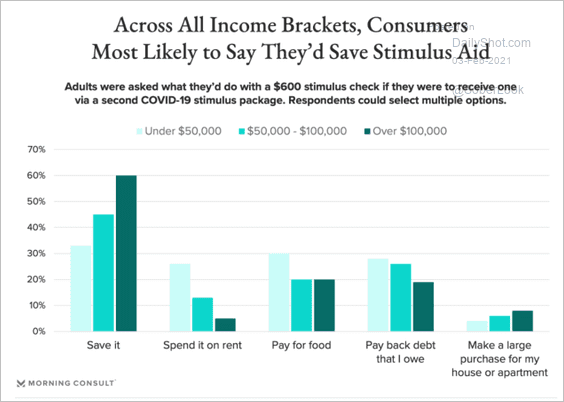 Source: Morning Consult Read full article
3. US household bills:
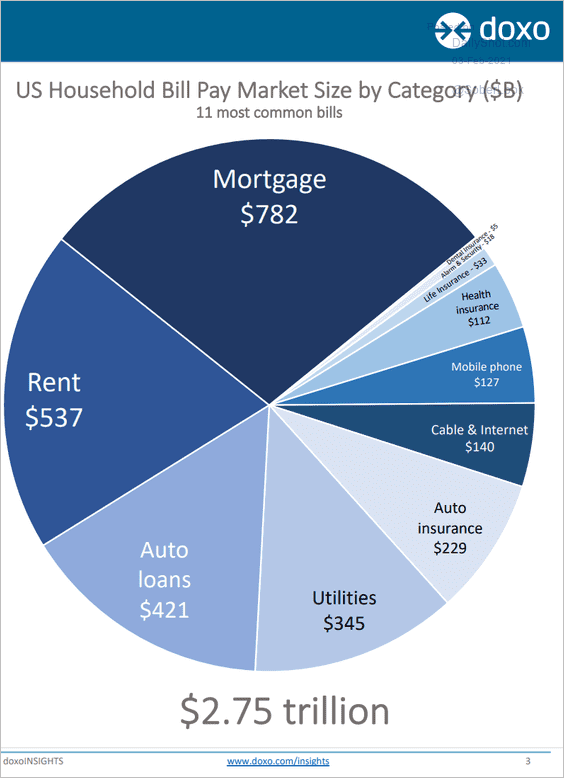 Source: doxo
4. Stock ownership trends by educational attainment:
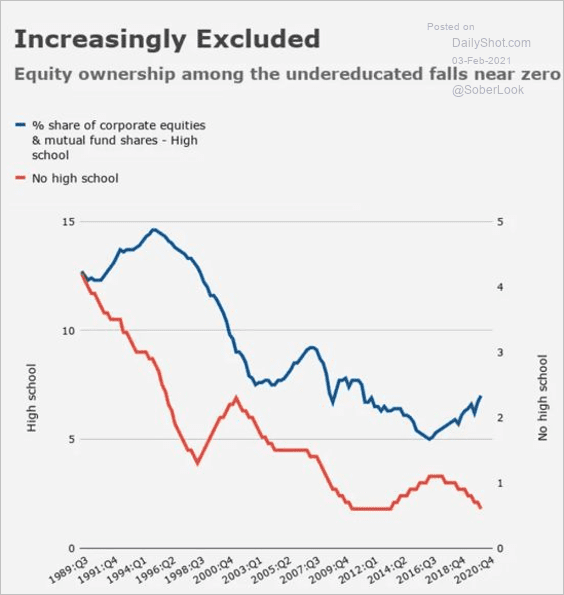 Source: Heisenberg Report
5. US population growth:
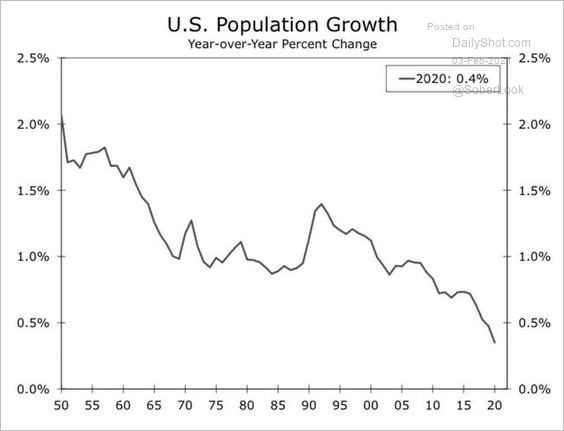 Source: Wells Fargo Securities
6. Myanmar major ethnic groups:
 Source: Al Jazeera Read full article
7. Israeli vaccination data:
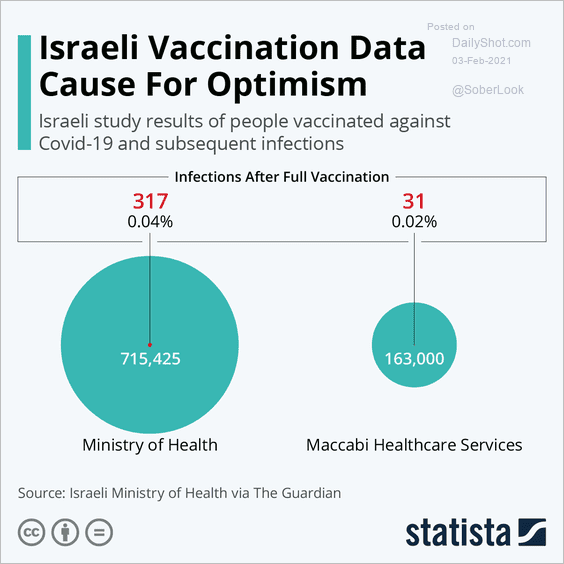 Source: Statista
8. Will Donald Trump run for president again (betting markets’ odds):
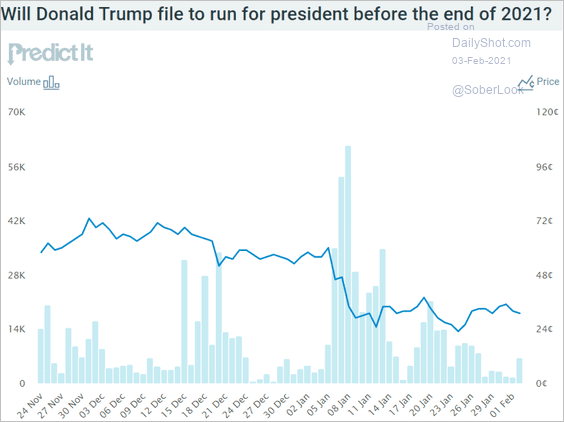 Source: @Predictit
9. Attitudes towards Super Bowl ads:
 Source: polici
——————–
Back to Index