The Daily Shot: 16-Jun-22
• The United States
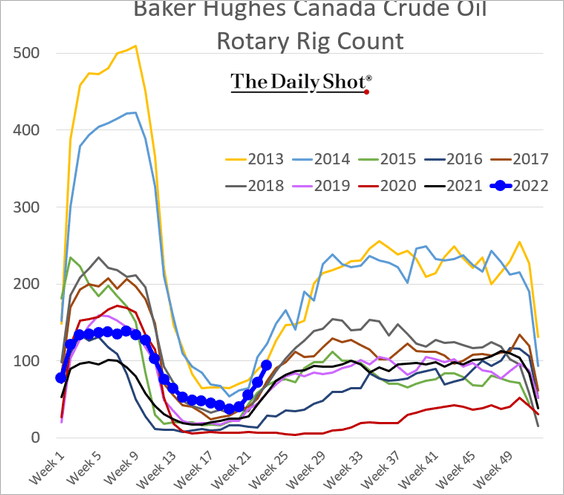
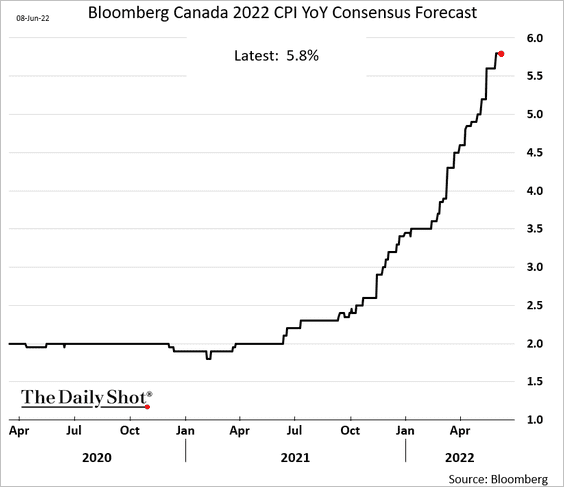
• Canada
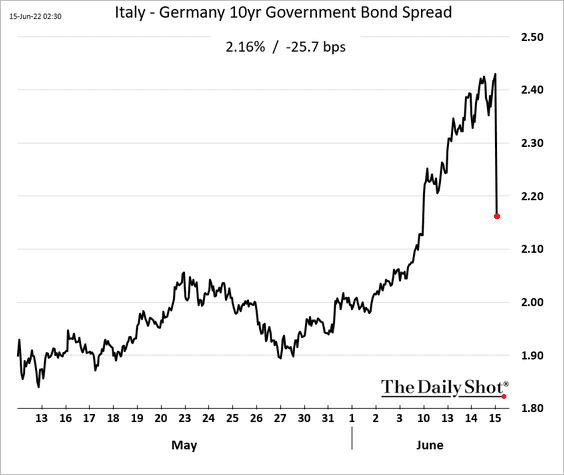
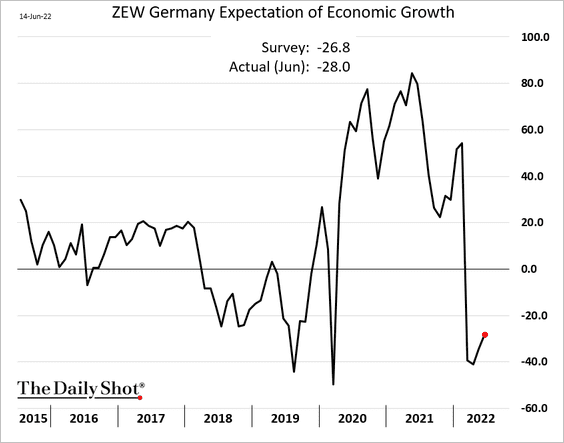
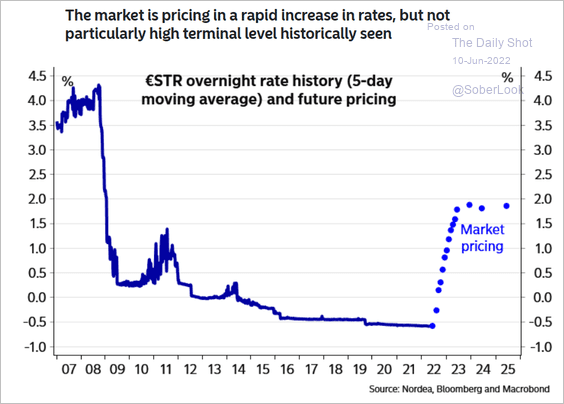
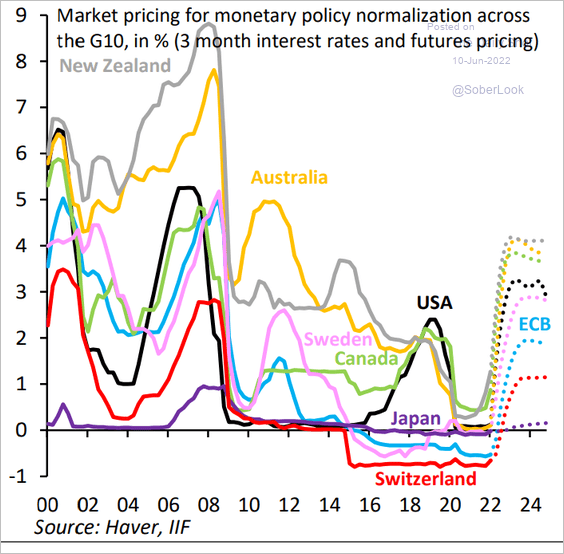
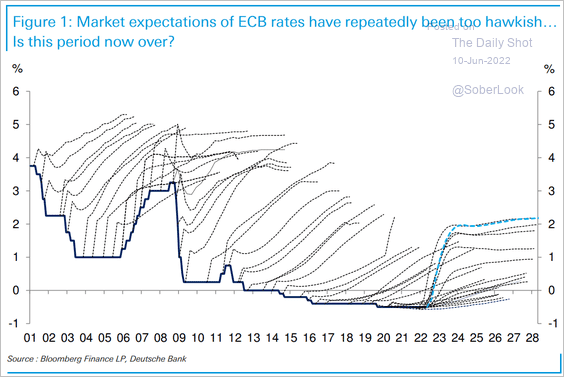
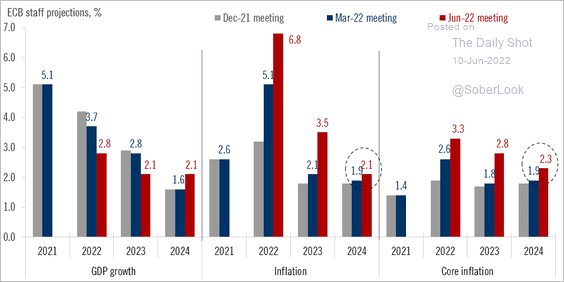
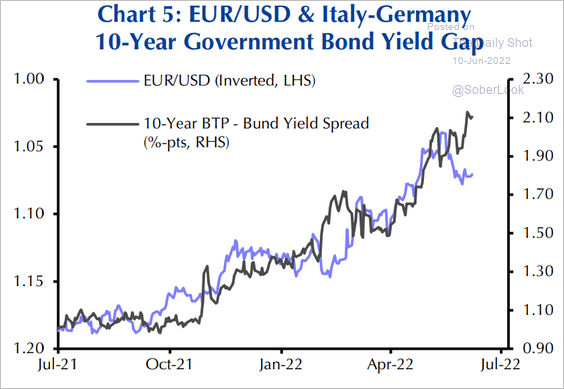
• The Eurozone
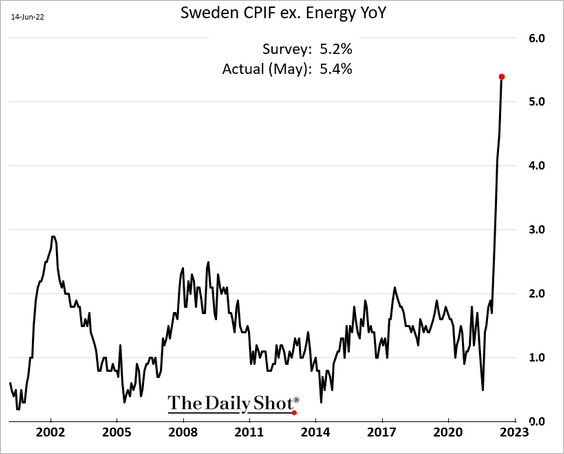
• Europe
• Asia – Pacific
• China
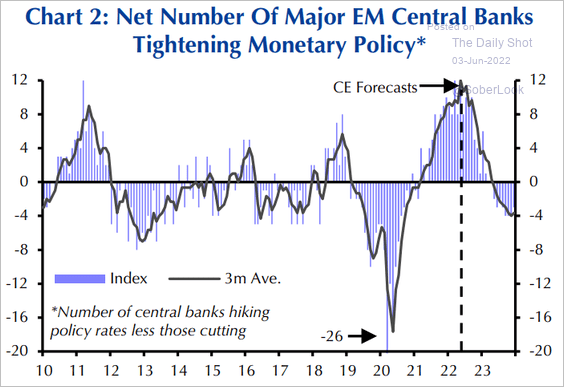
• Emerging Markets
• Cryptocurrency
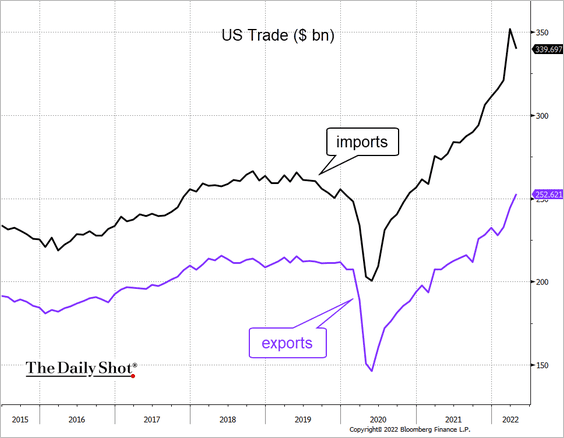
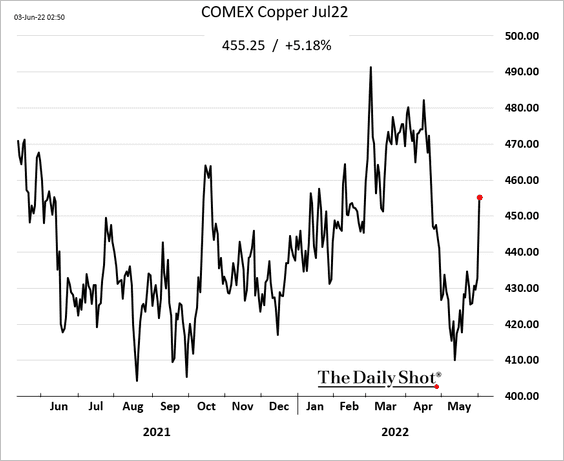
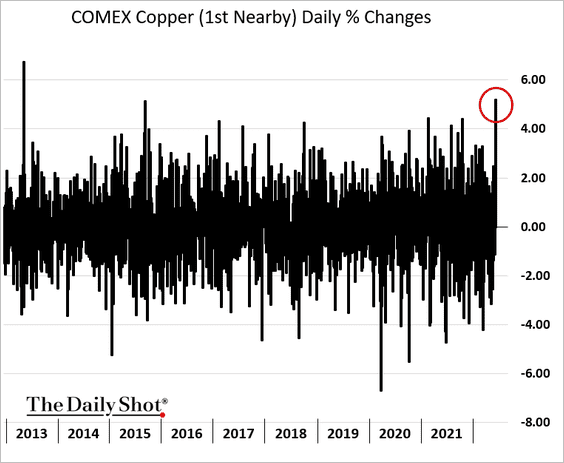
• Commodities
• Energy
• Equities
• Global Developments
• Food for Thought
The United States
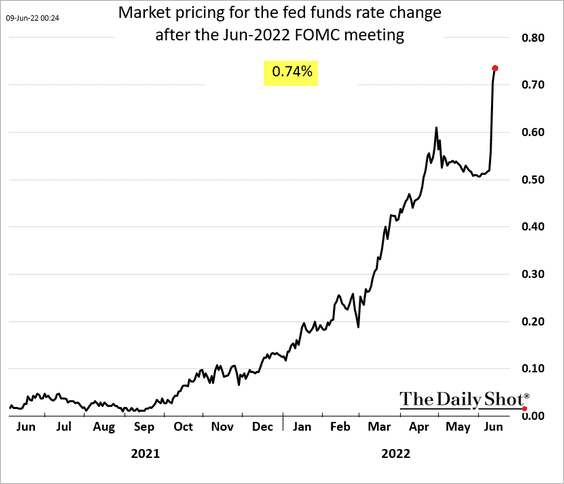
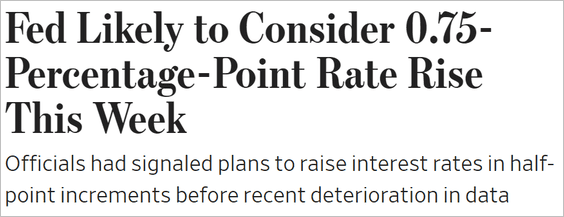
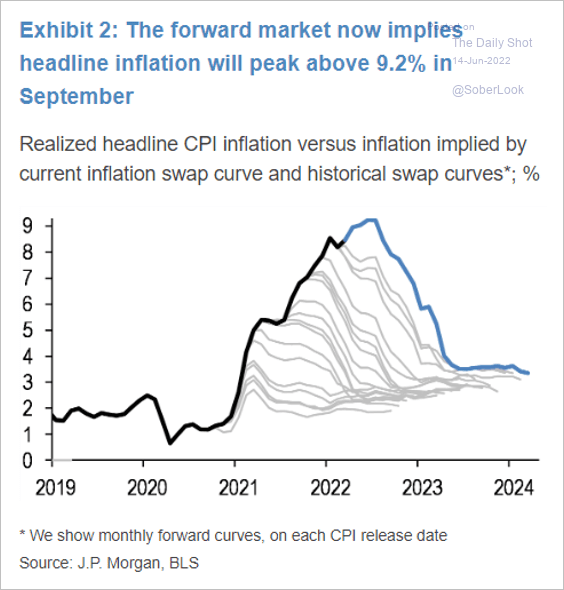
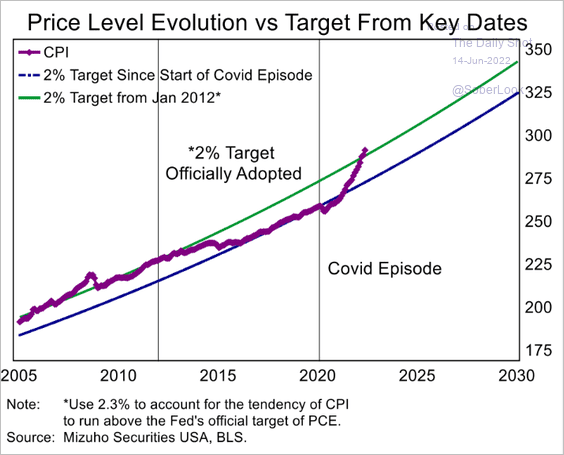
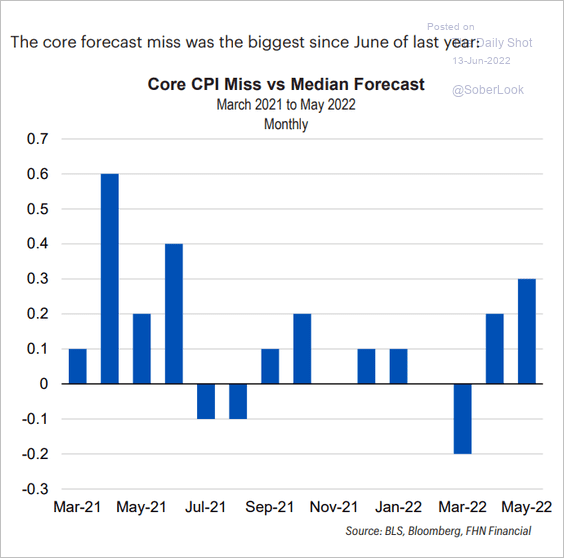
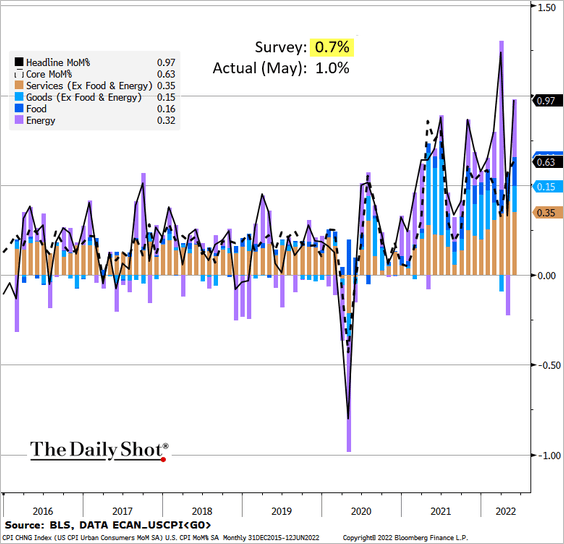
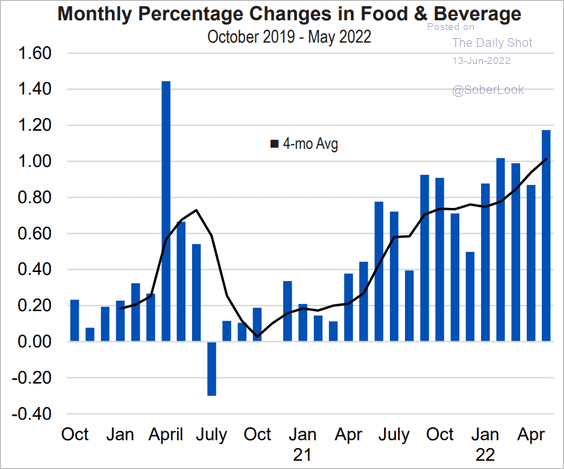
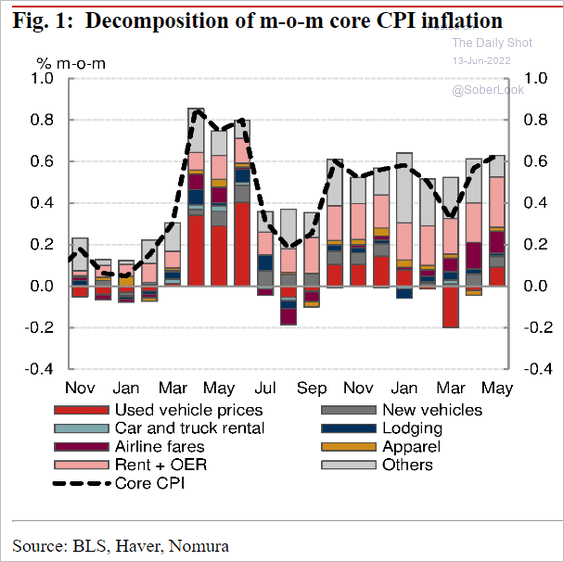
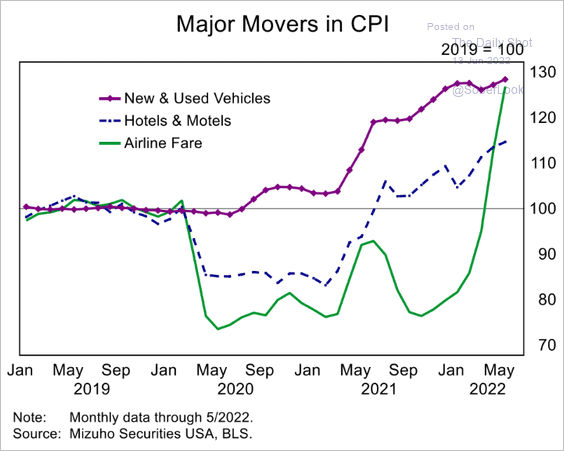
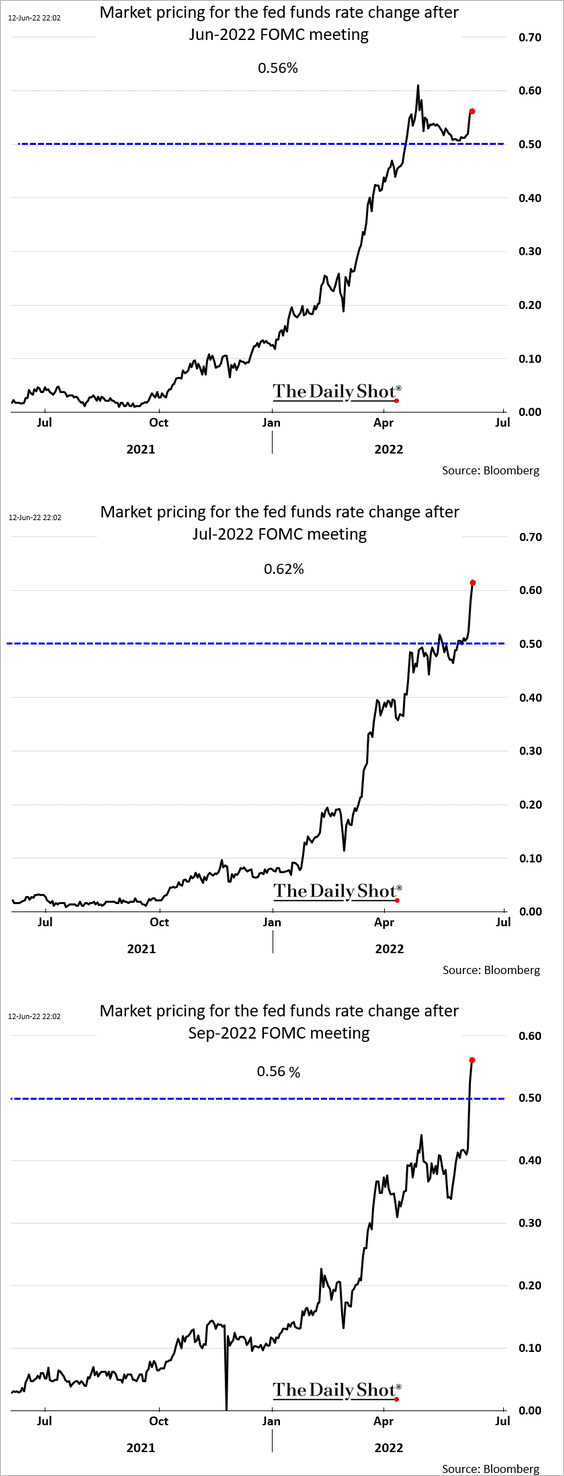
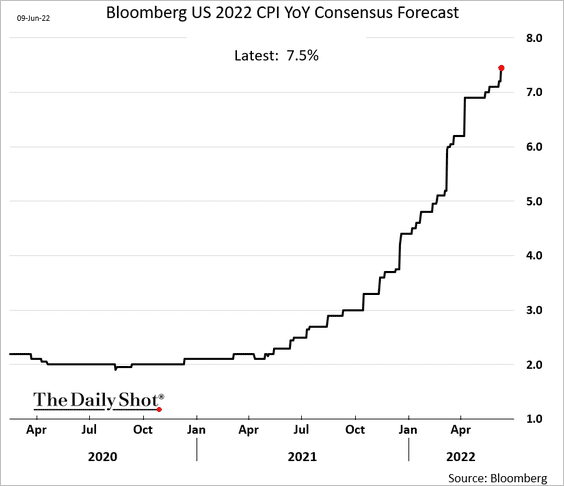
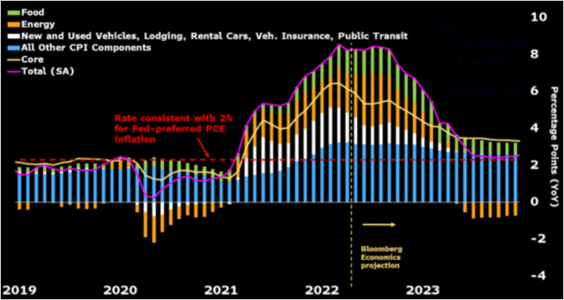
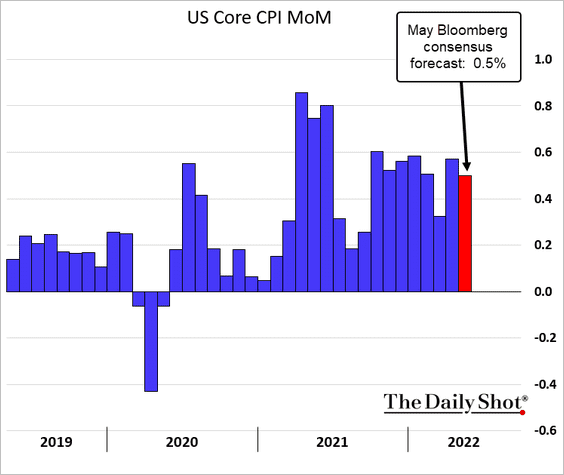
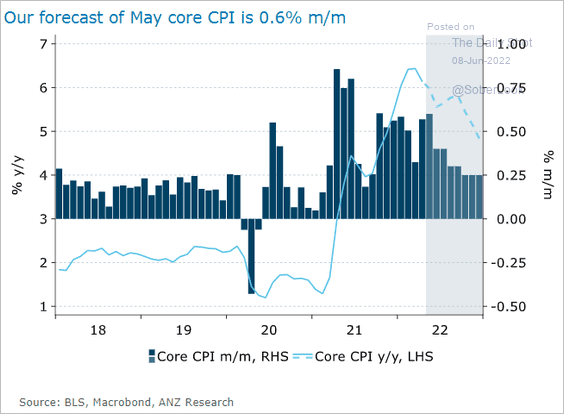
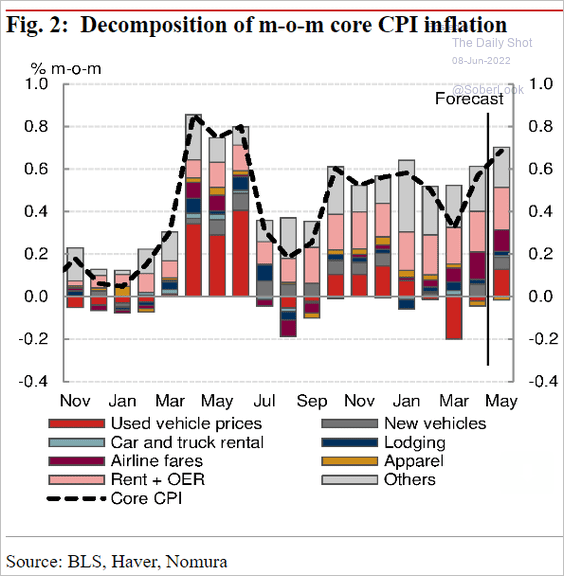
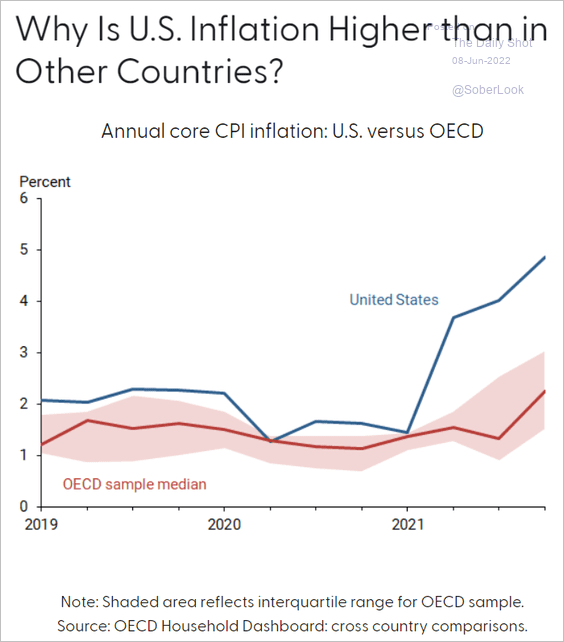
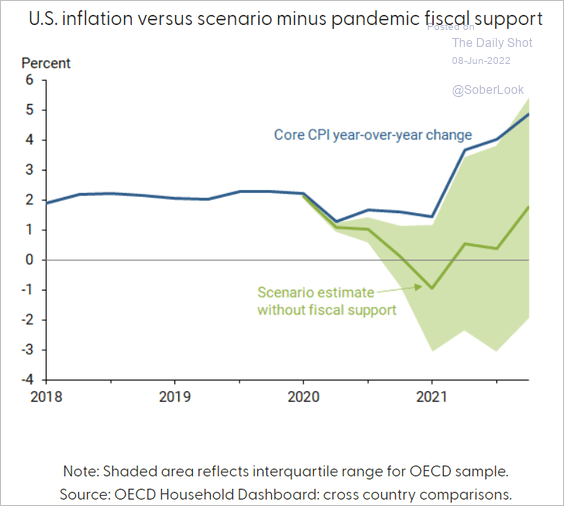
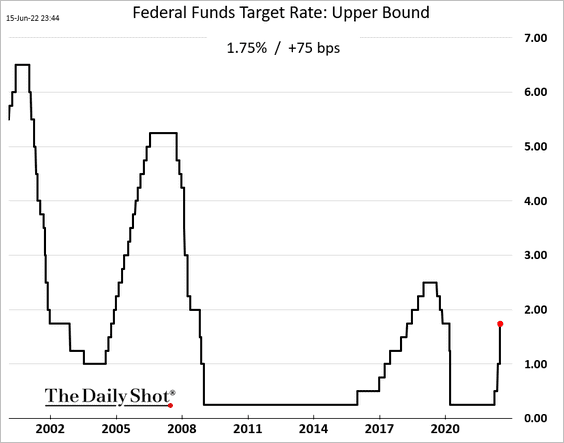
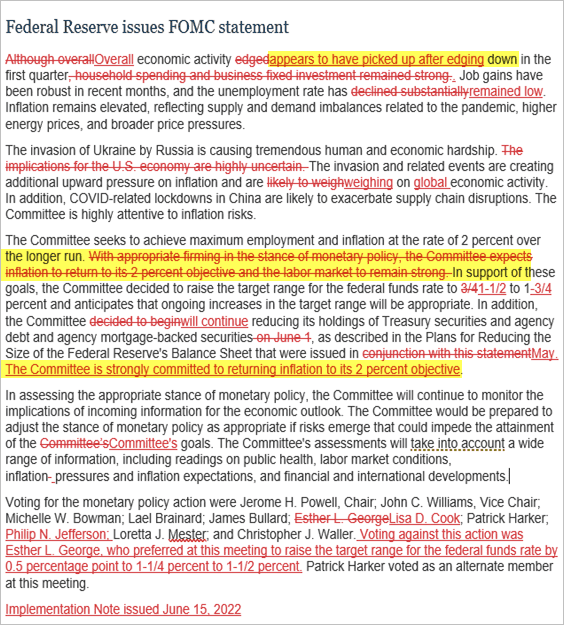
1. The Fed delivered its first 75 bps rate hike in decades (as markets expected). The original plan was to raise rates by 50 bps, but the situation changed after the May CPI report on Friday.
The FOMC removed this sentence from its statement.
With appropriate firming in the stance of monetary policy, the committee expects inflation to return to its 2% objective, and for the labor market to remain strong.
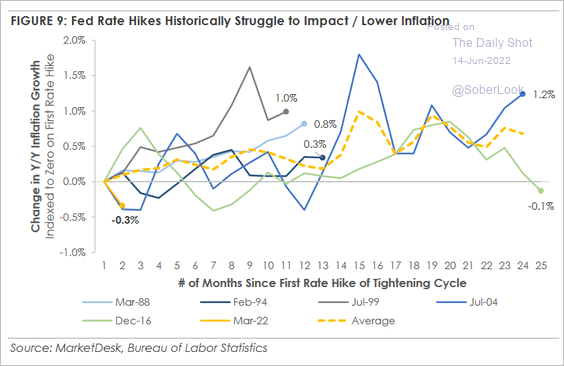
Fighting inflation has become a much less certain enterprise, and it may require a more severe blow to the labor market to achieve this goal.
 Source: @GregDaco
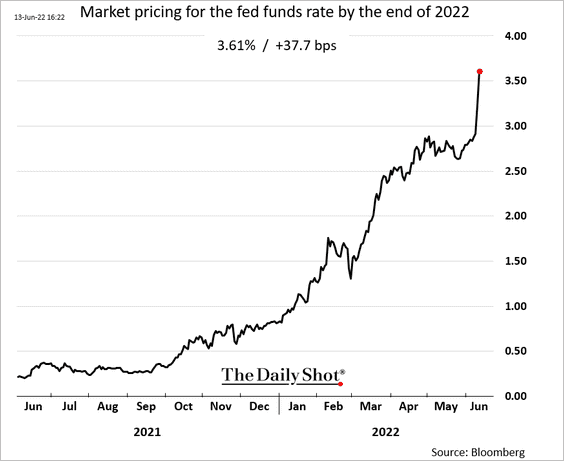
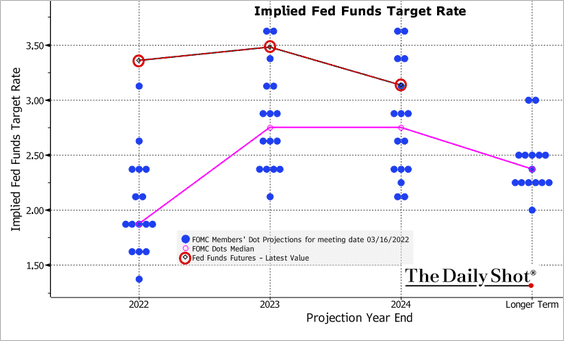
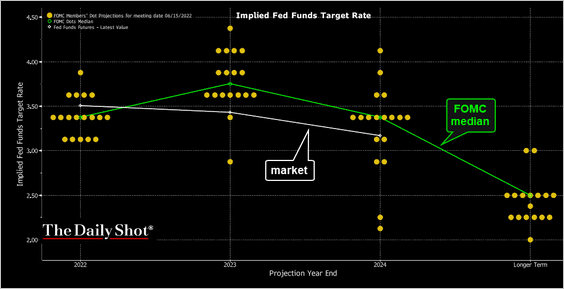
• The latest dot-plot is more in line with the markets.
 Source: @TheTerminal, Bloomberg Finance L.P.
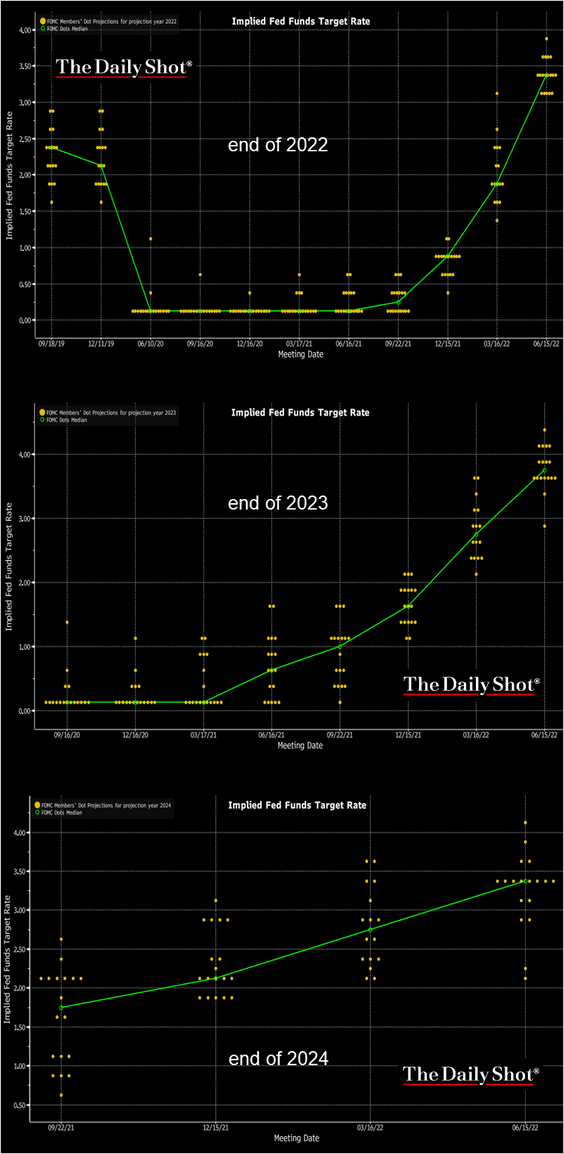
Here is the evolution of the dot-plot over time.
 Source: @TheTerminal, Bloomberg Finance L.P.
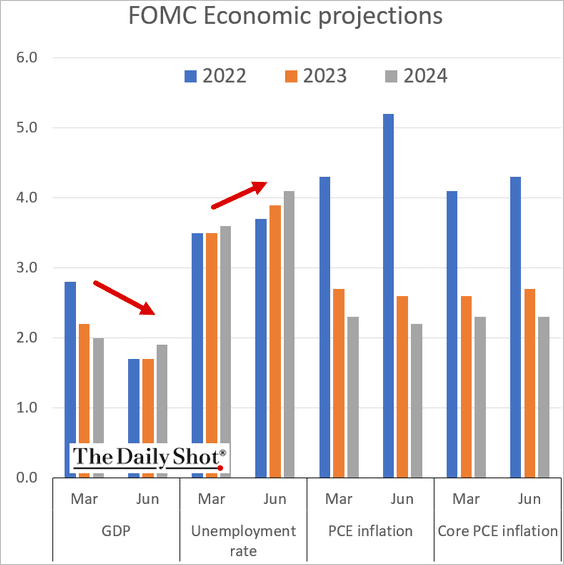
• The FOMC downgraded its GDP projections and boosted the forecasts for unemployment. The collateral damage from this inflation battle is now expected to be more severe, narrowing the path to a “soft landing.”
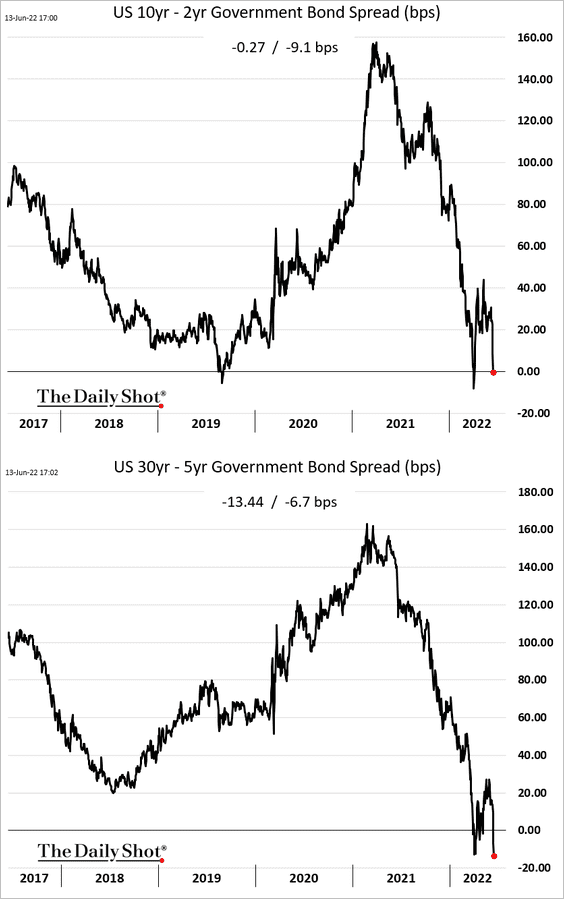
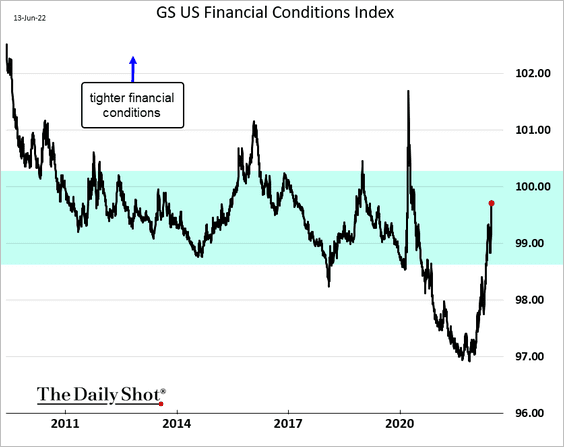
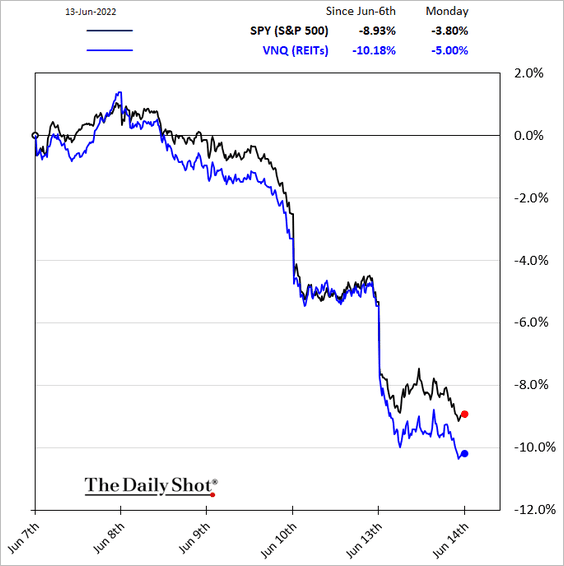
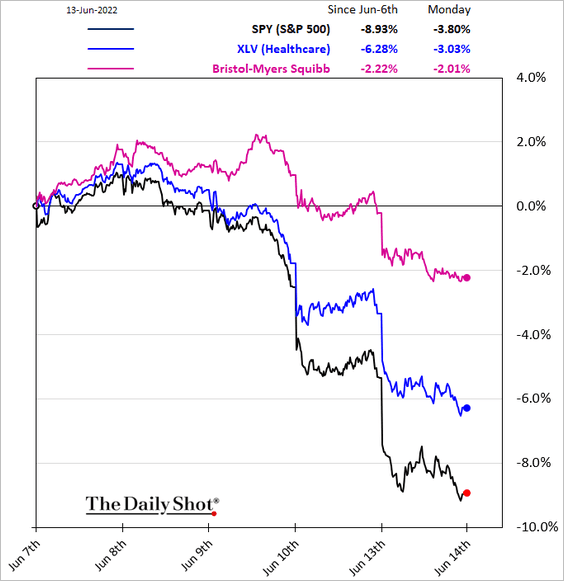
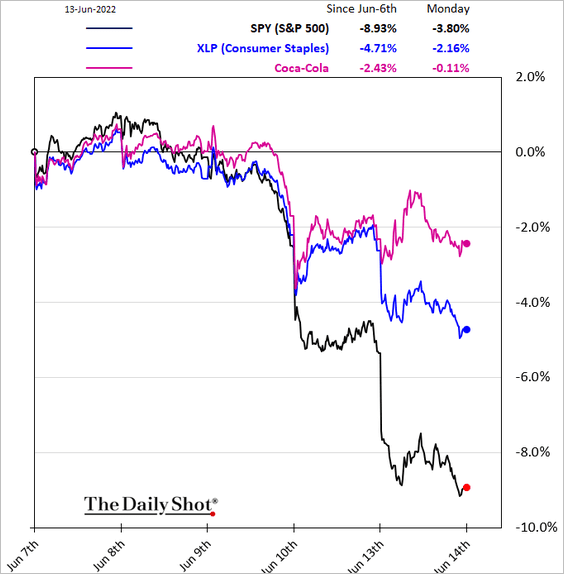
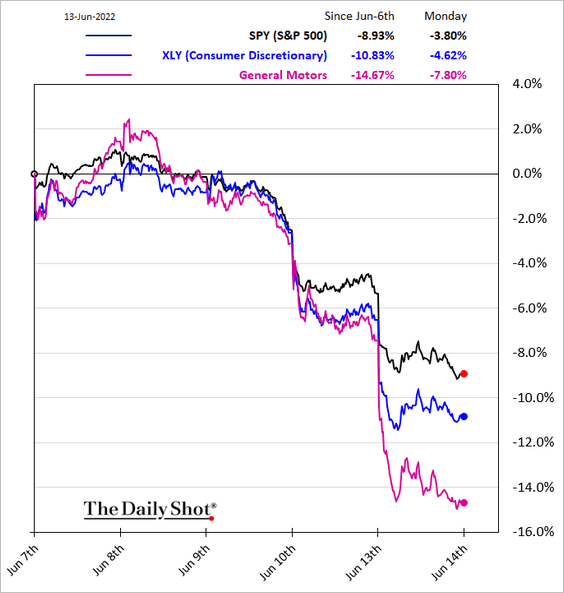
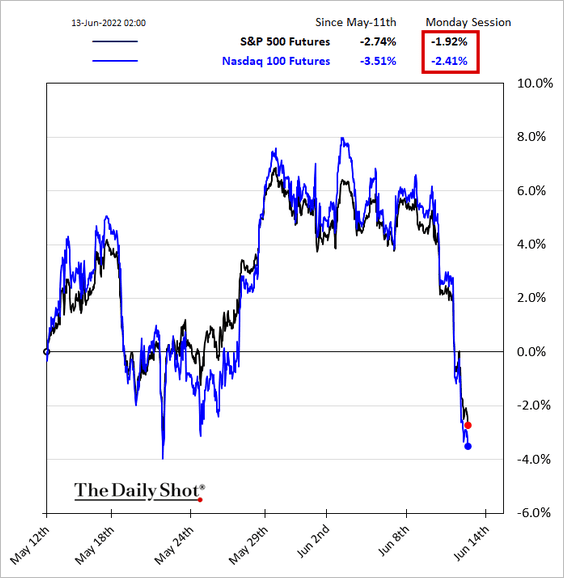
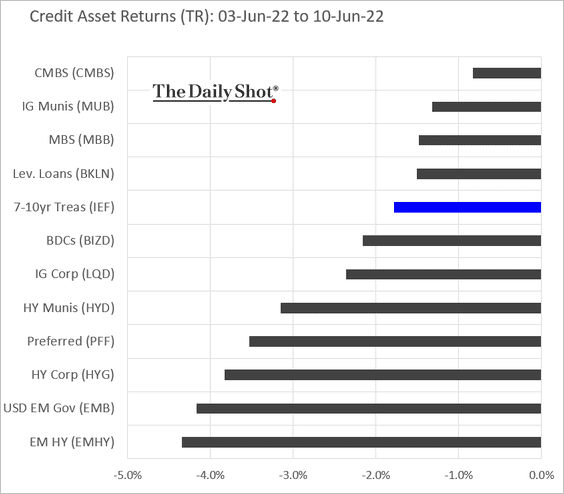
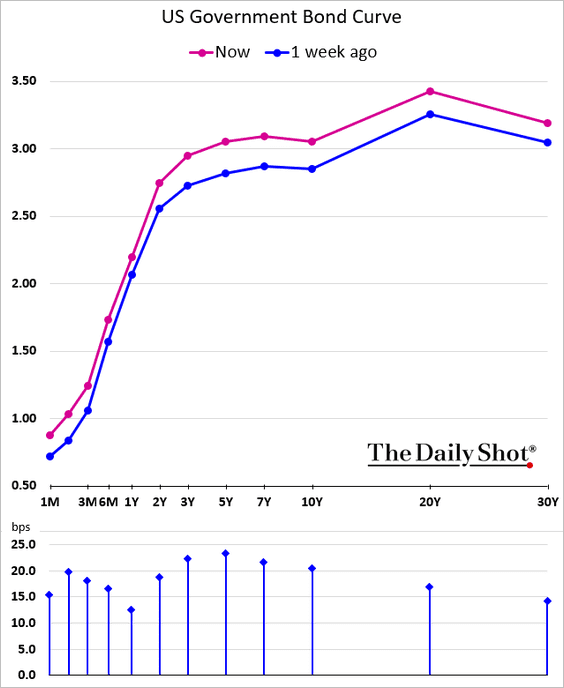
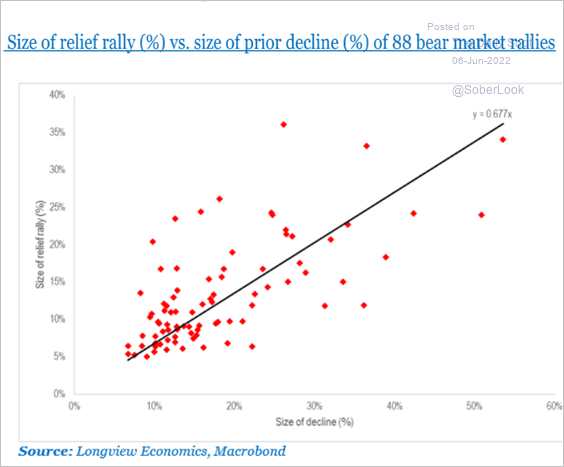
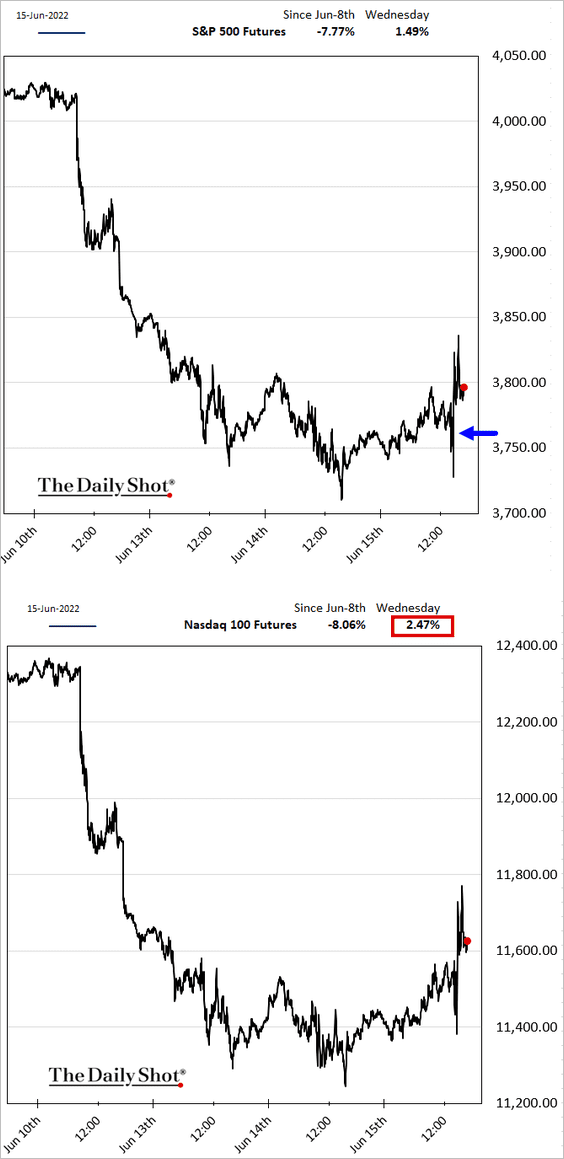
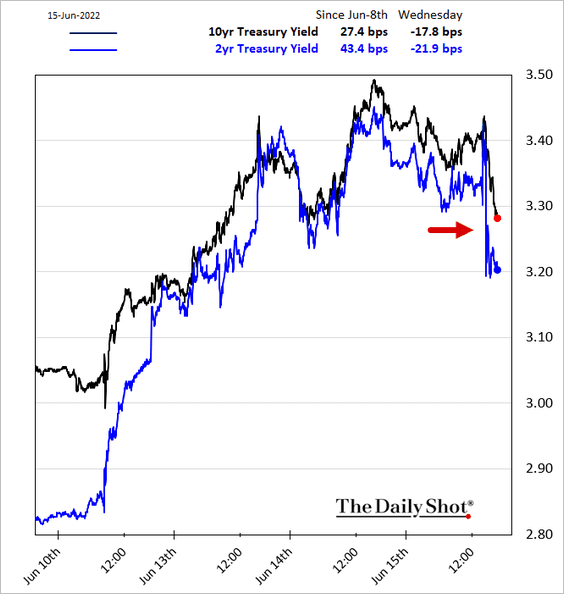
2. The markets reacted with a relief rally, which might be short-lived.
– Equities:
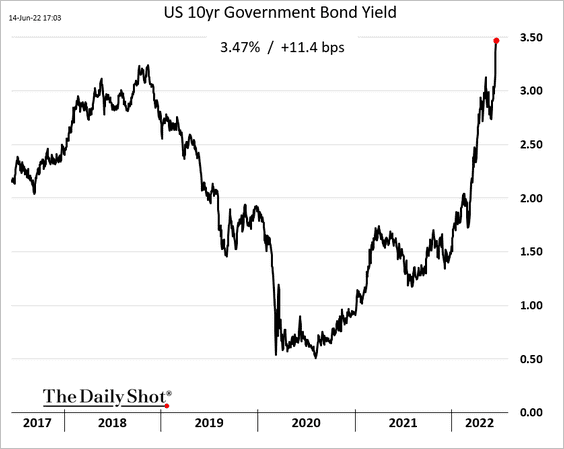
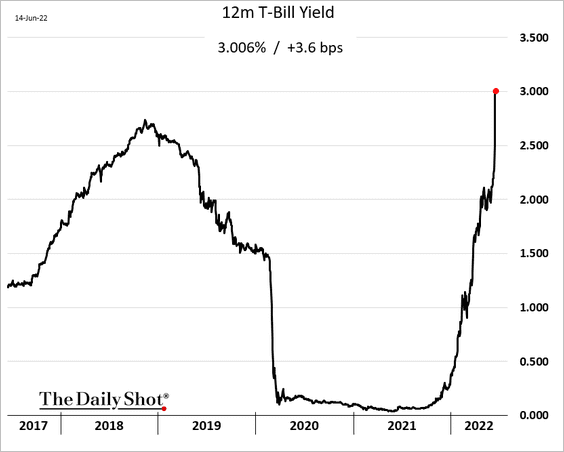
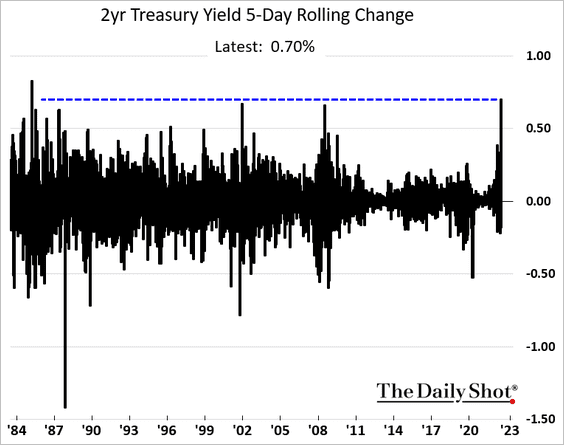
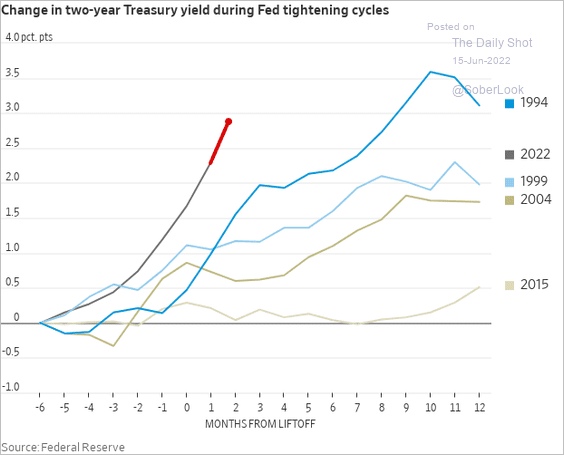
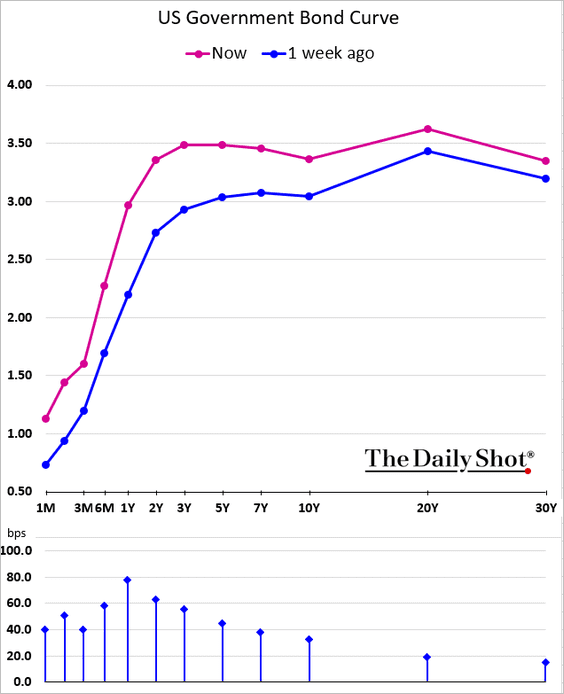
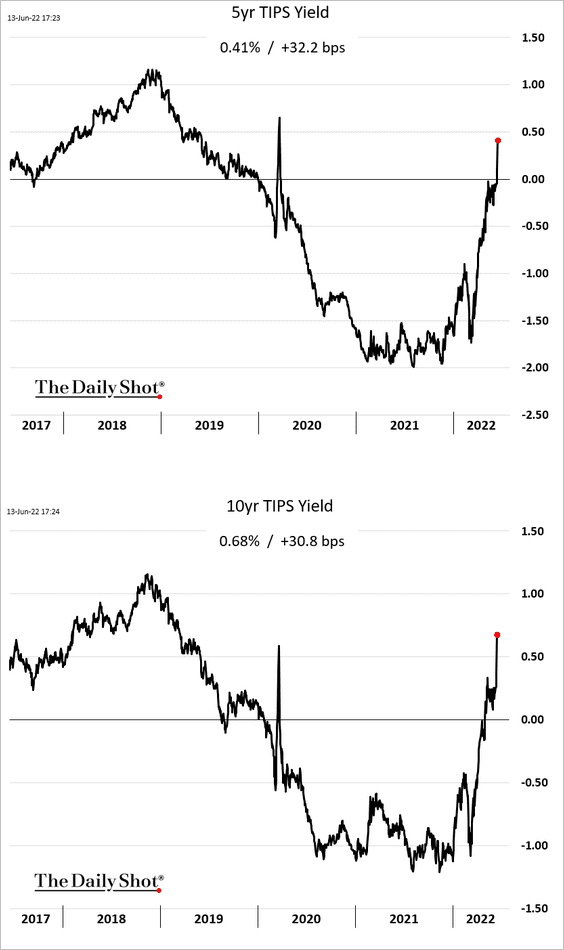
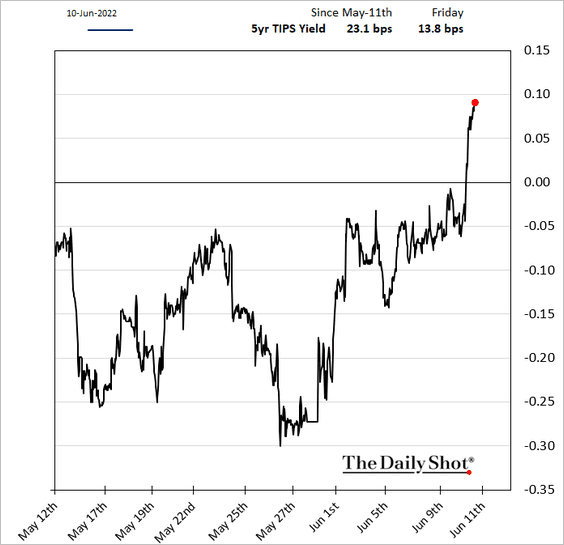
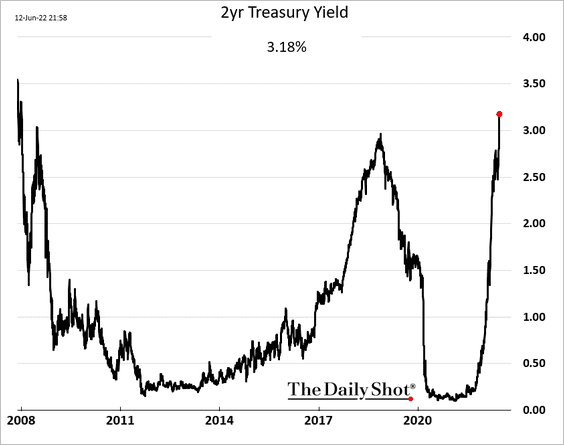
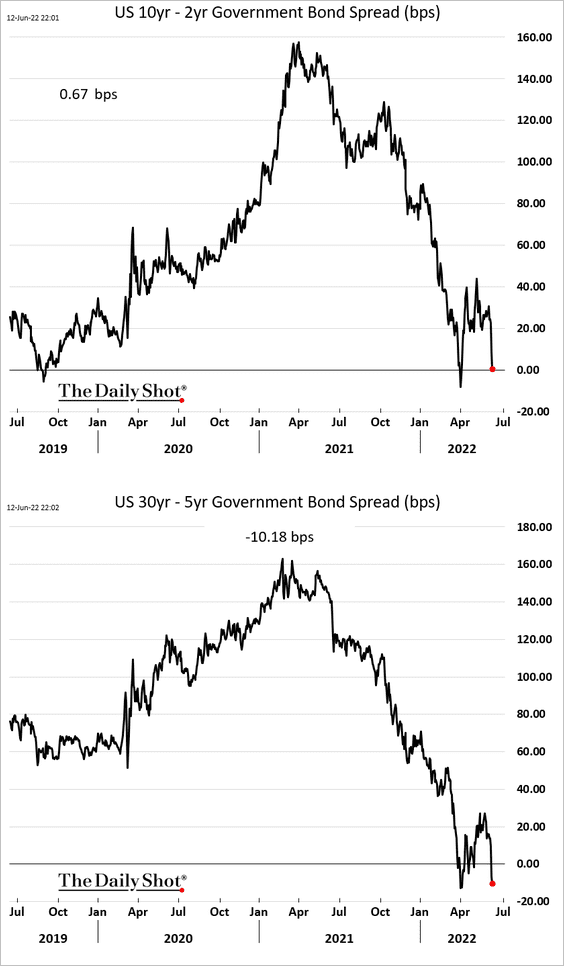
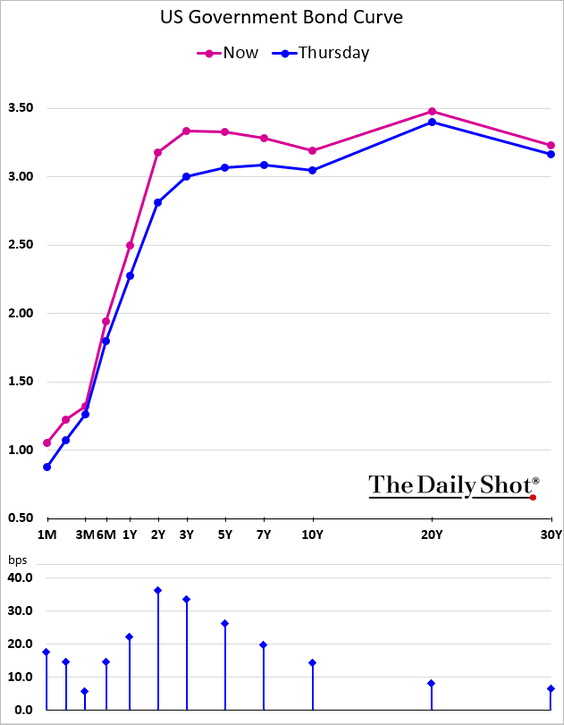
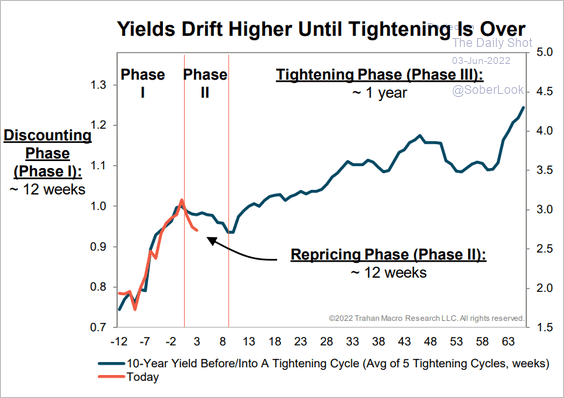
– Treasury yields:
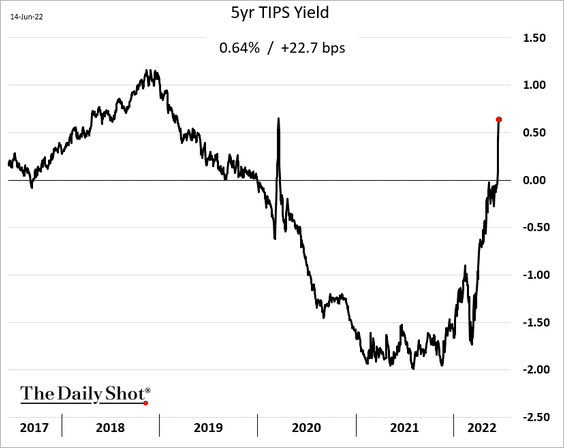
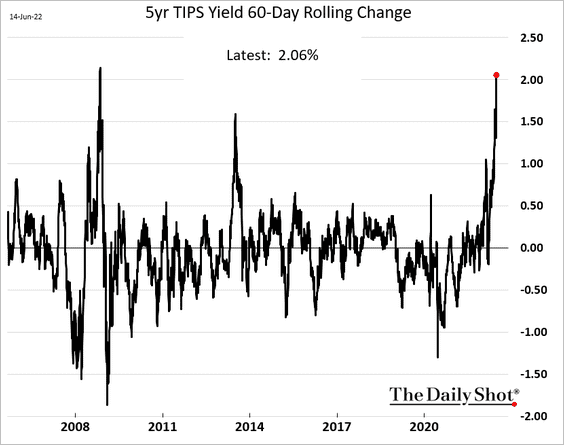
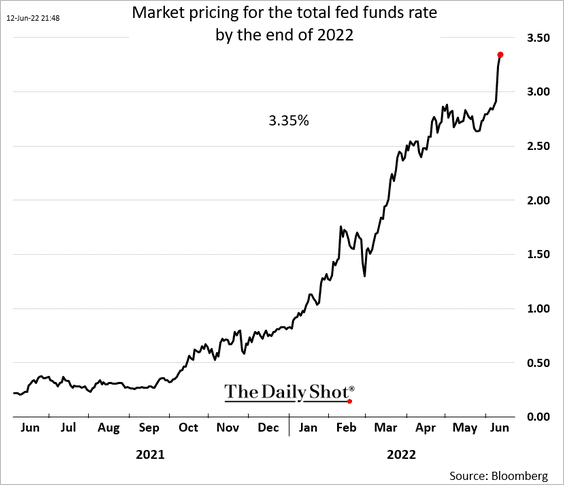
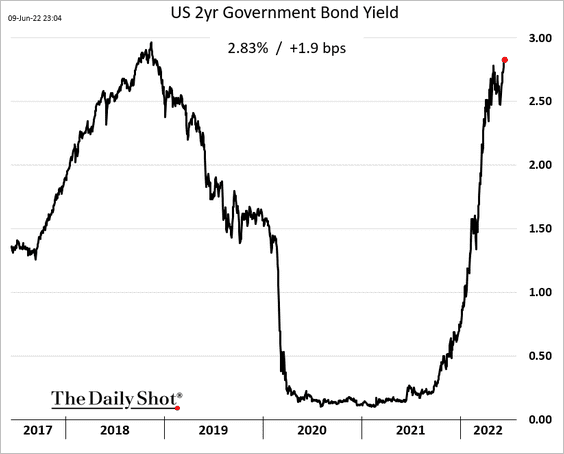
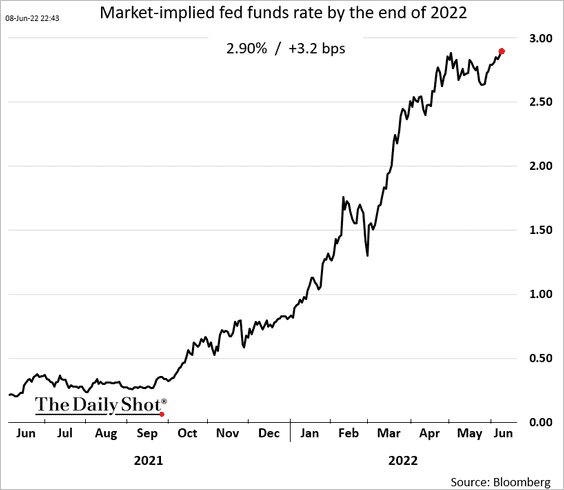
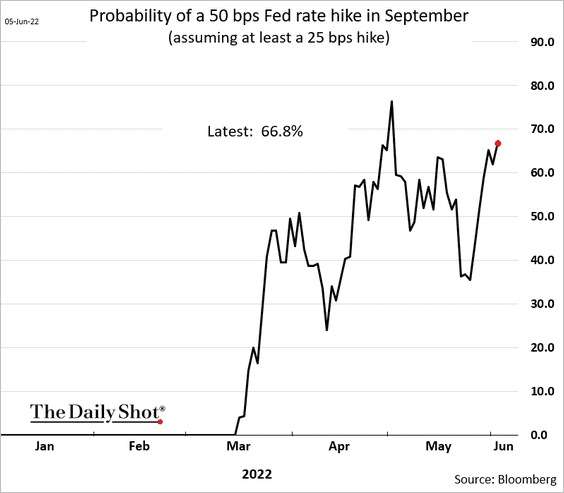
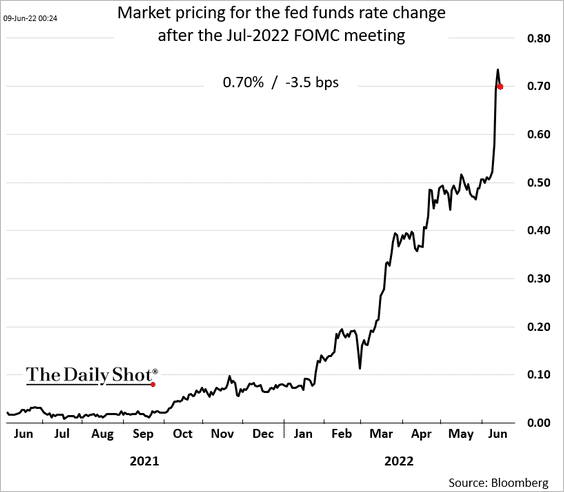
• Another 75 bps rate hike in July is still very likely.
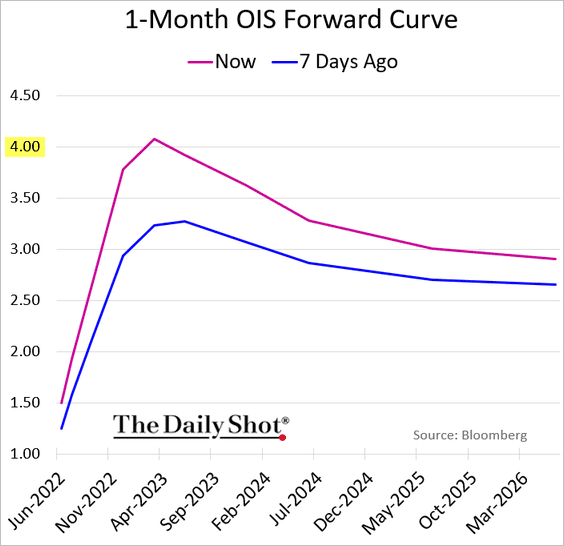
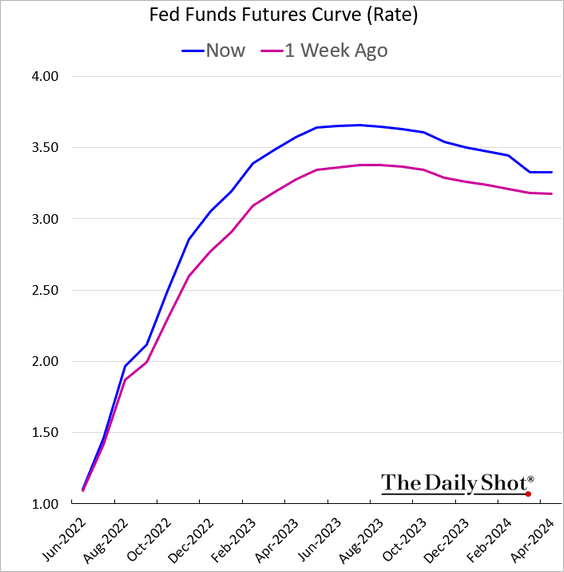
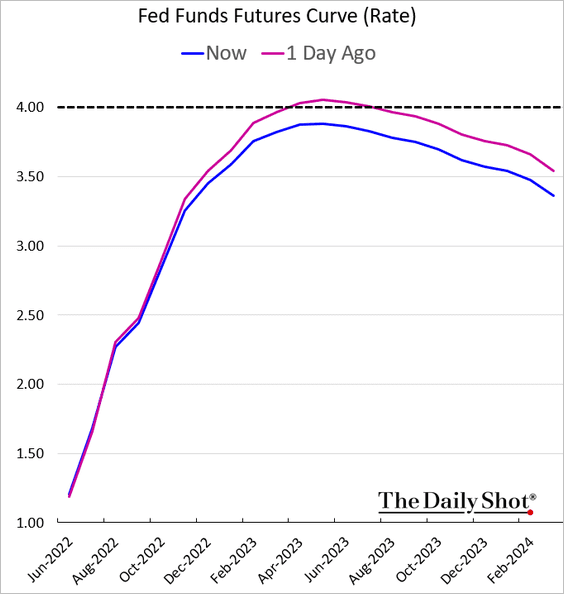
• The terminal rate expectations are back below 4%.
——————–
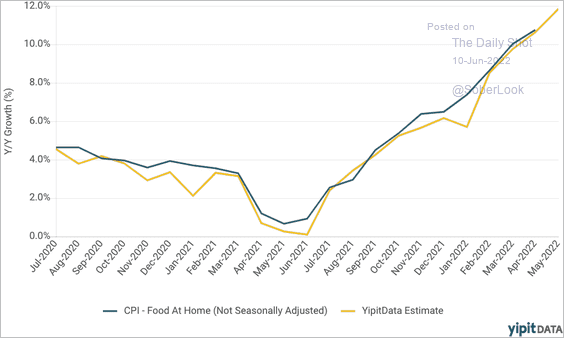
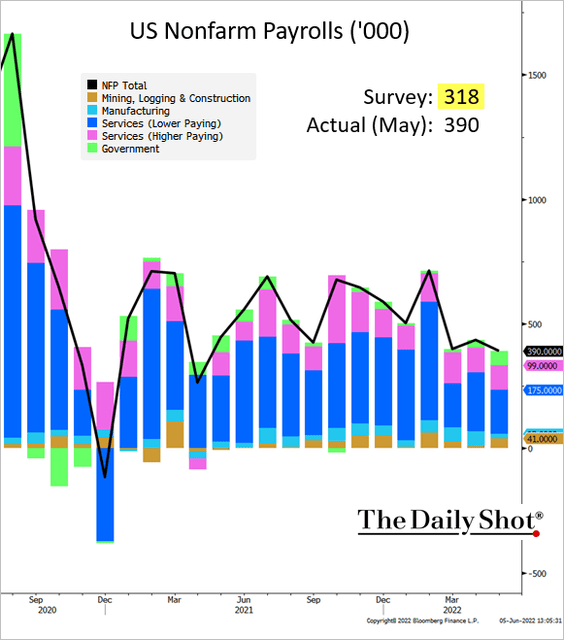
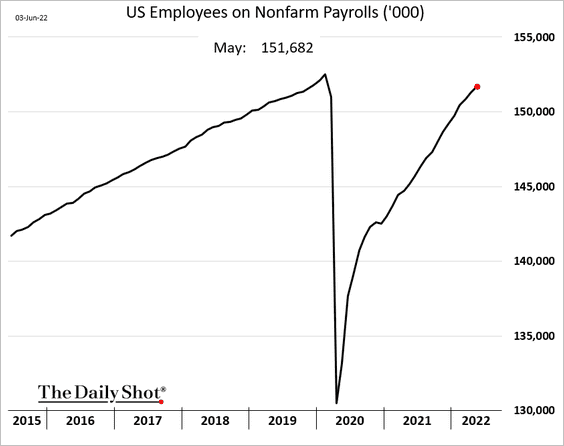
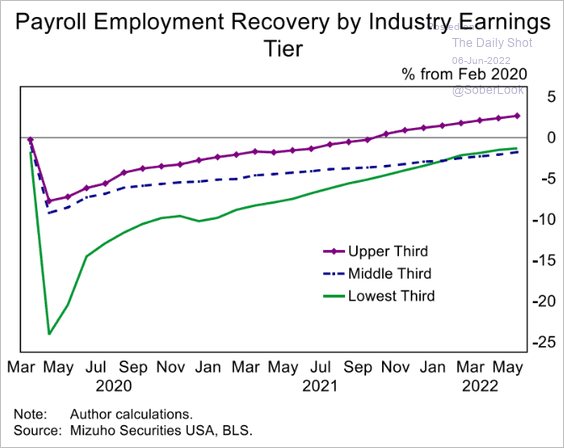
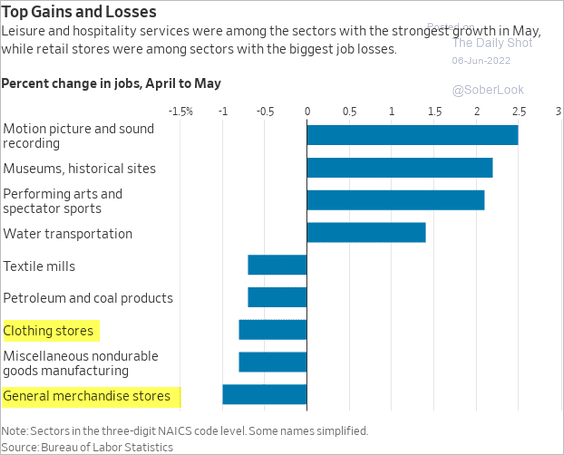
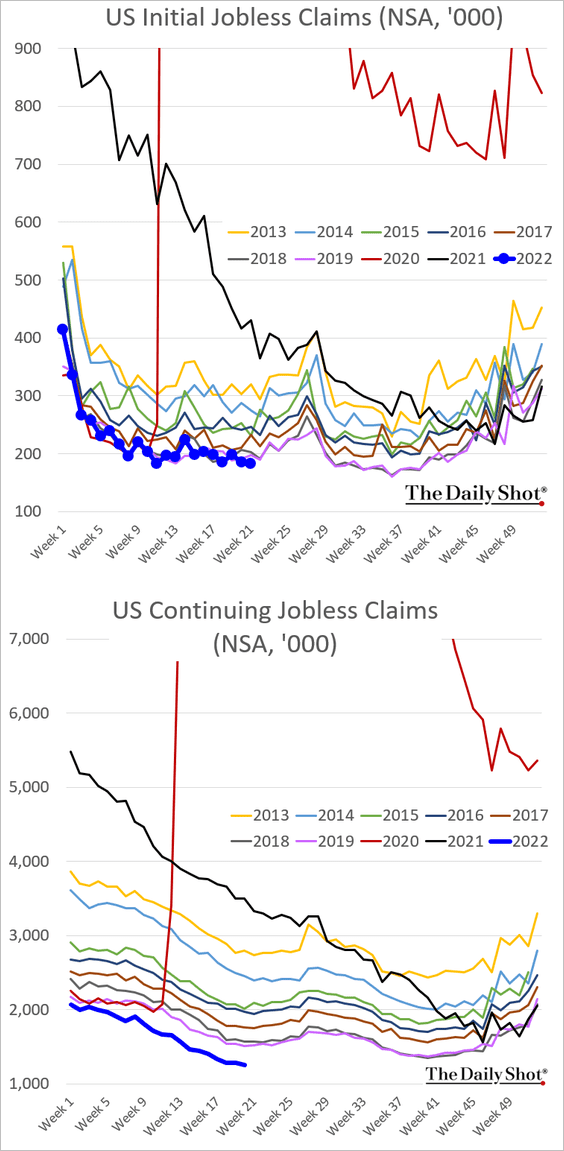
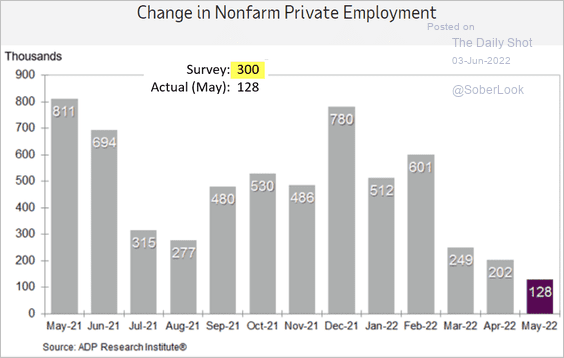
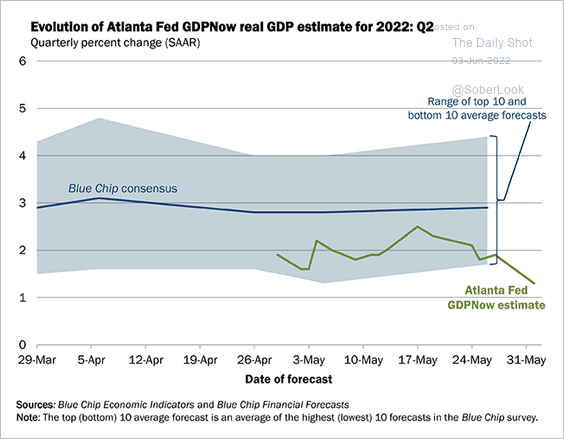
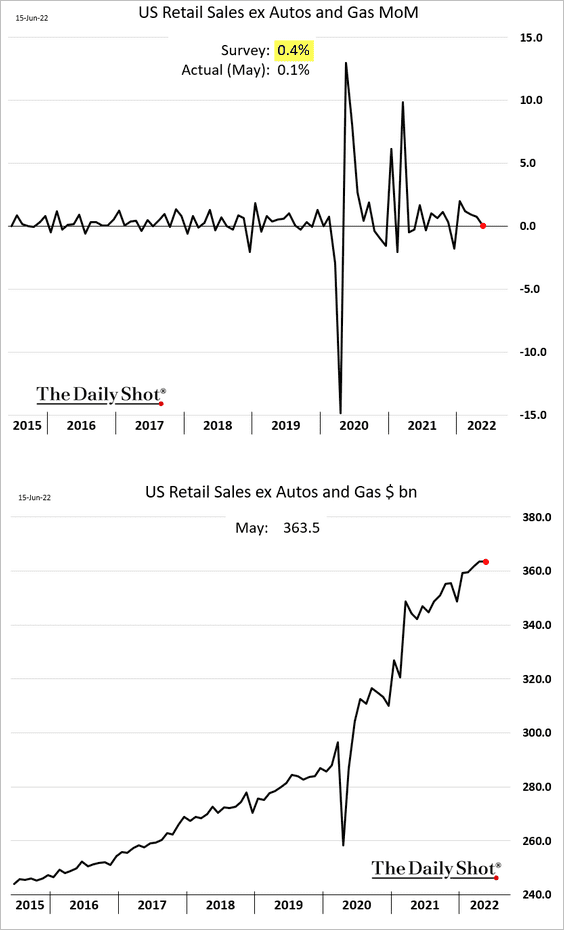
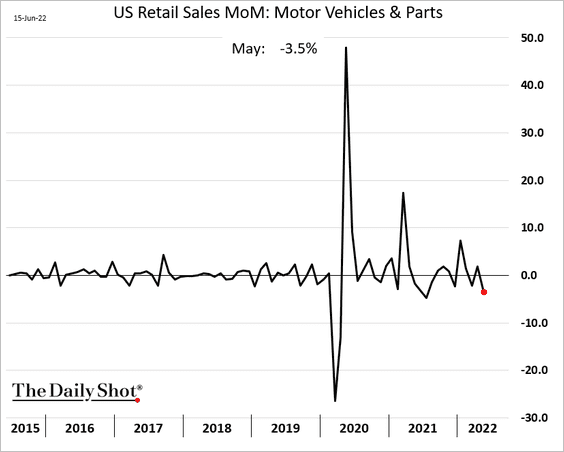
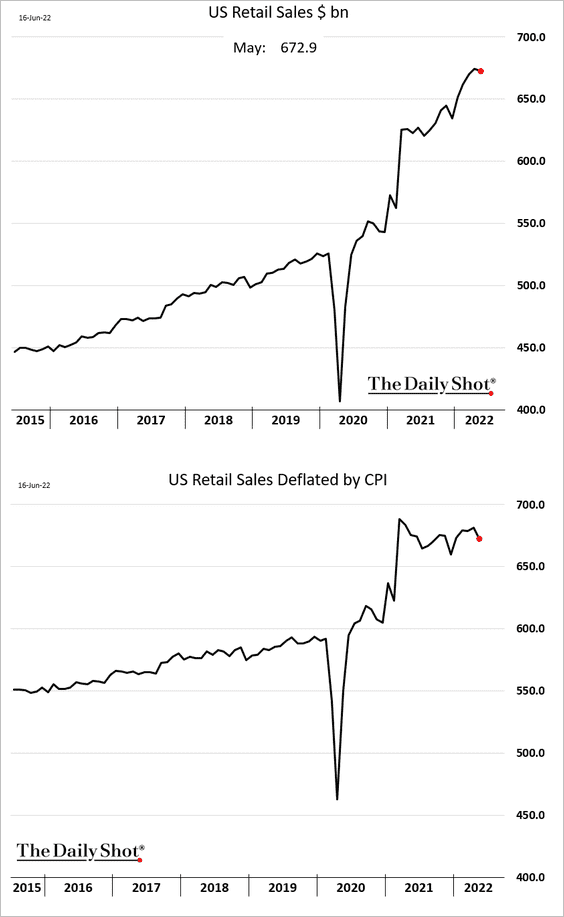
3. Last month’s retail sales surprised to the downside.
• Car sales declined by 3.5%.
• Here is the headline retail sales index. The second panel shows the same index deflated by the CPI.
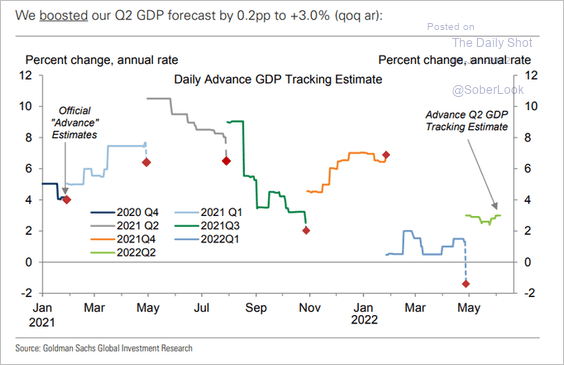
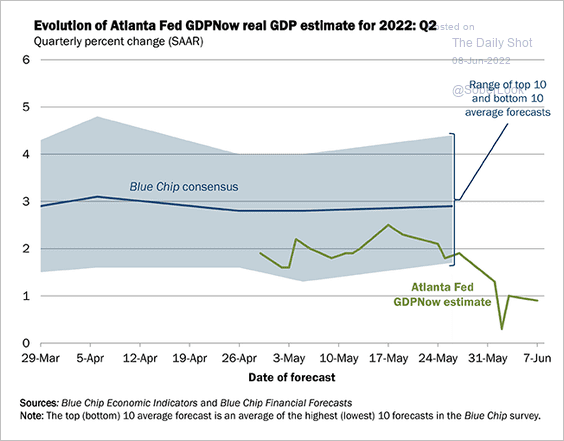
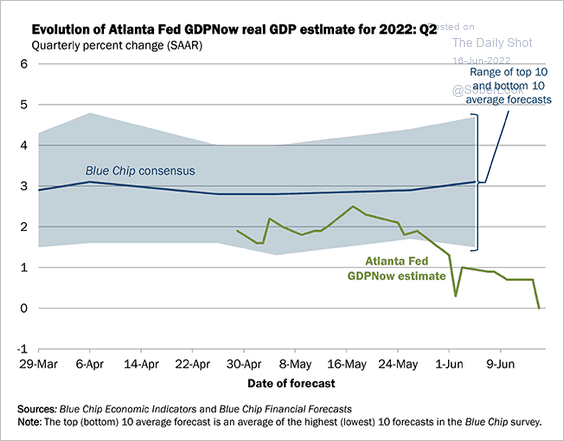
• The Atlanta Fed’s GDPNow model forecast for Q2 growth dropped to zero in response to the weak retail sales report.
 Source: @AtlantaFed Read full article
——————–
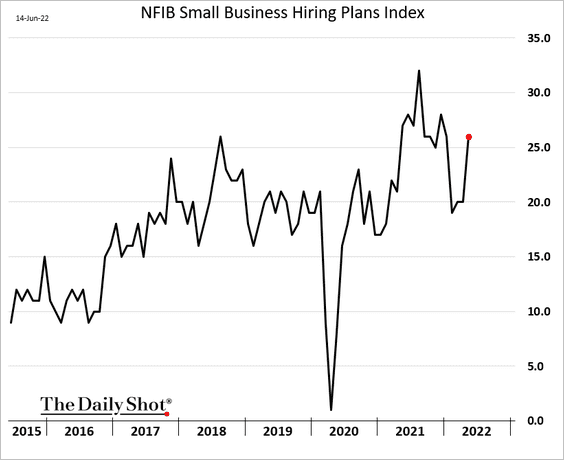
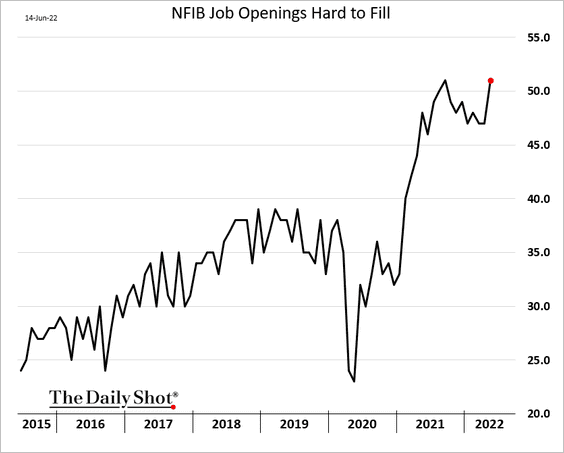
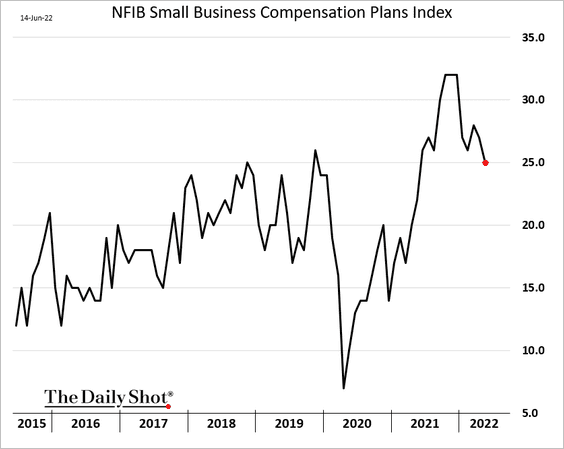
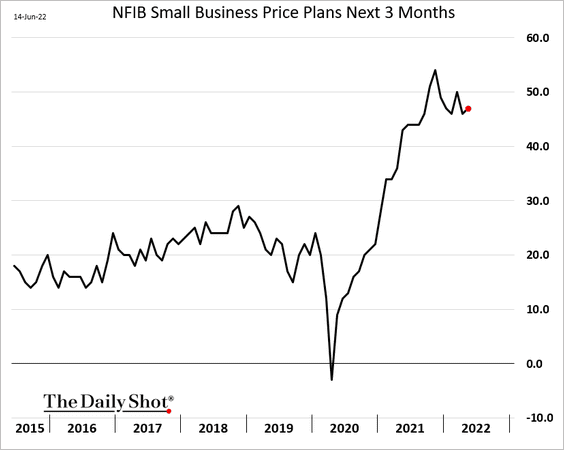
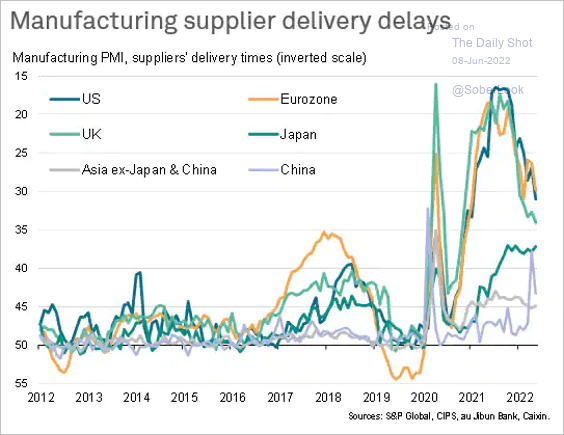
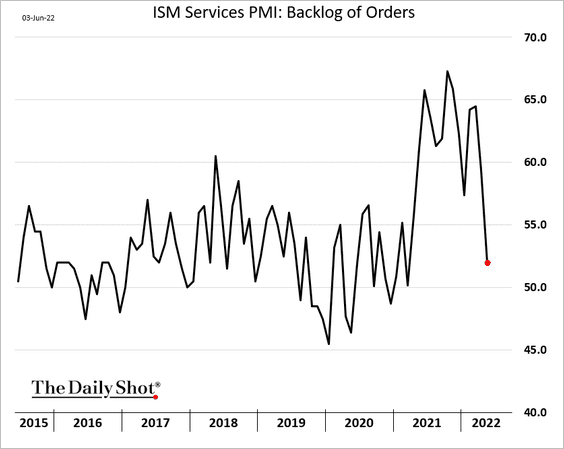
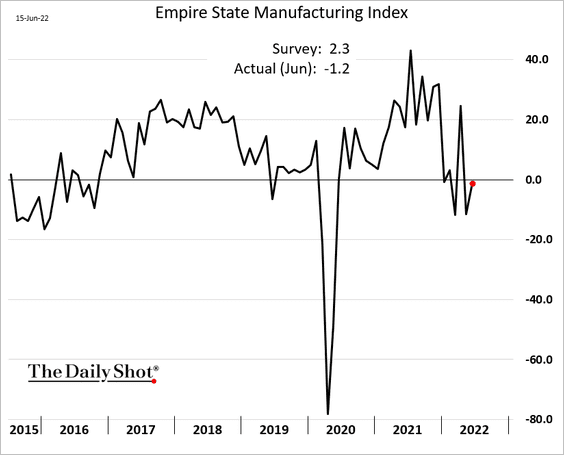
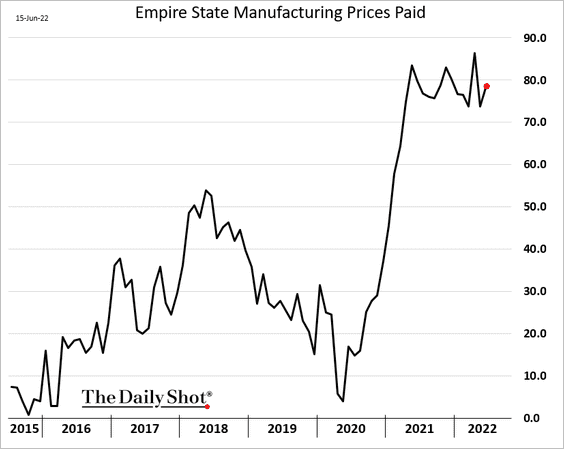
4. The first regional manufacturing report of the month (from the NY Fed) showed business activity staying soft.
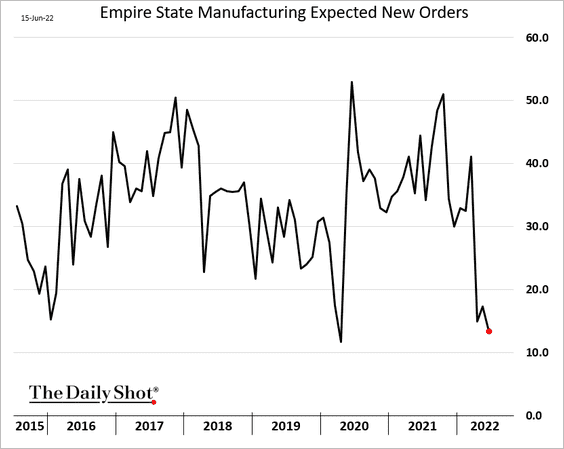
• Expectations for new orders are near the COVID-era lows.
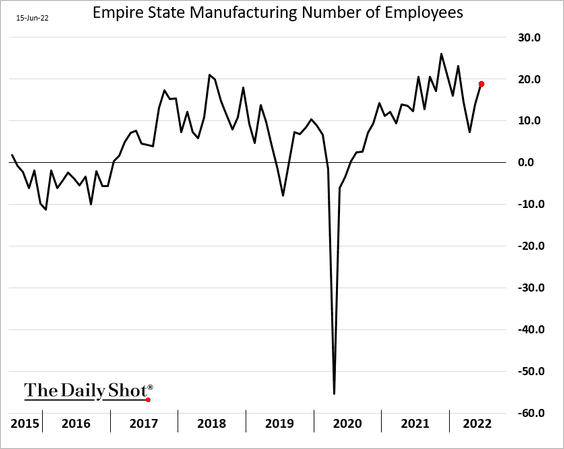
• However, hiring accelerated.
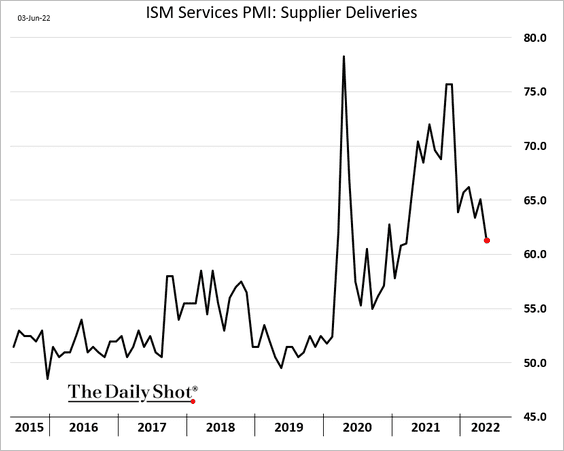
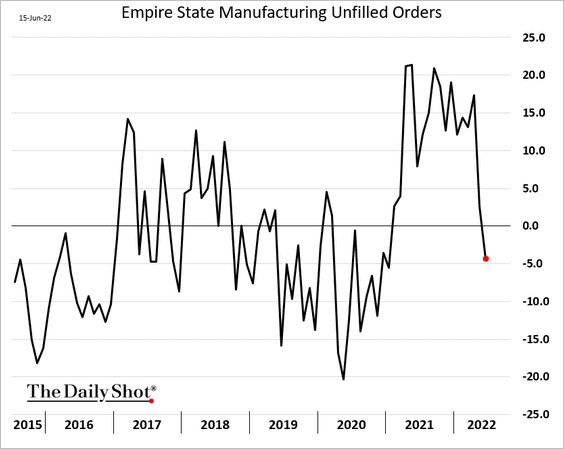
• Supply chain stress is rapidly easing as demand slows.
– Unfilled orders:
– Delivery times:
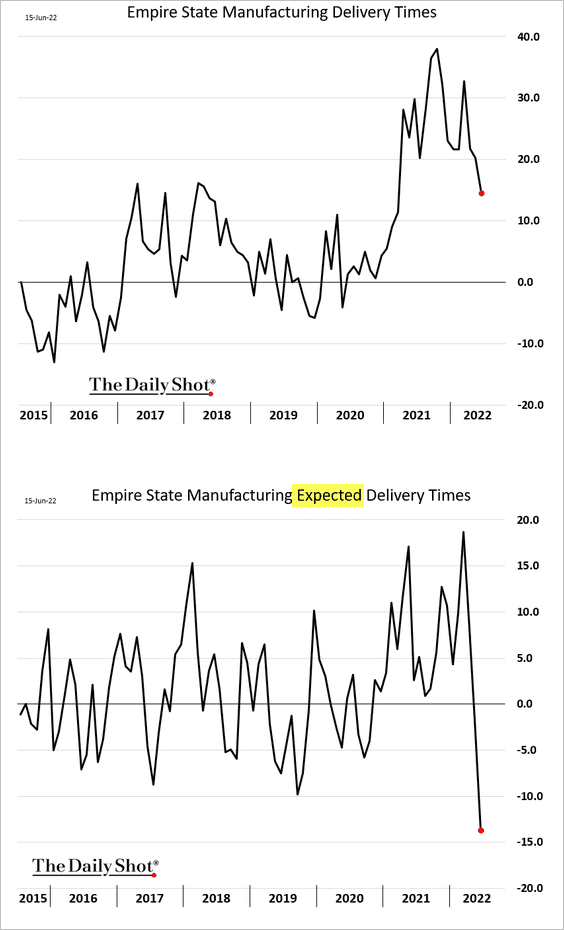
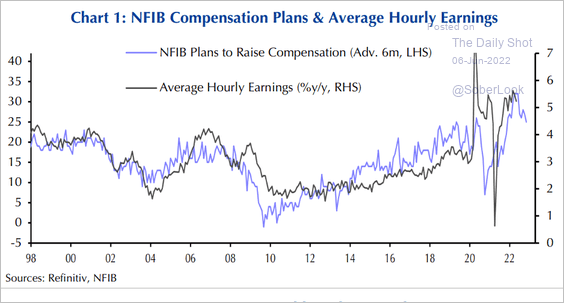
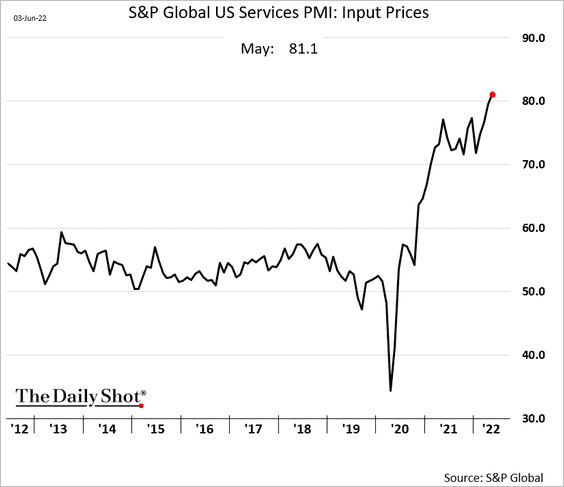
• But there are no signs yet of price pressures easing.
——————–
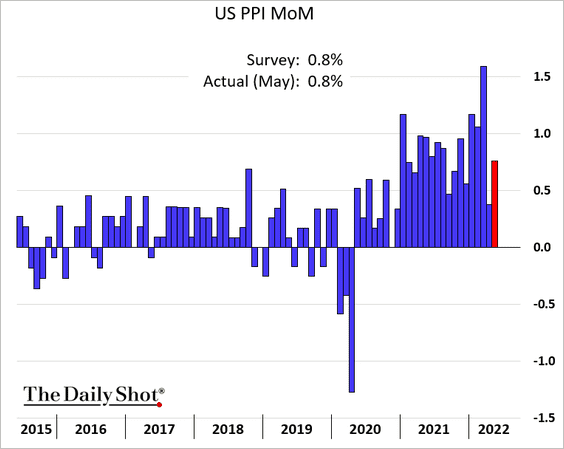
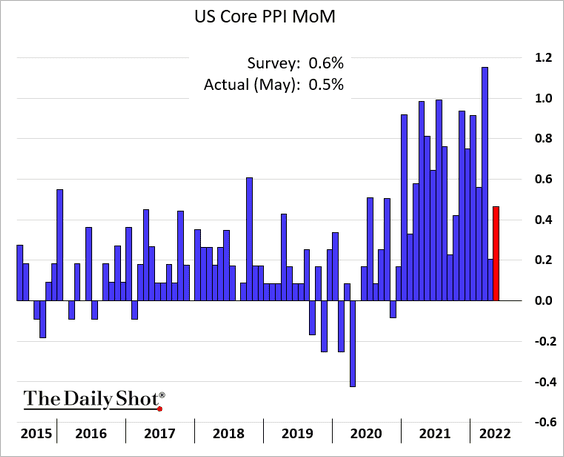
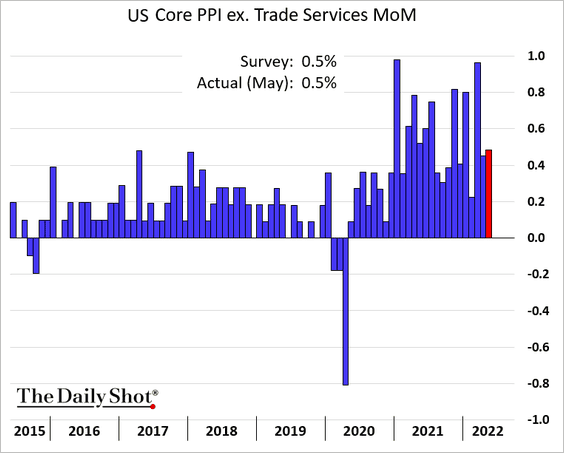
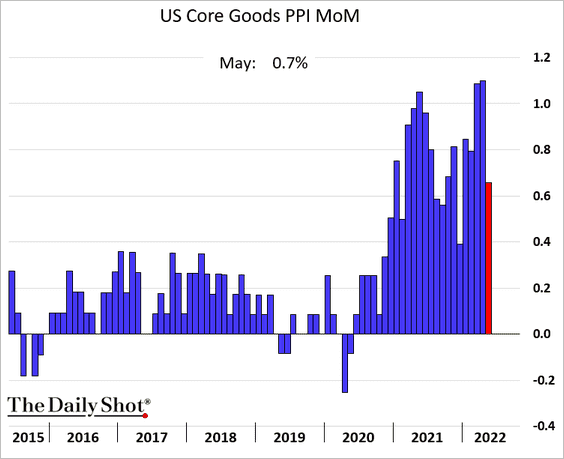
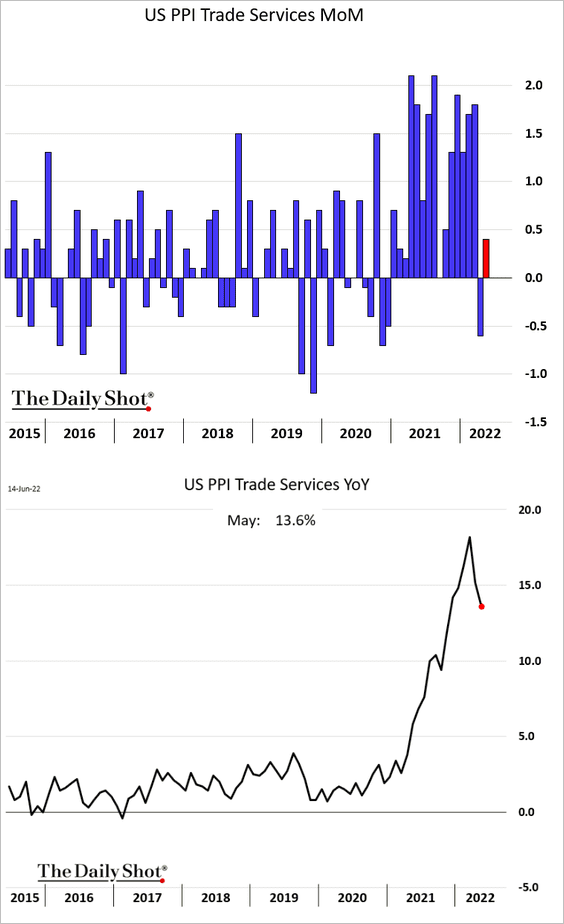
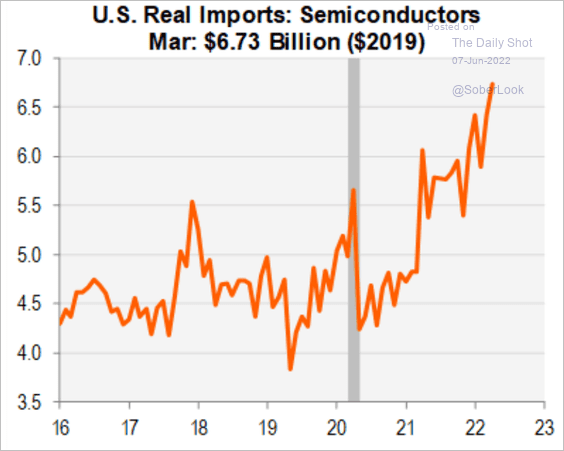
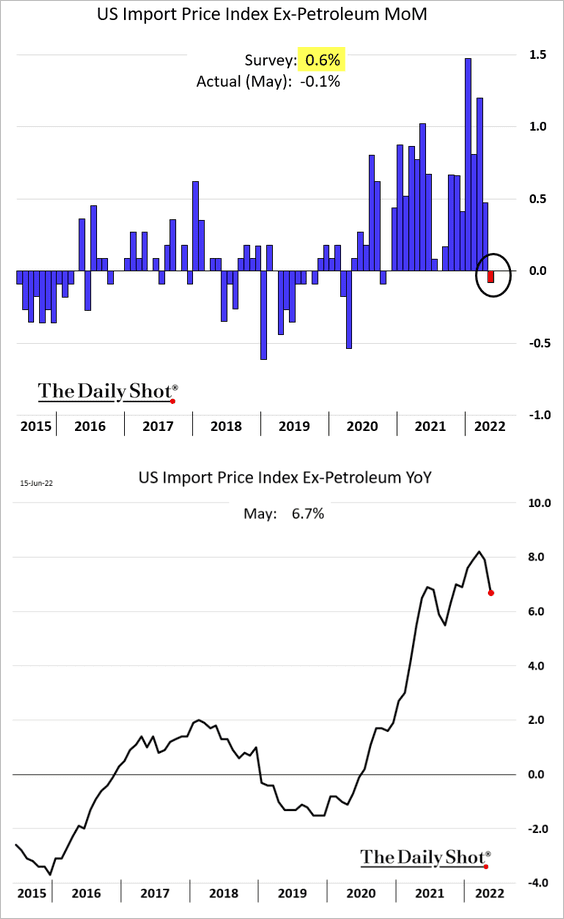
5. The recent US dollar strength helped to slow import price inflation in May.
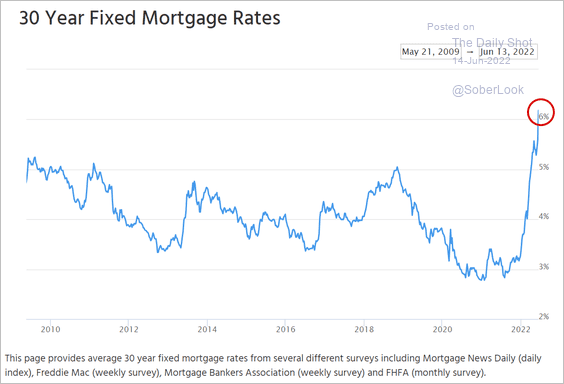
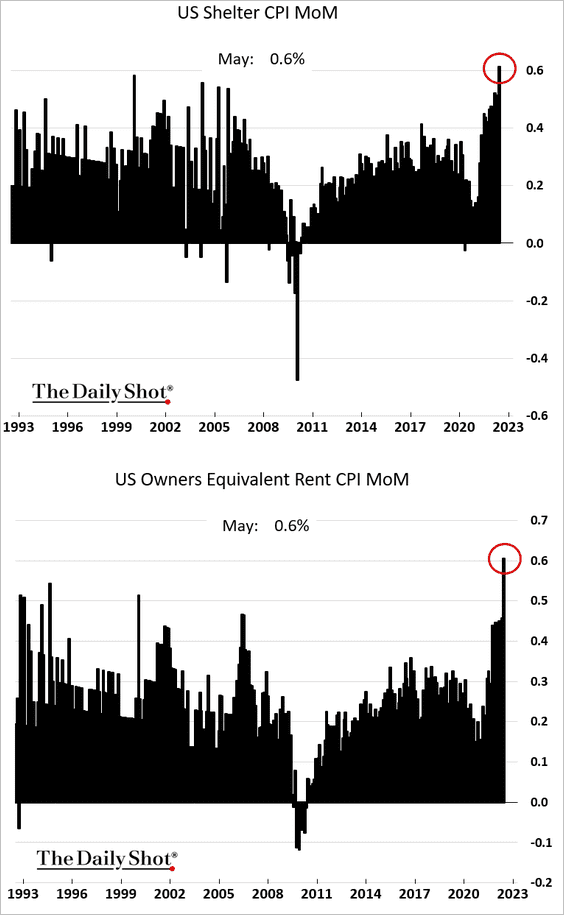
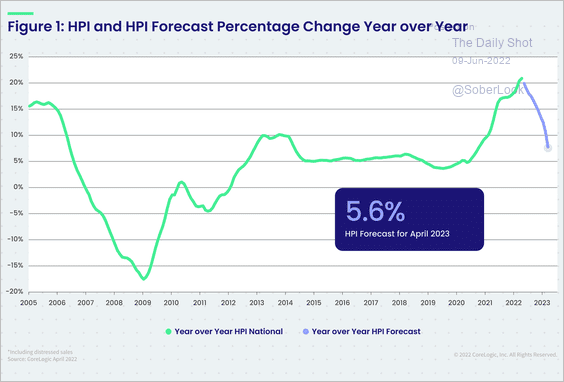
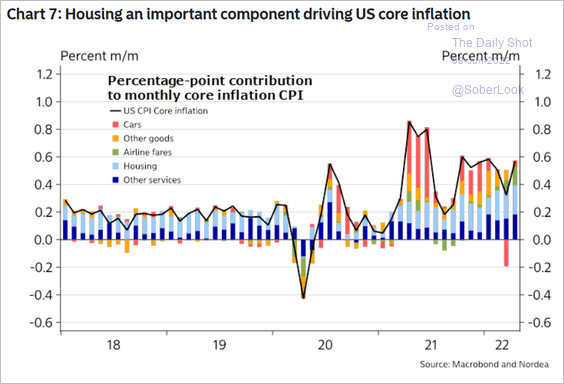
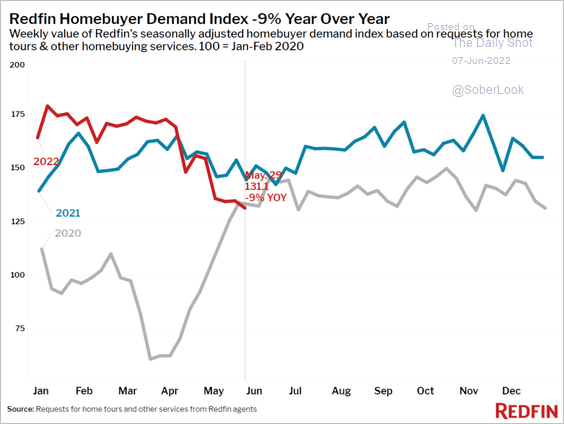
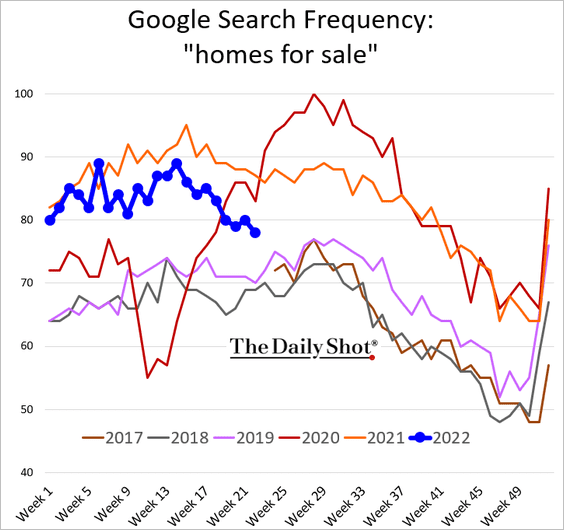
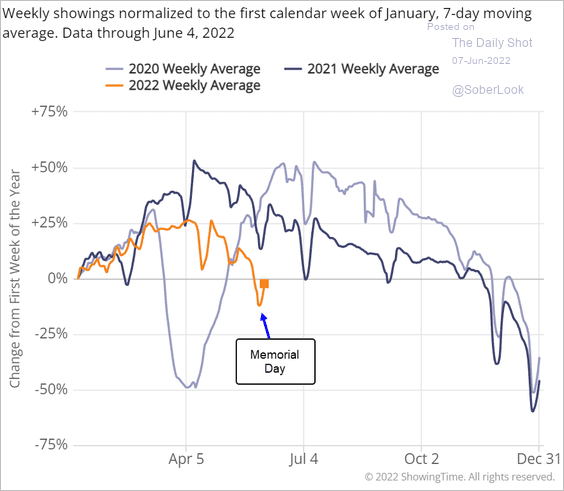
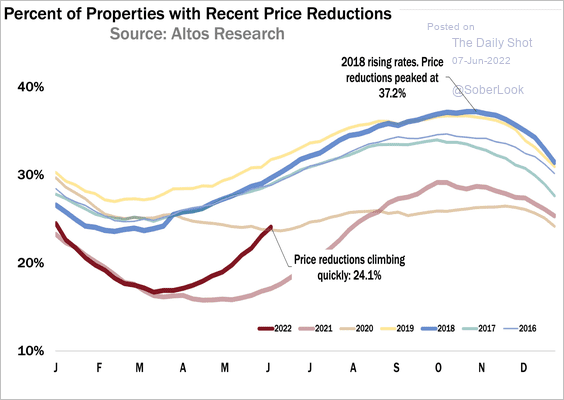
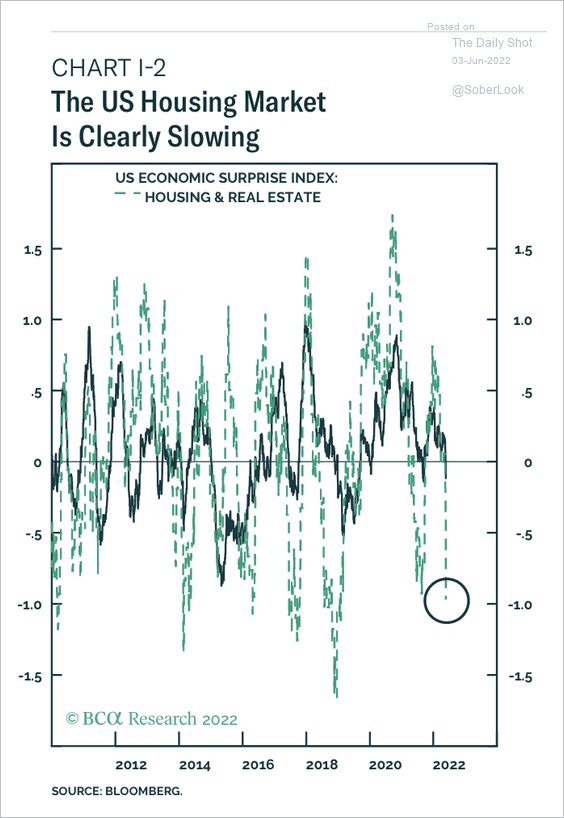
6. Next, we have some updates on the housing market.
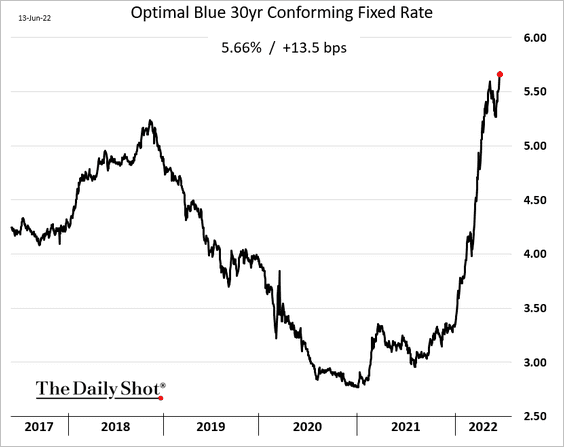
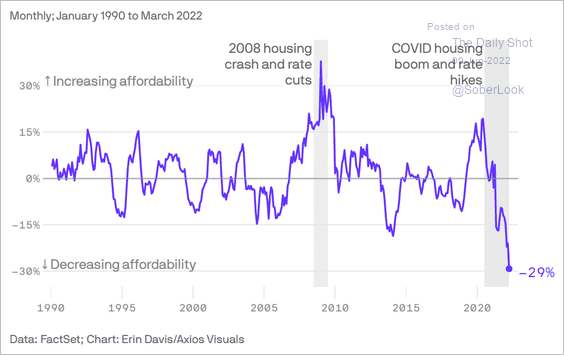
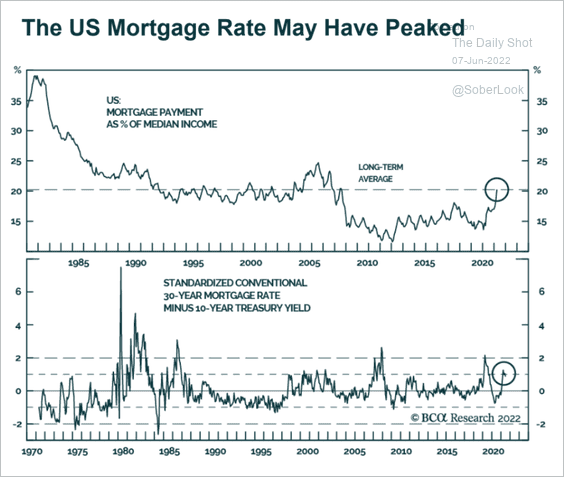
• The 30yr mortgage rate is now firmly above 6%.
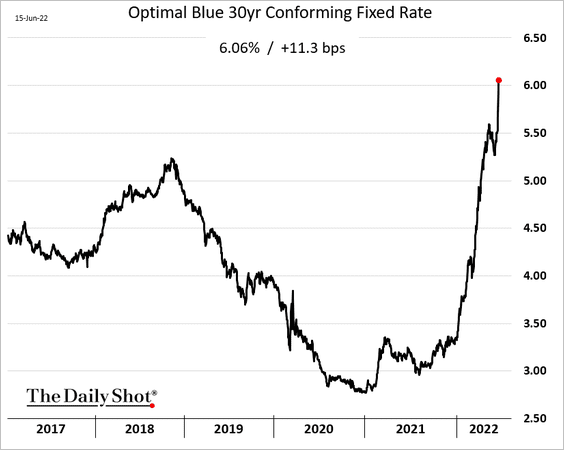
And housing affordability is near the lowest level in 15 years.
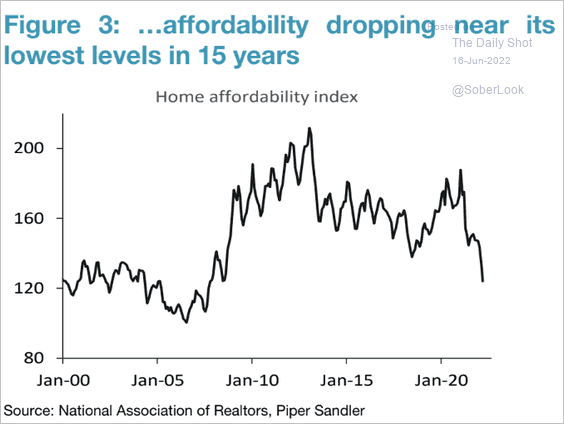 Source: Piper Sandler
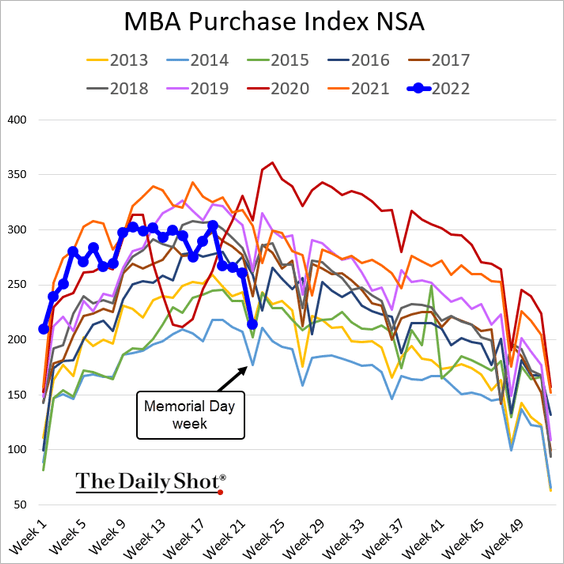
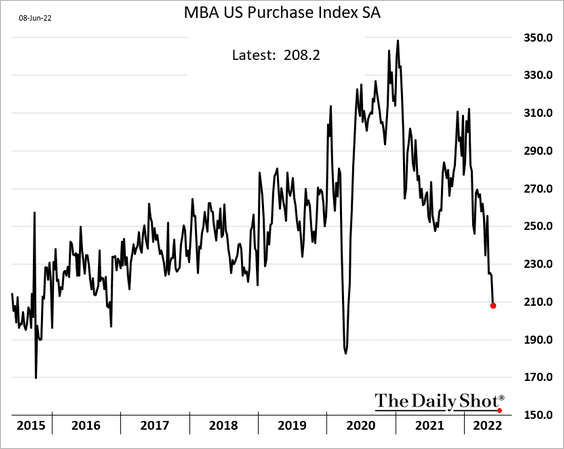
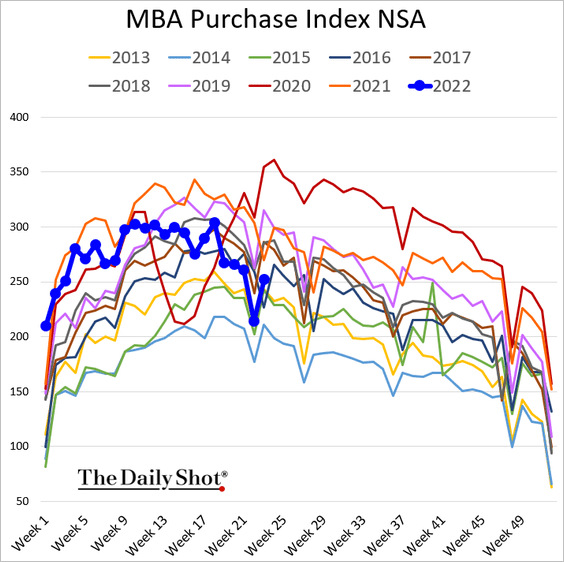
• Mortgage applications are well below last year’s levels, but they are not collapsing.
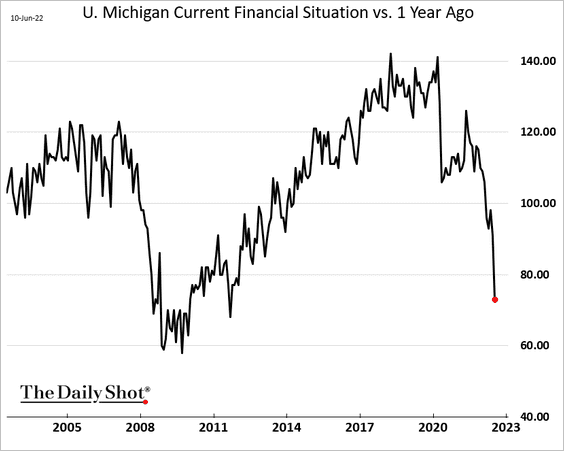
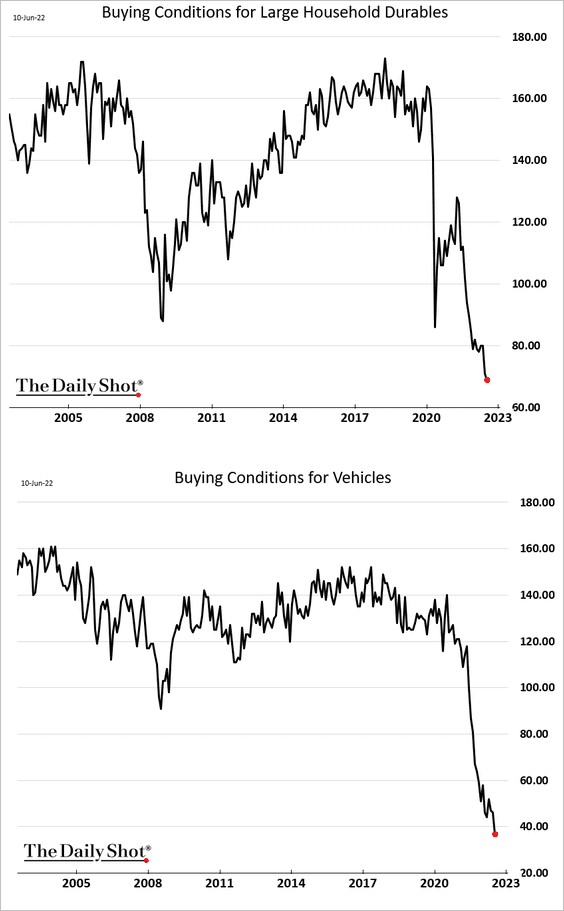
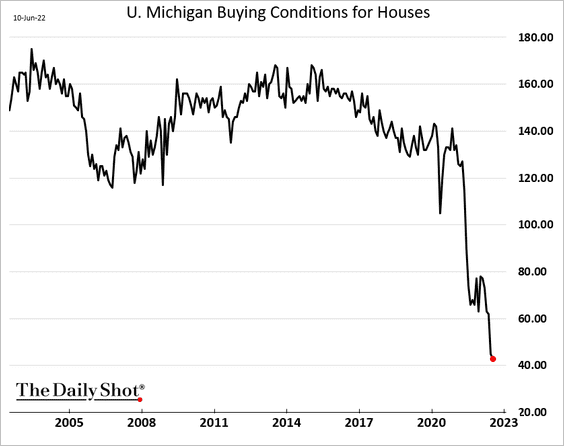
• The U. Michigan buying conditions for homes continue to hit new lows.
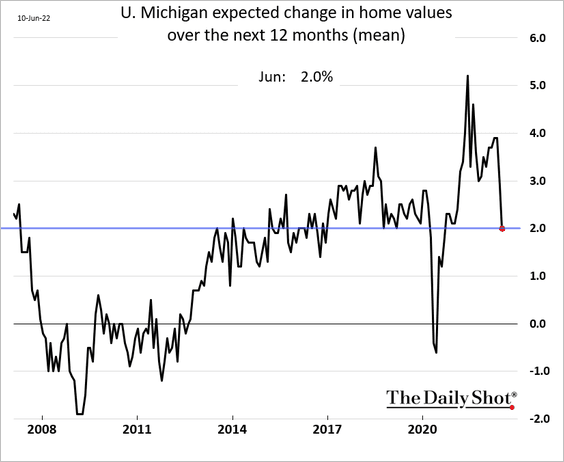
Consumers expect home price appreciation to dip to 2% over the next 12 months.
• Piper Sandler expects housing prices to decline next year.
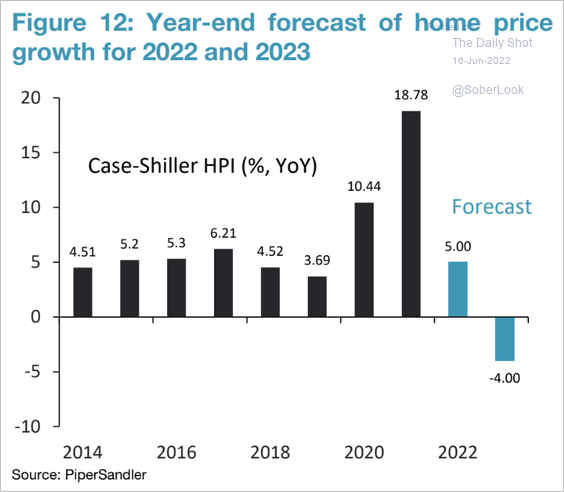 Source: Piper Sandler
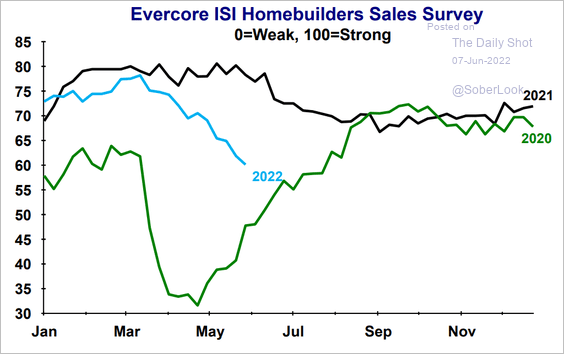
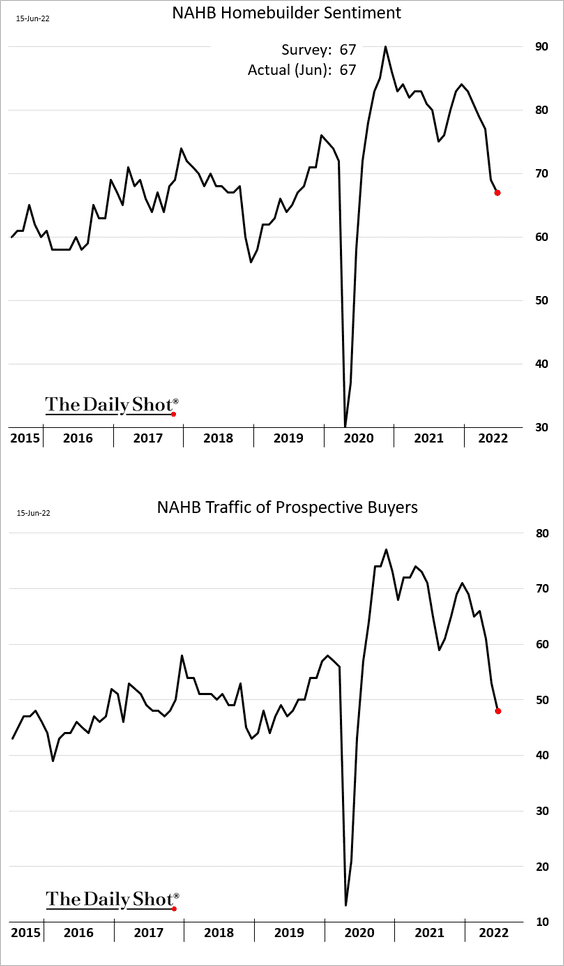
• Homebuilder sentiment continues to deteriorate.
Back to Index
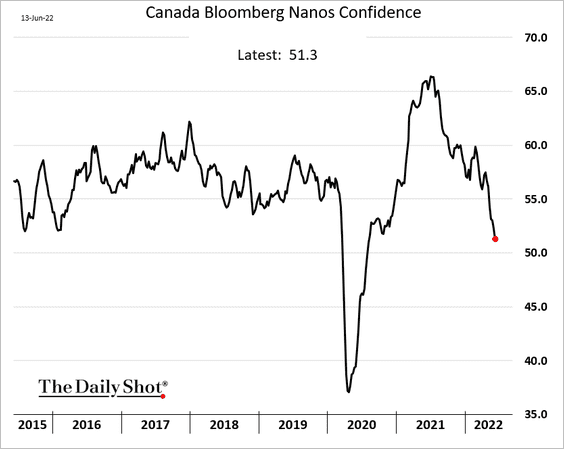
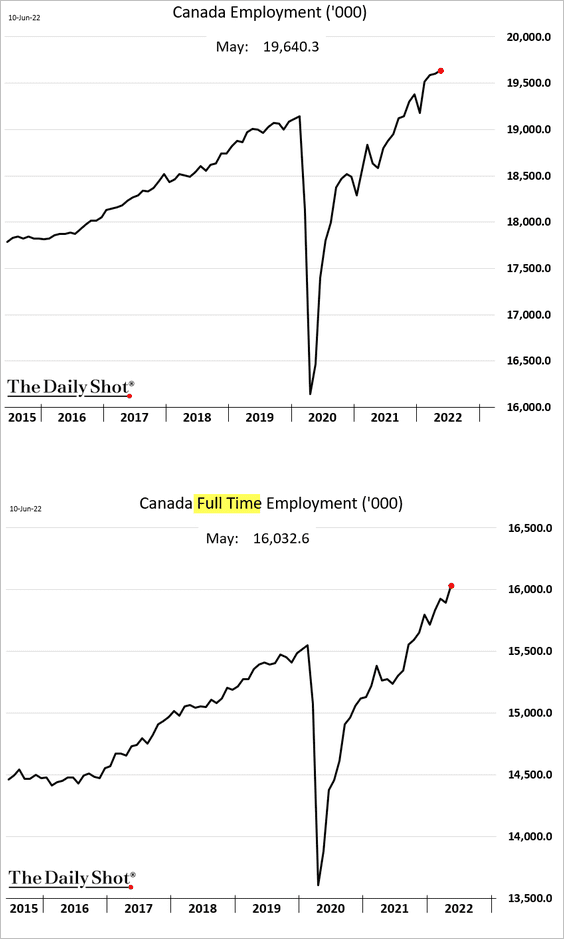
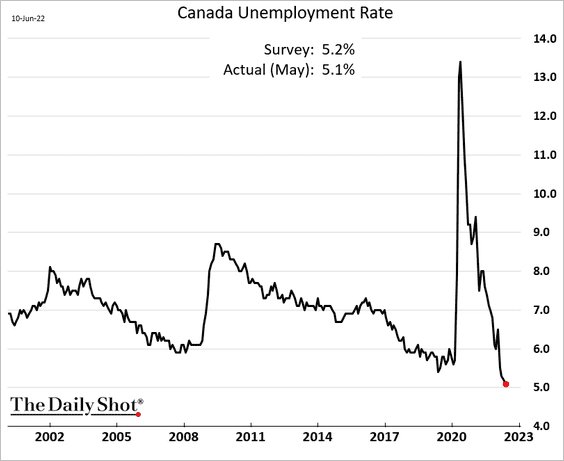
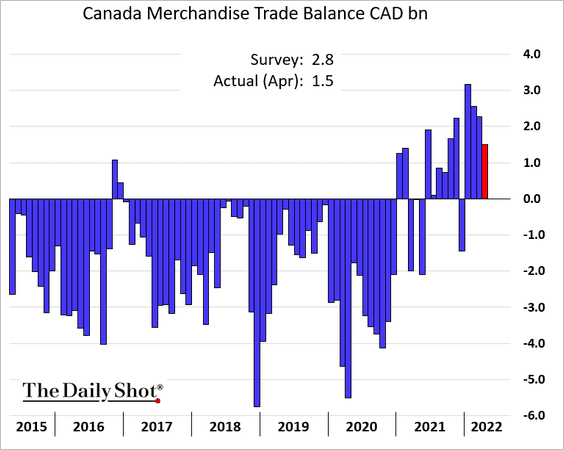
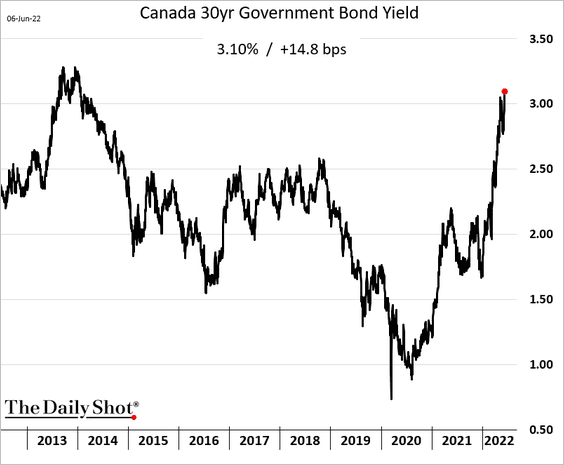
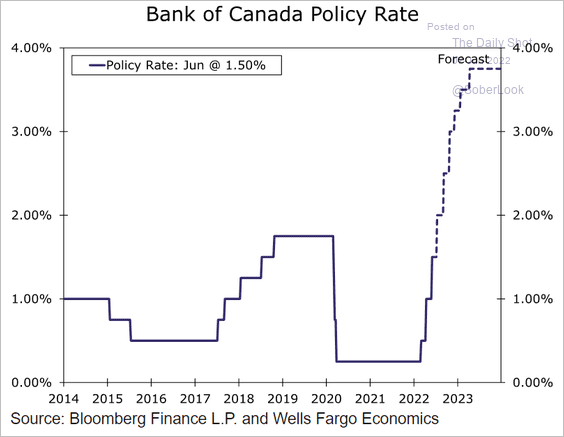
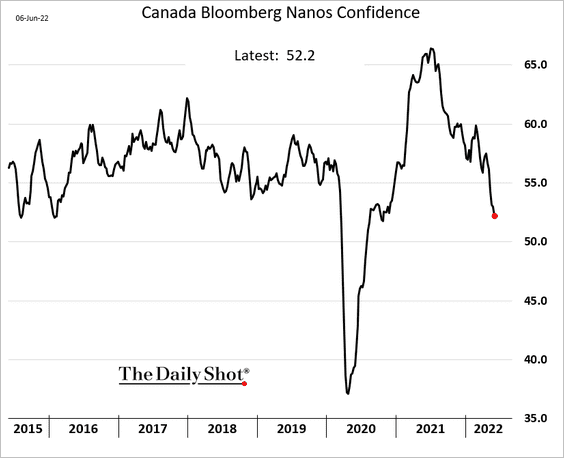
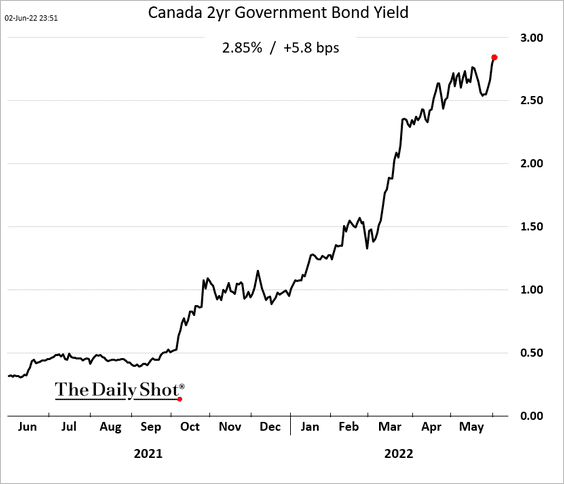
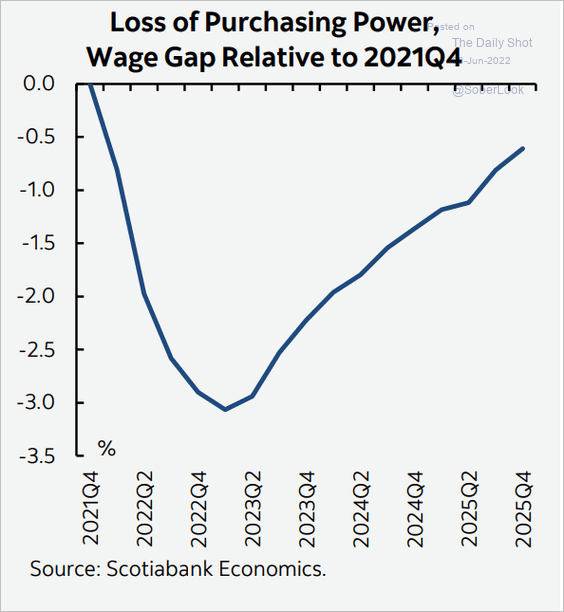
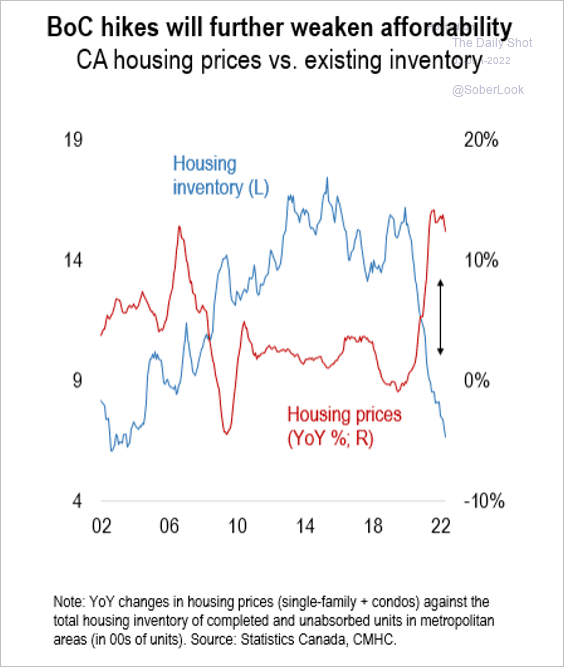
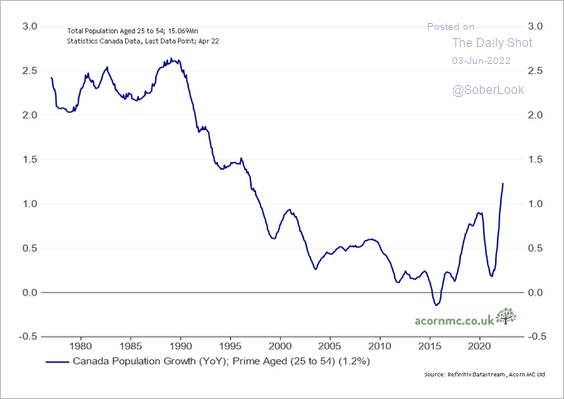
Canada
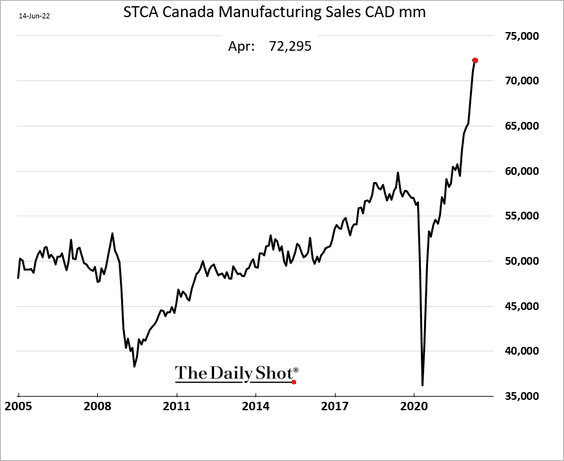
1. Manufacturing sales continue to climb, driven by both prices and volume.
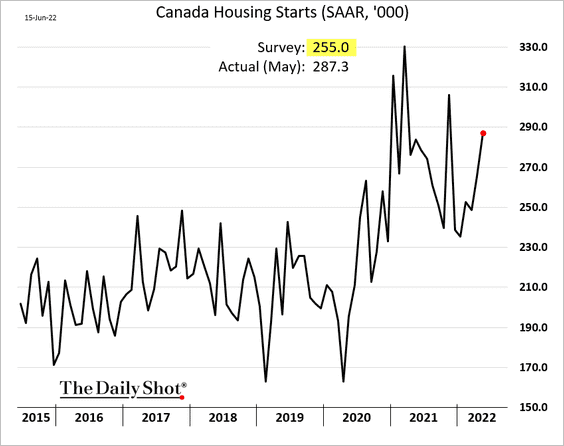
2. Housing starts surprised to the upside.
3. The COVID-era spike in mortgage debt has been massive.
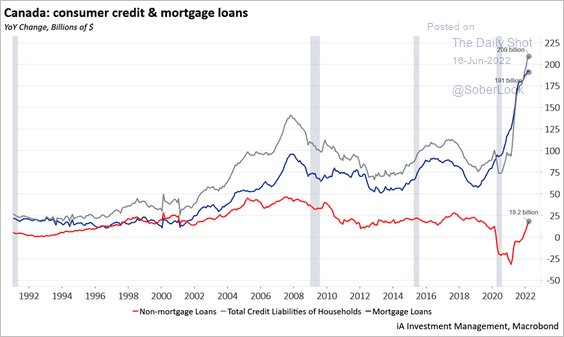 Source: Industrial Alliance Investment Management
But consumer insolvencies have been relatively low.
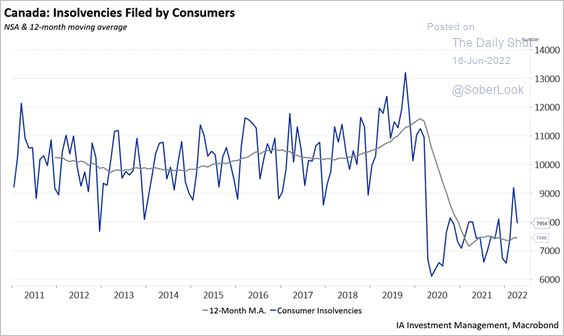 Source: Industrial Alliance Investment Management
Back to Index
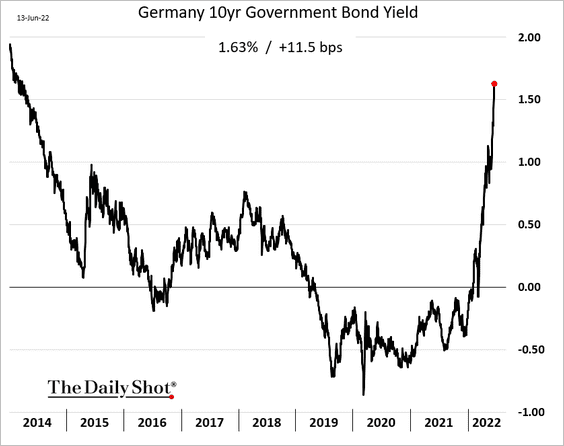
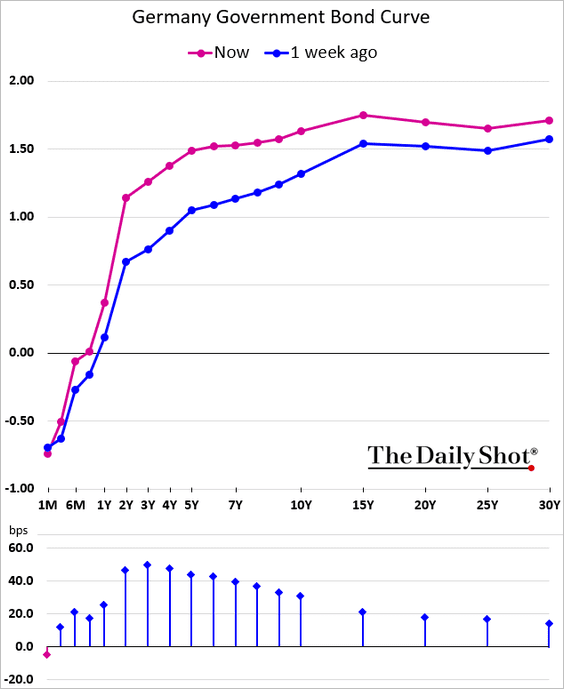
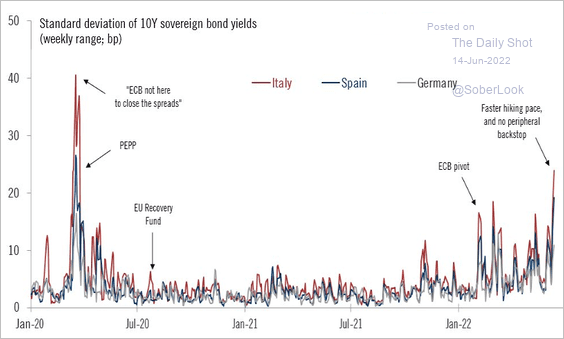
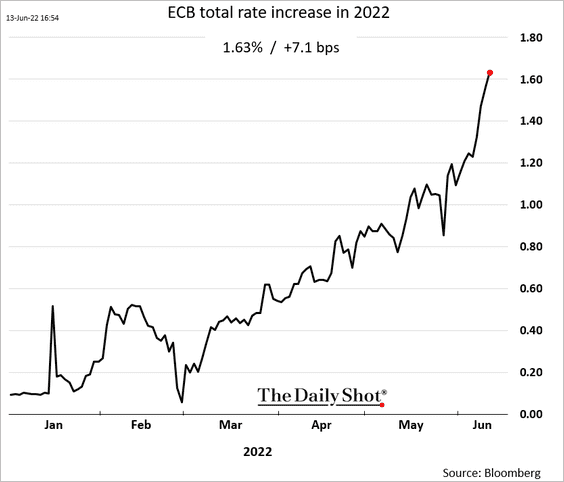
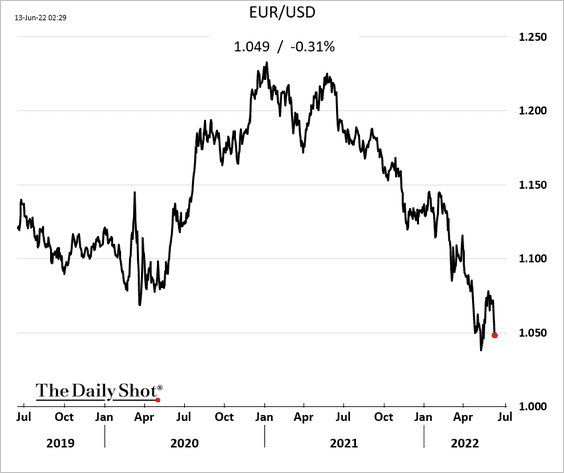
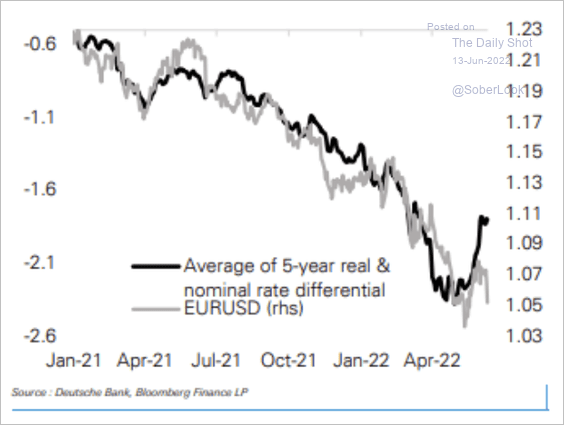
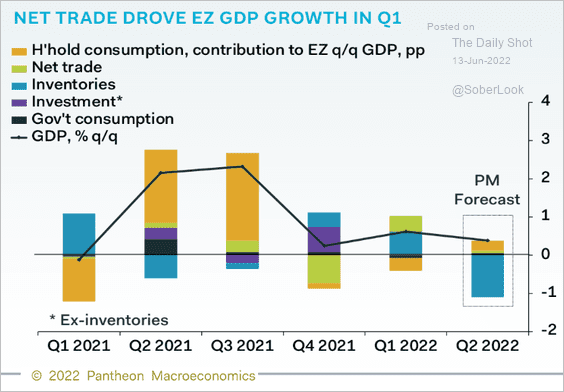
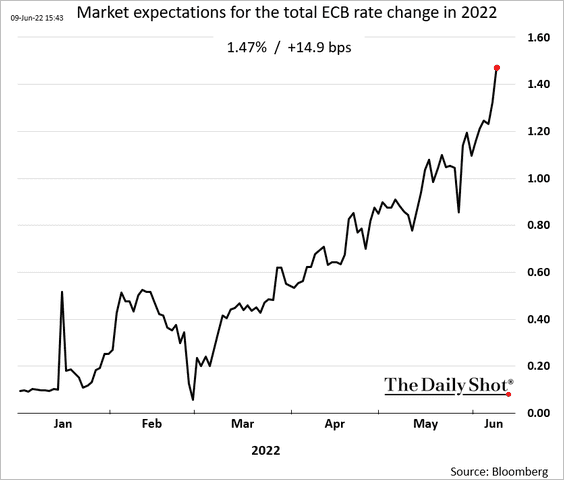
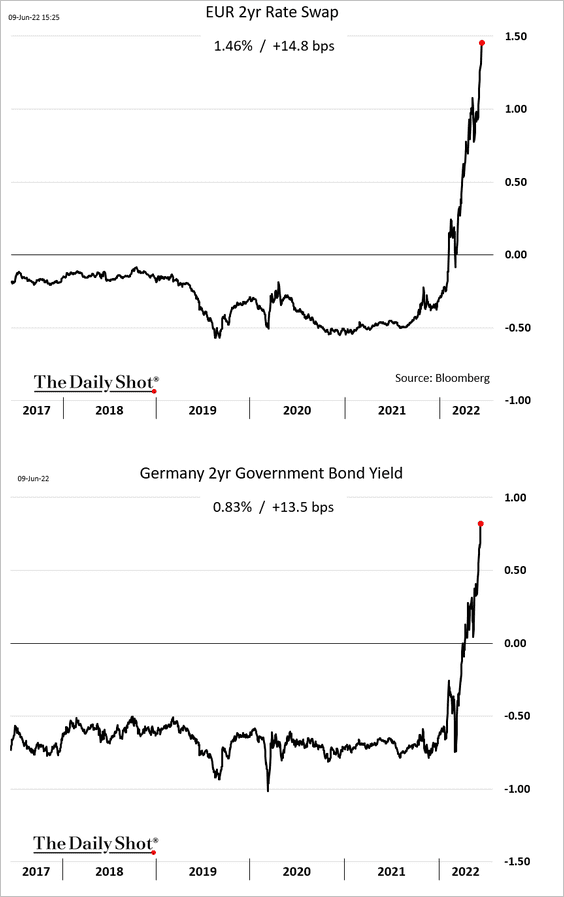
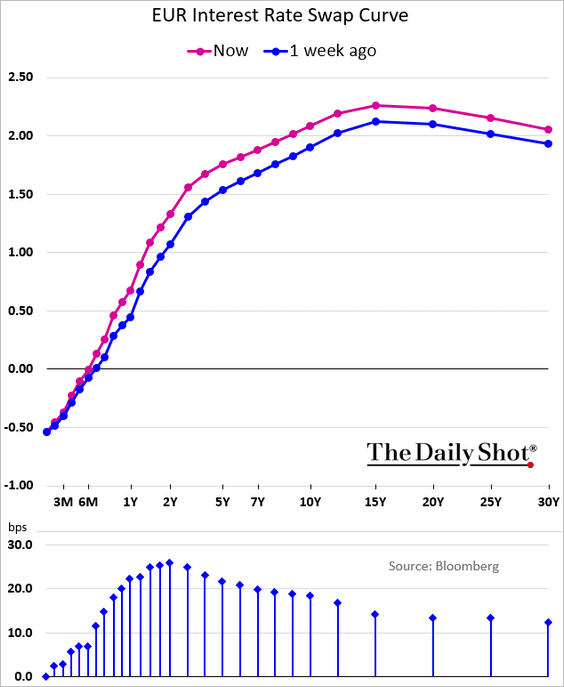
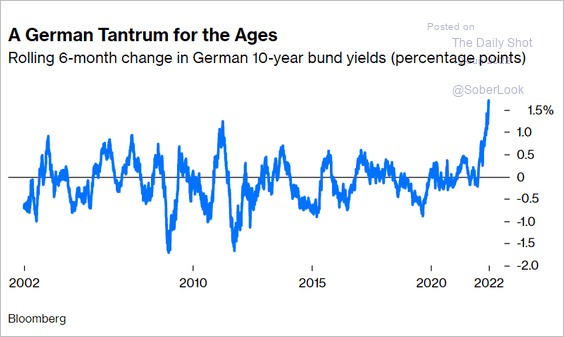
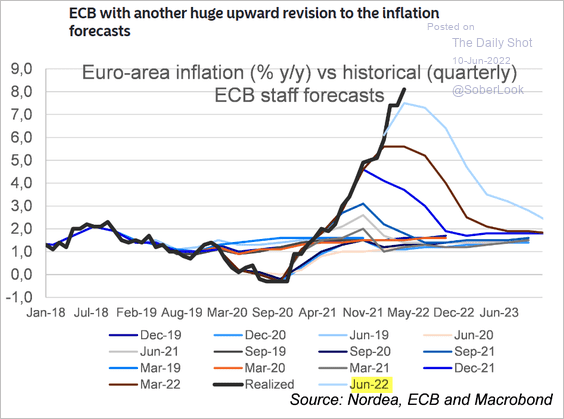
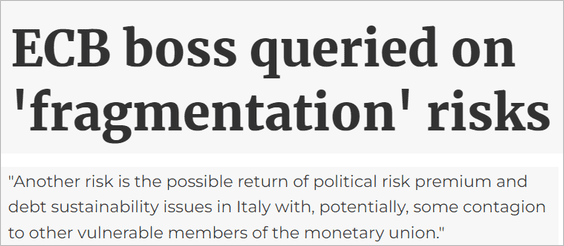
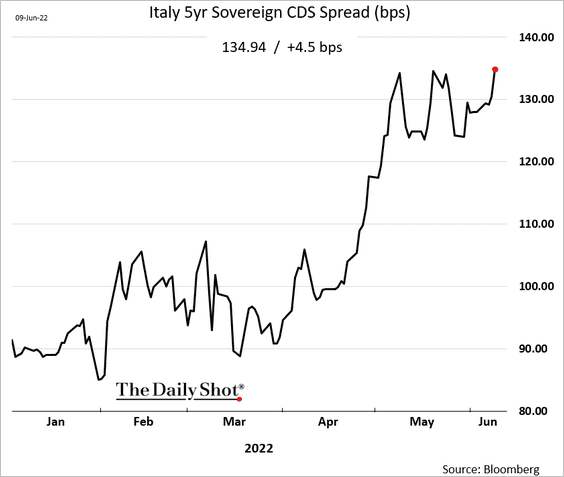
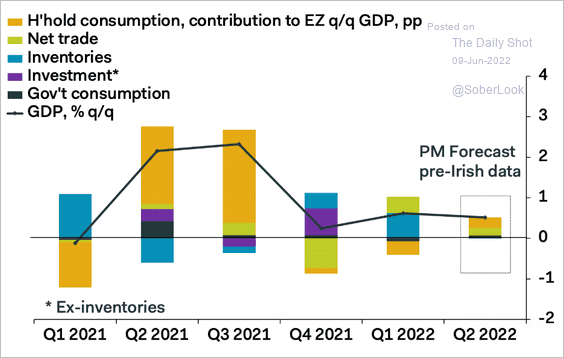
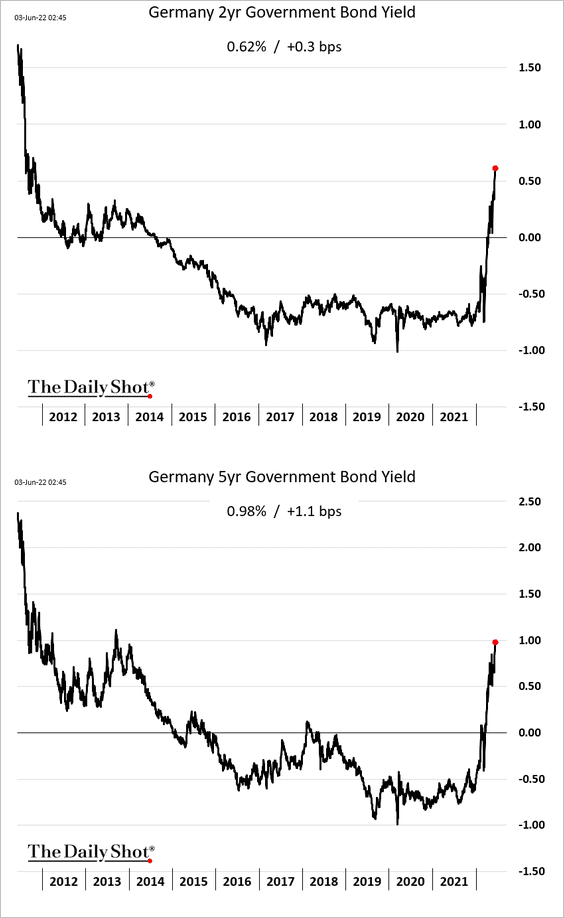
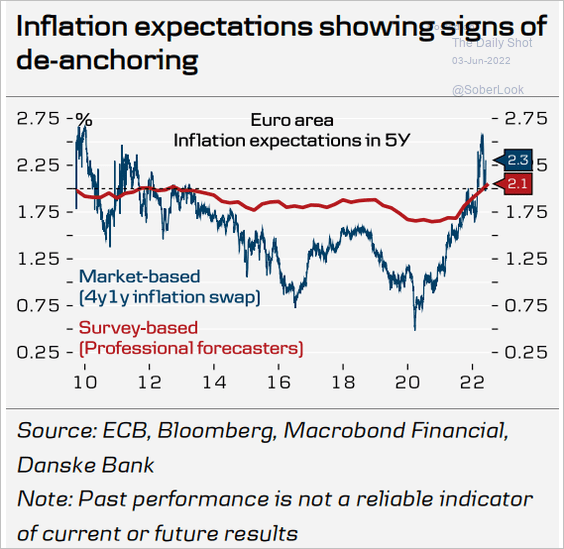
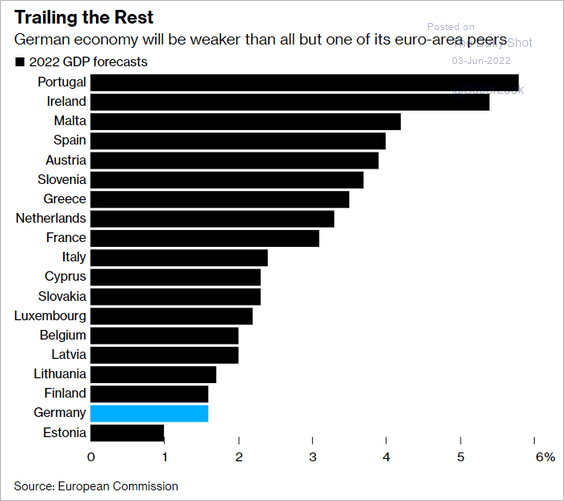
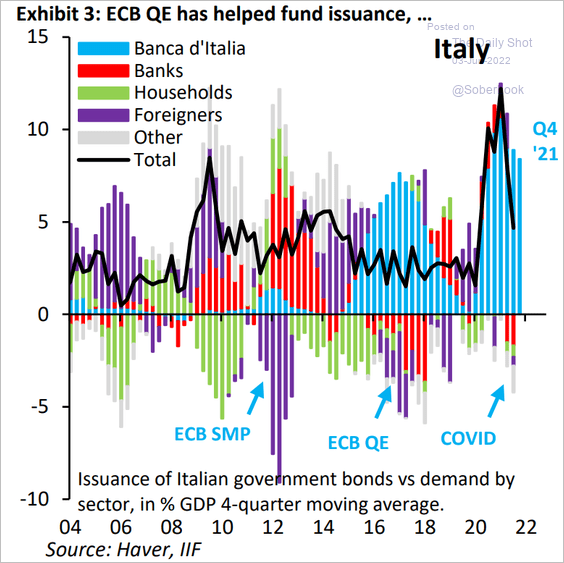
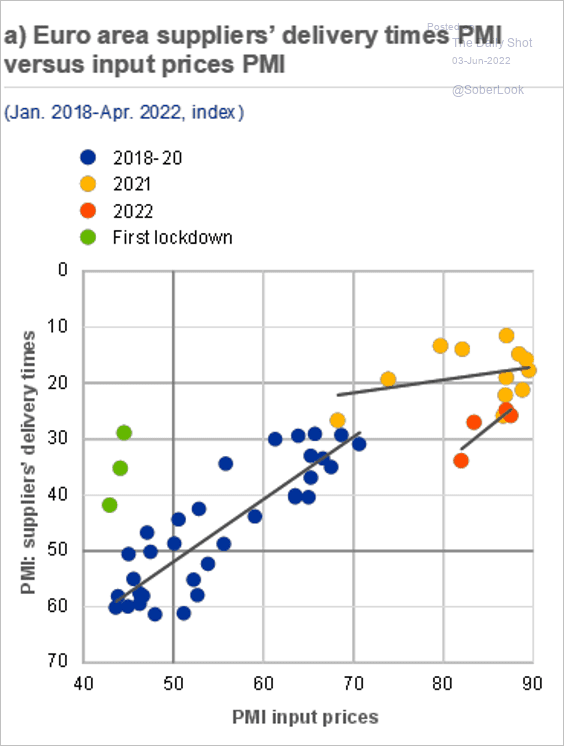
The Eurozone
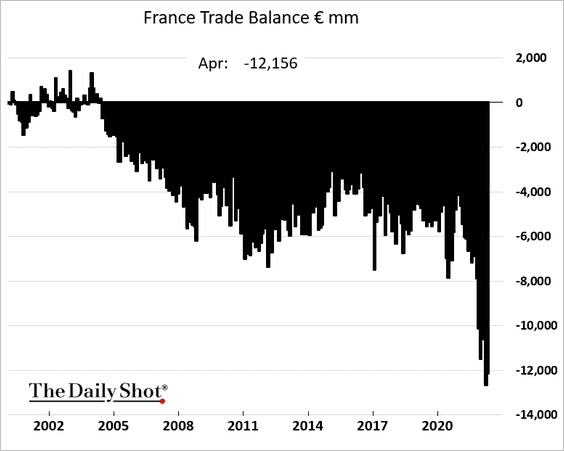
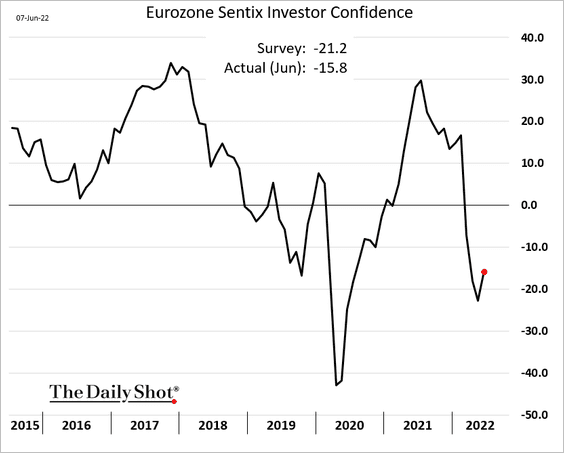
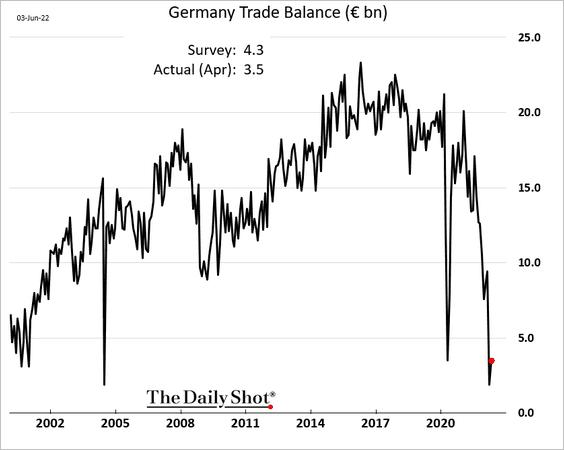
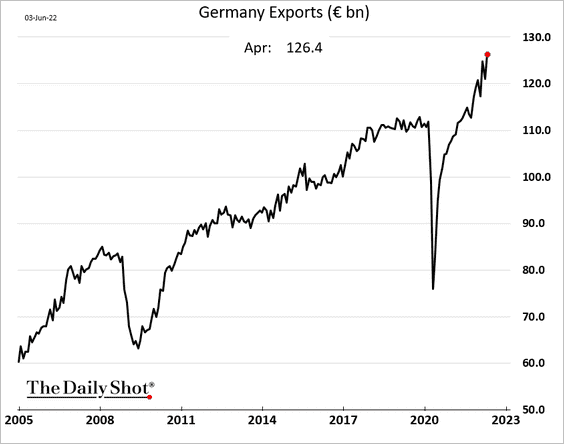
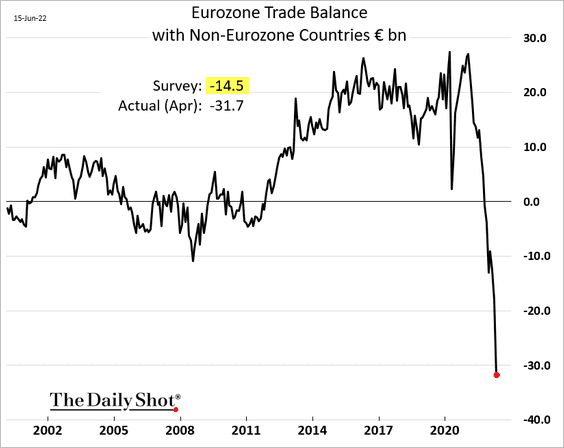
1. The trade deficit was much wider than expected, hitting a new record. This trend is driven by surging energy costs and a bigger deficit with China.
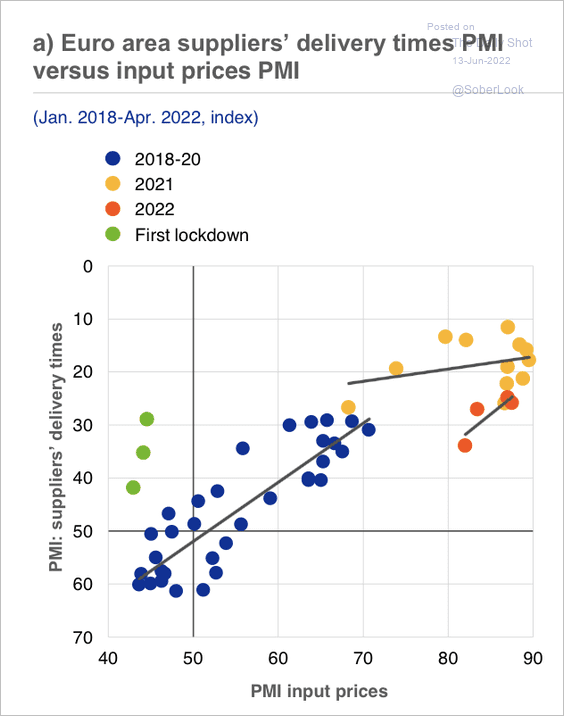
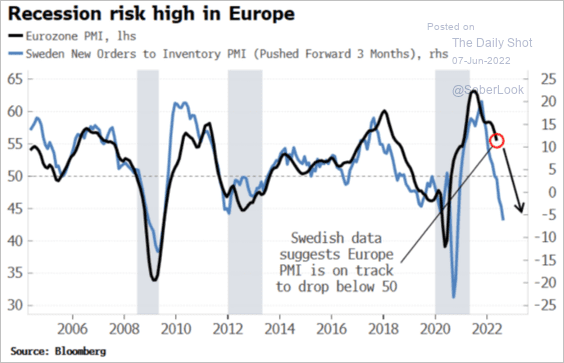
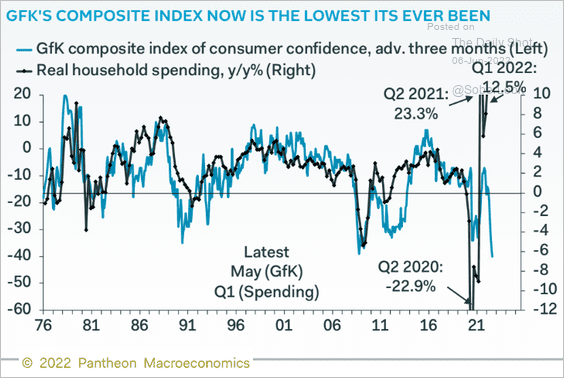
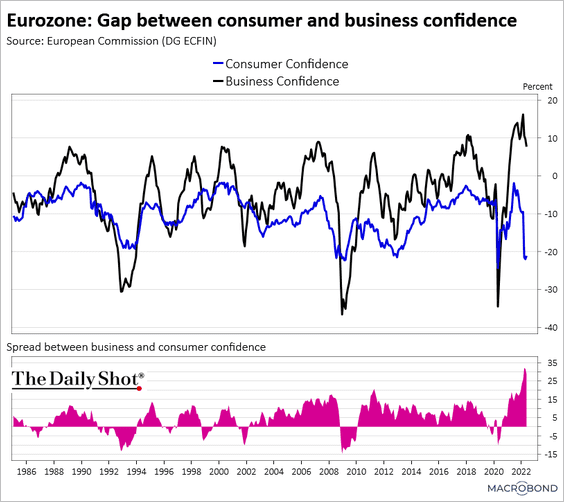
2. Sentiment indicators point to deteriorating business activity ahead.
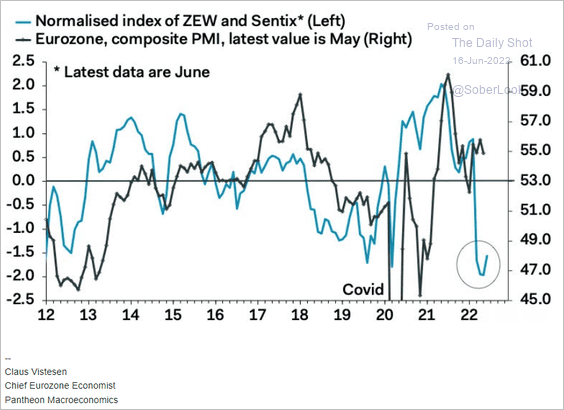 Source: Pantheon Macroeconomics
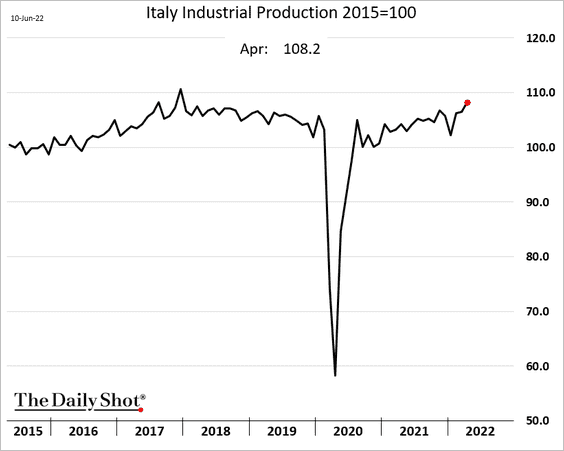
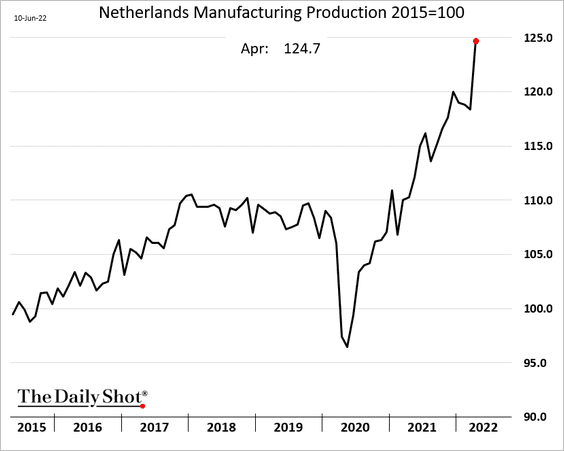
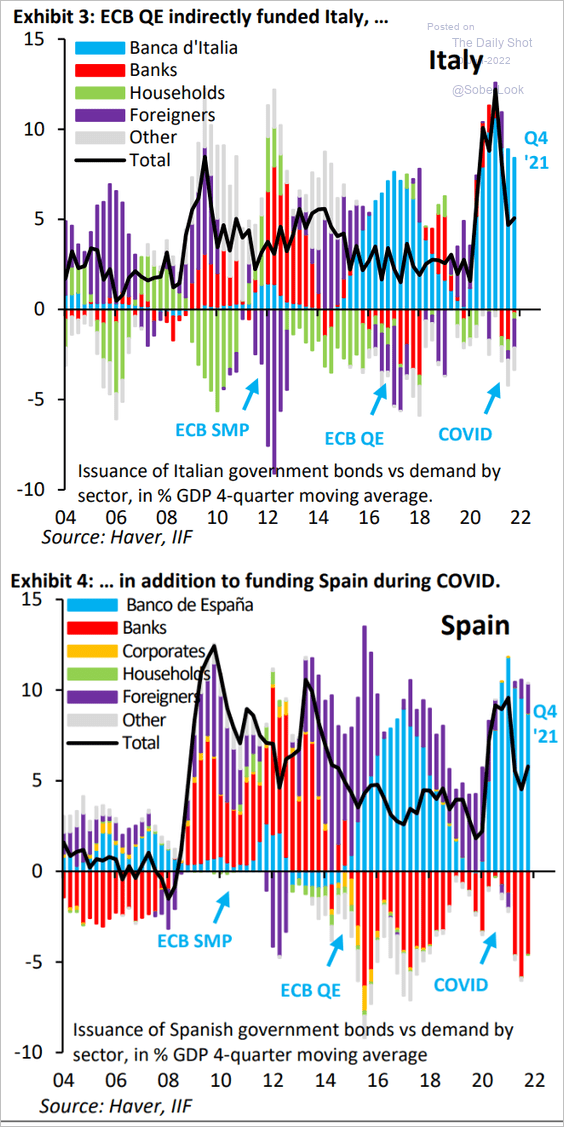
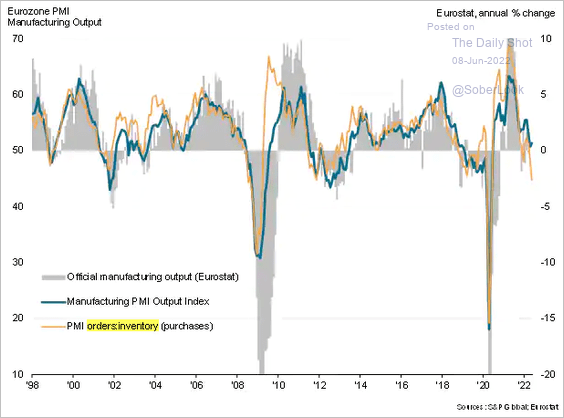
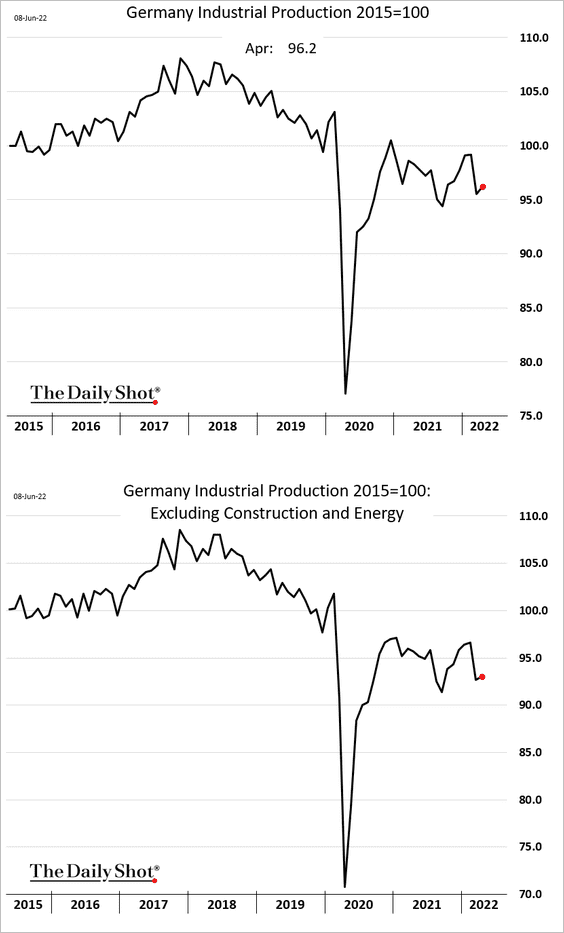
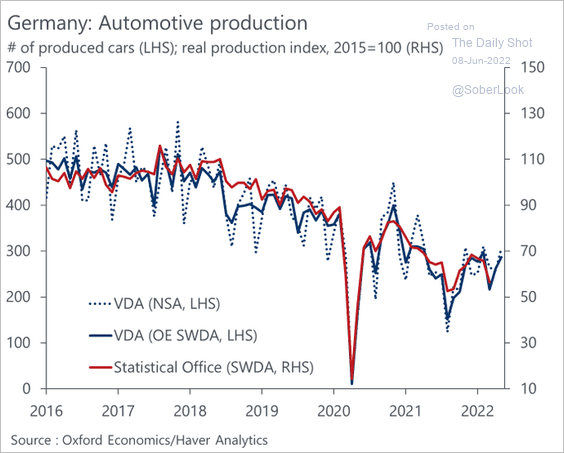
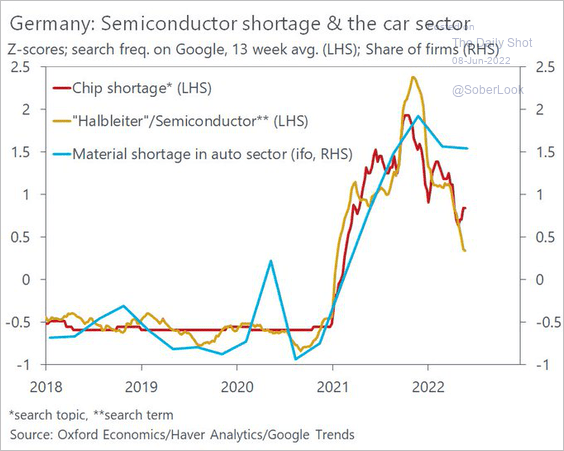
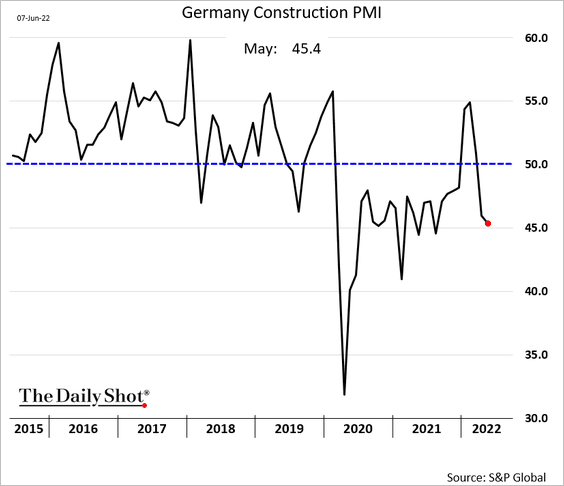
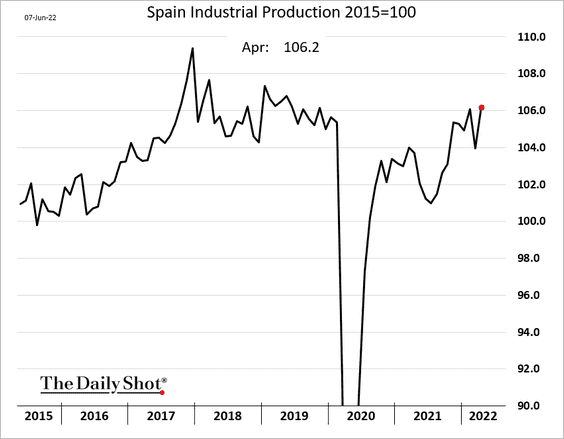
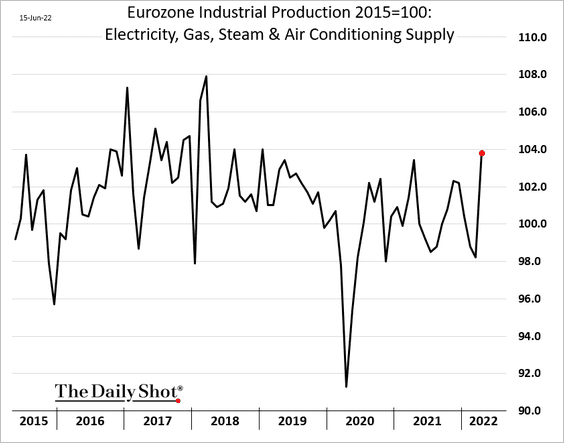
3. Industrial production edged higher in April, but manufacturing output kept declining.
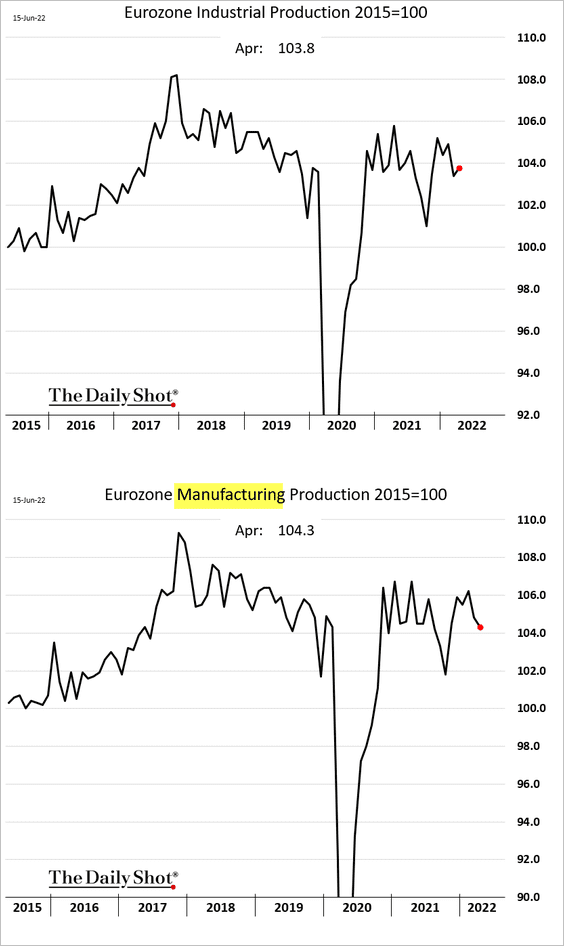
Here is the reason for the above divergence.
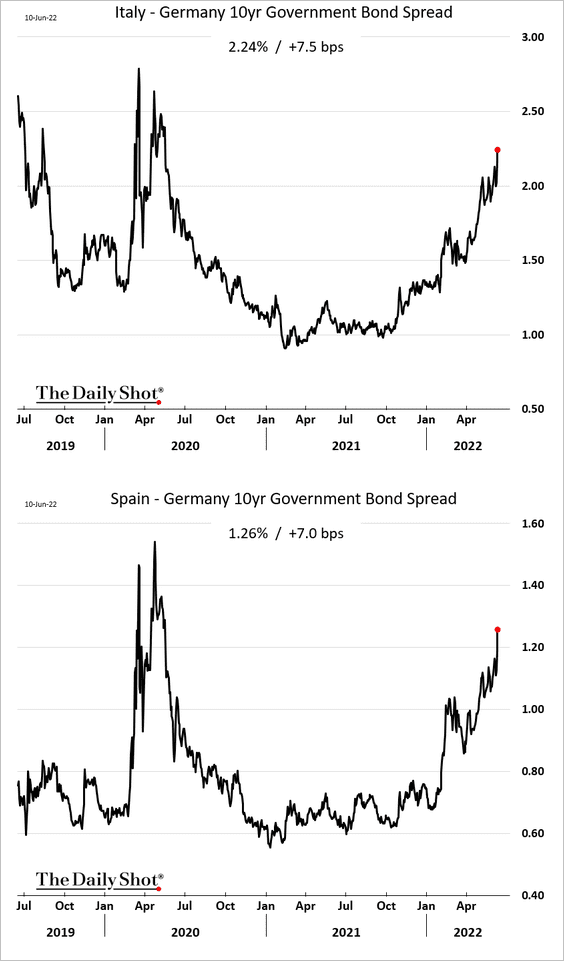
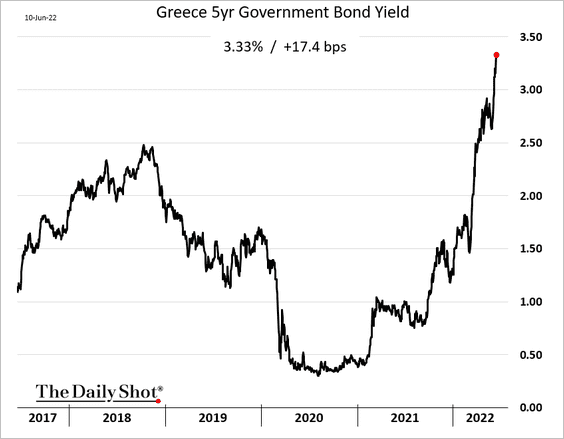
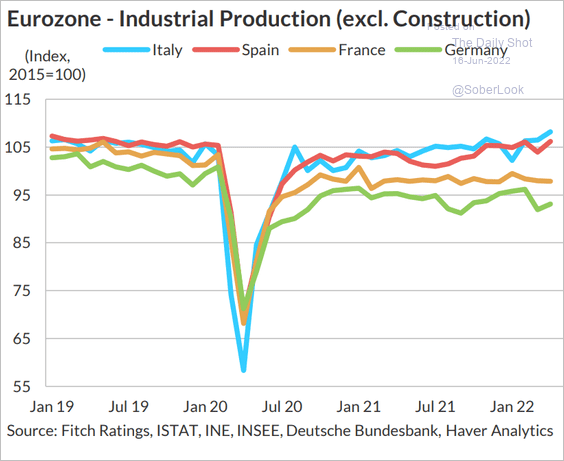
Despite all the headwinds, Italian and Spanish industrial output has been resilient.
 Source: Fitch Ratings
Back to Index
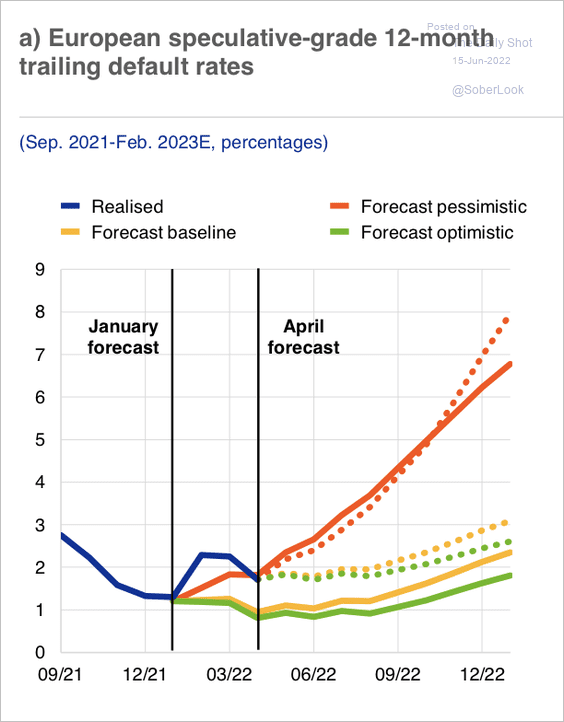
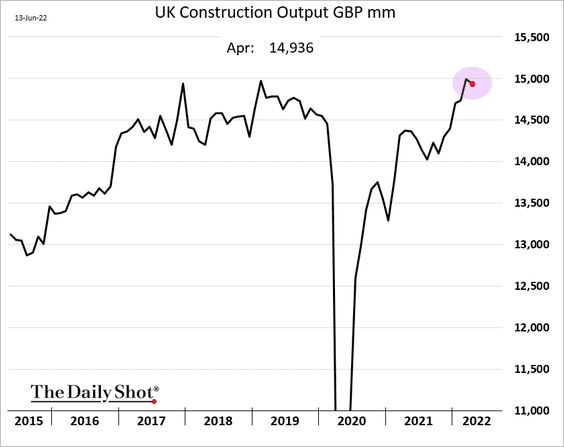
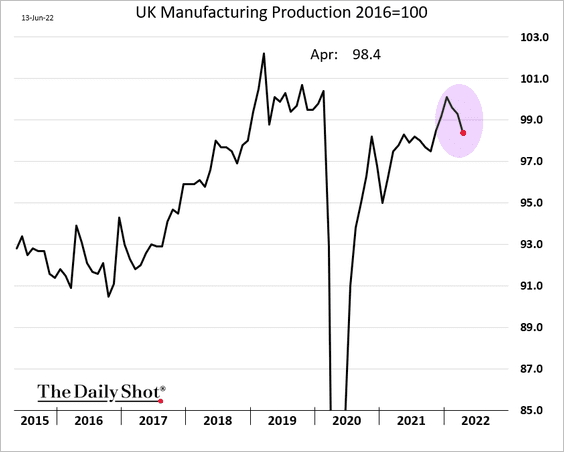
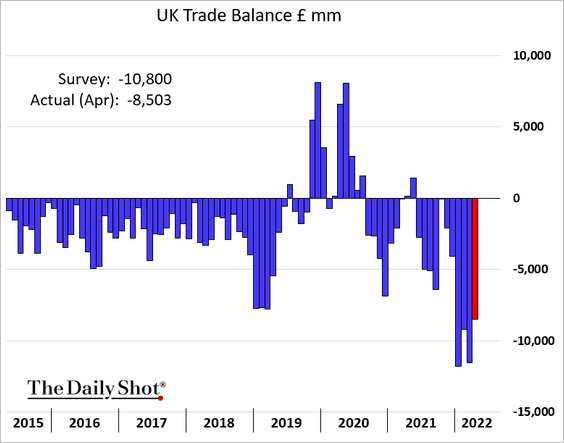
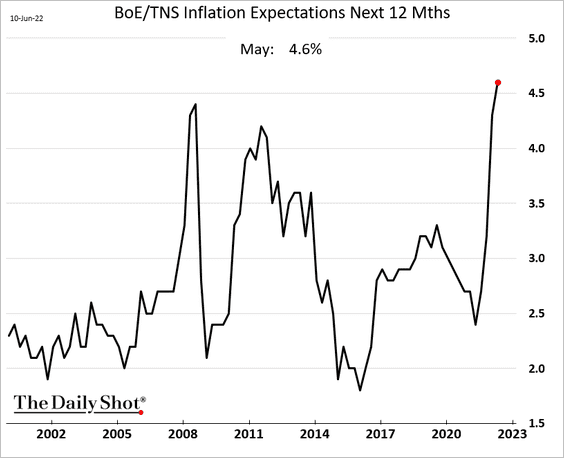
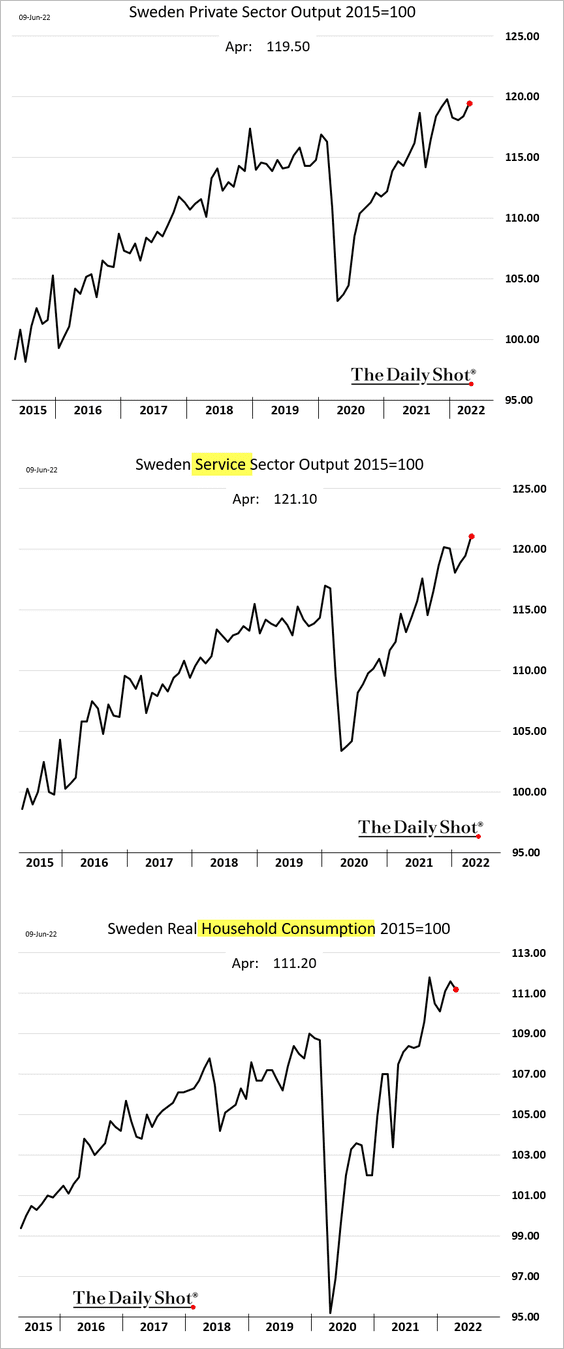
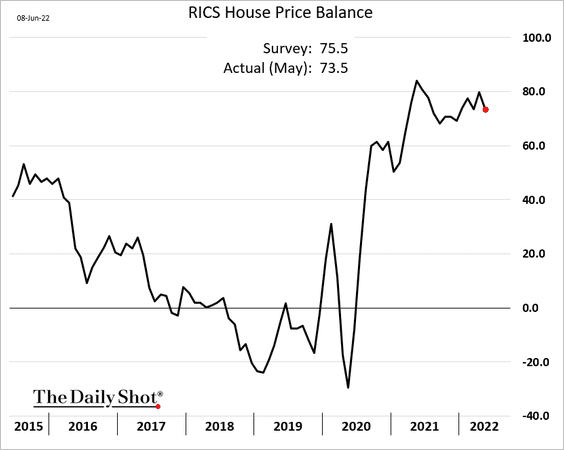
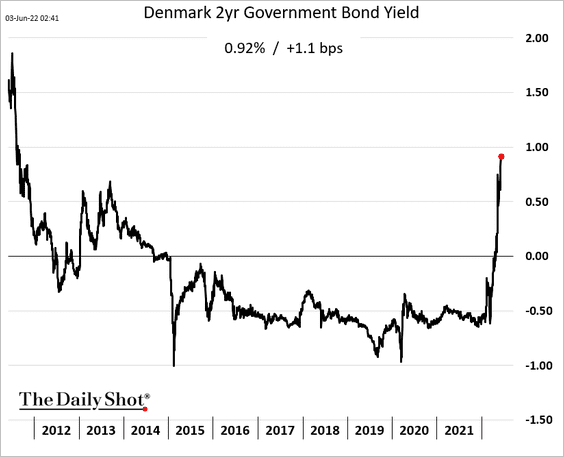
Europe
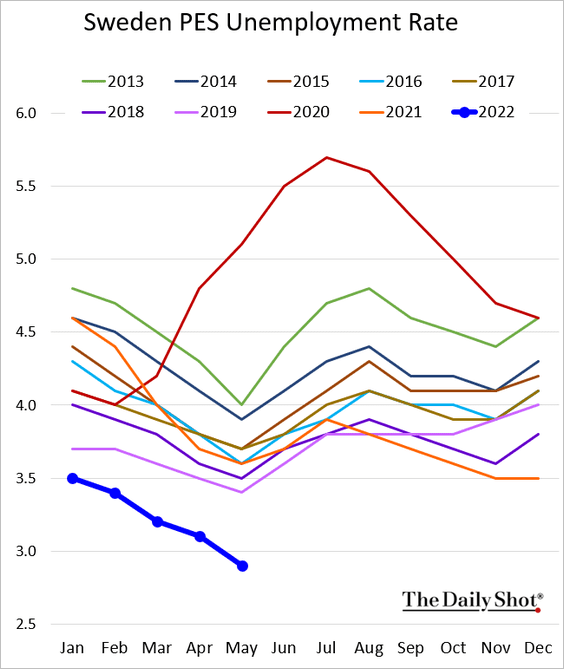
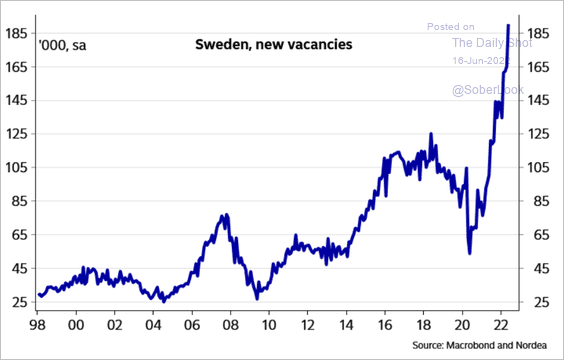
1. Sweden’s job vacancies have been surging.
 Source: Nordea Markets
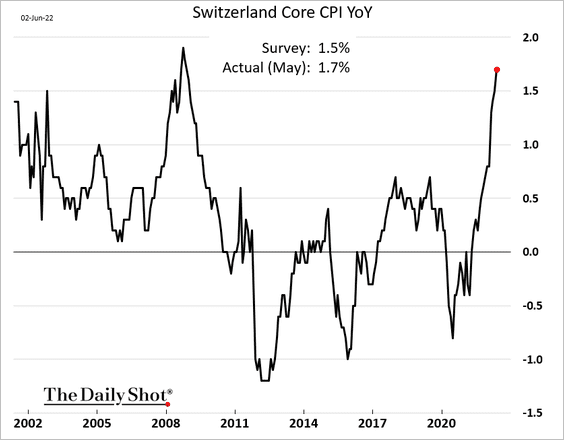
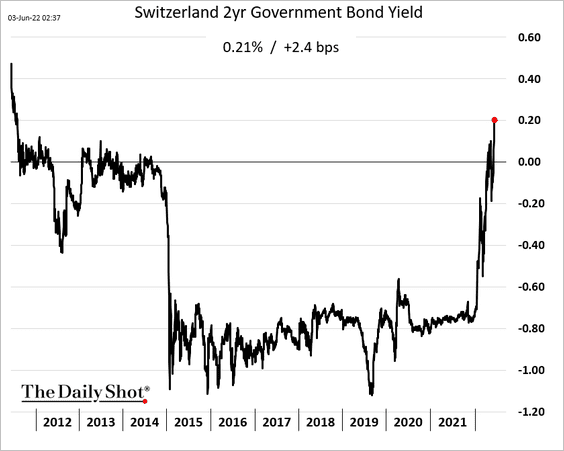
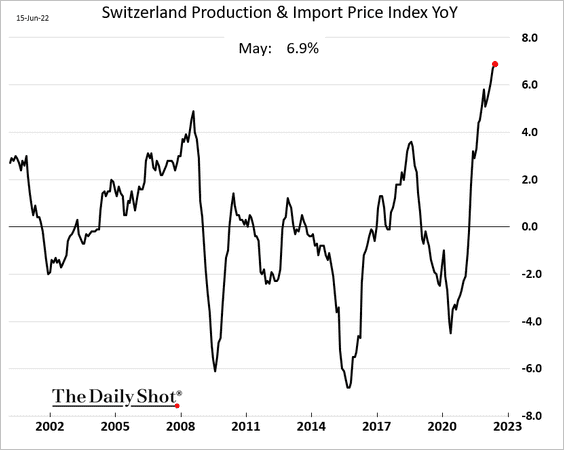
2. Upstream price gains in Switzerland reached a multi-decade high.
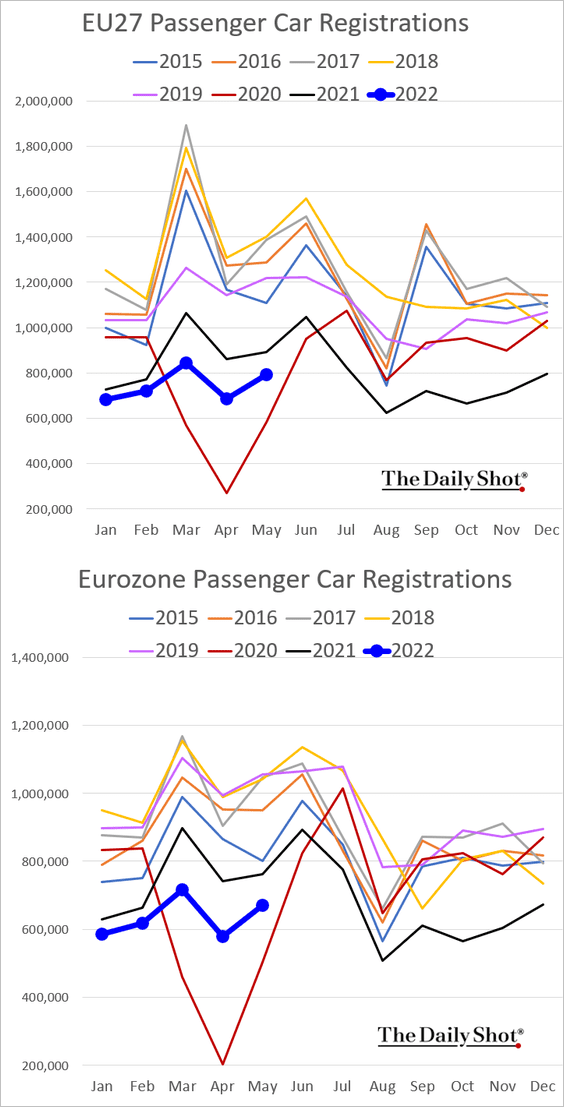
3. EU car registrations were a bit firmer in May.
Back to Index
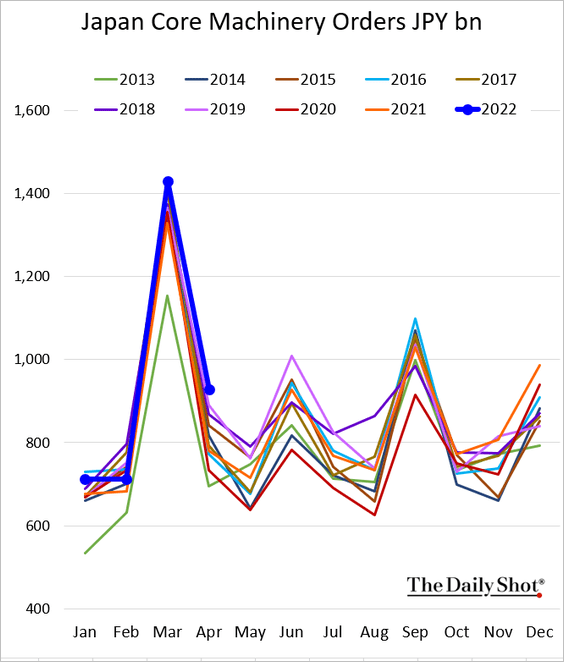
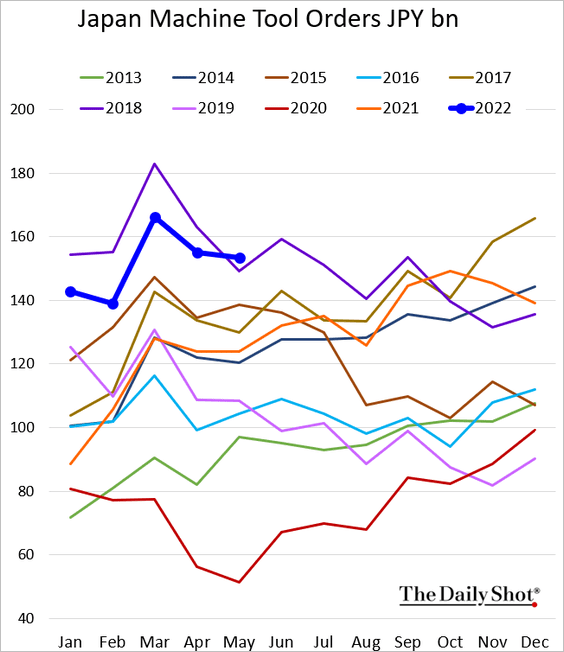
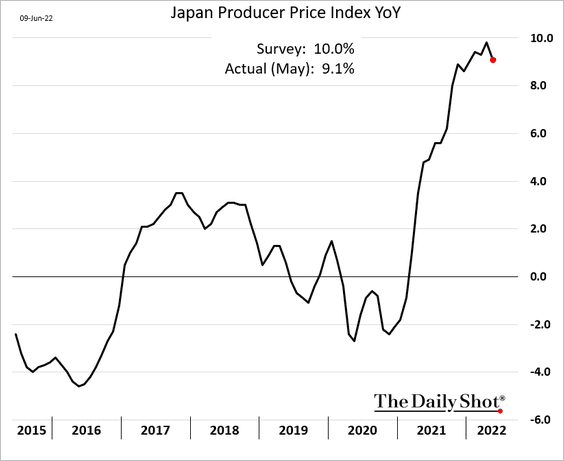
Asia – Pacific
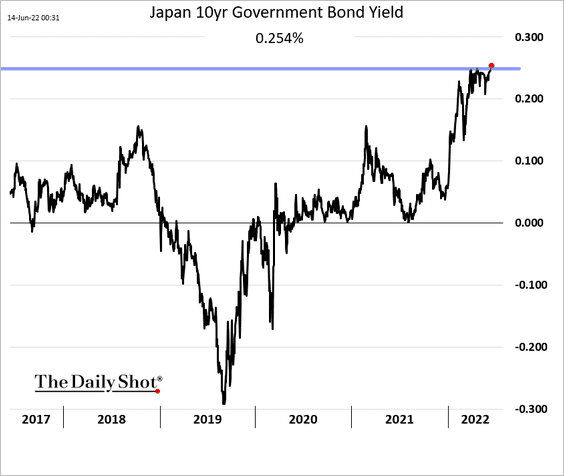
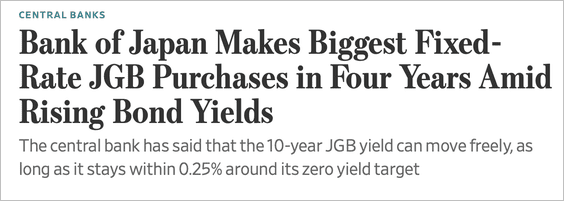
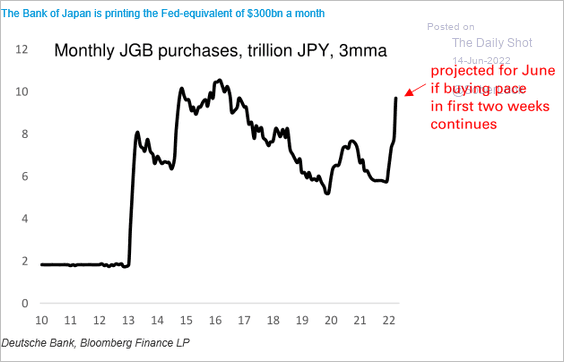
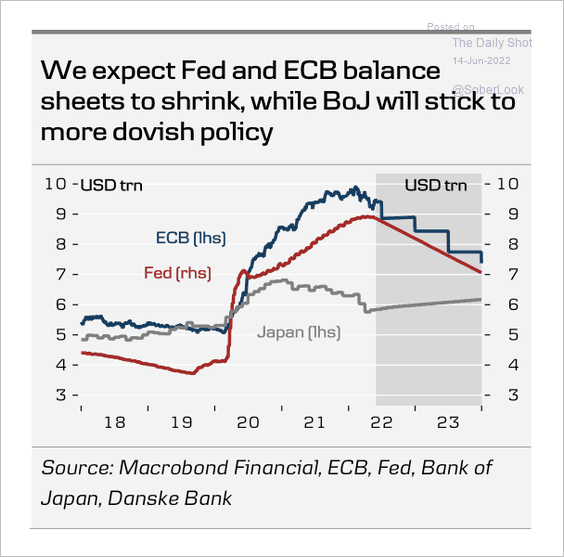
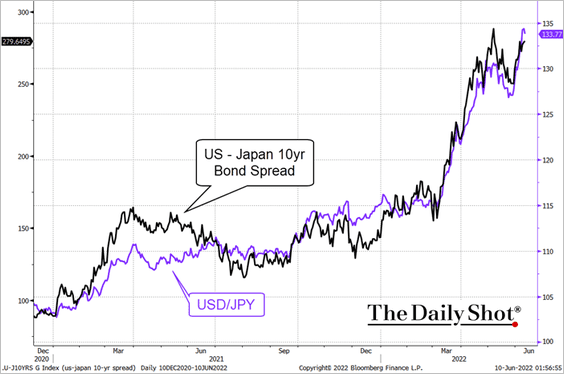
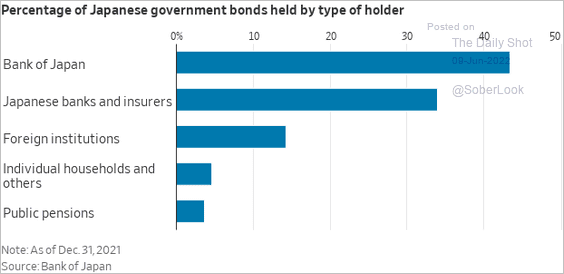
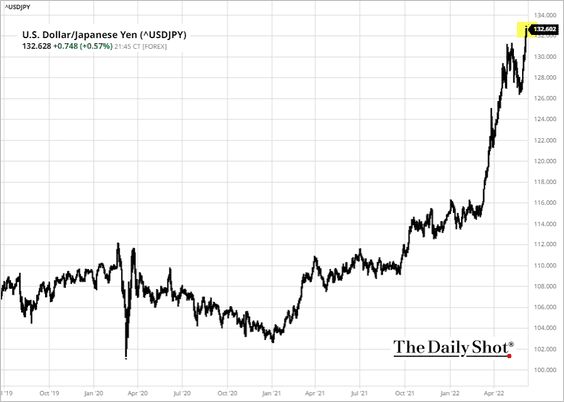
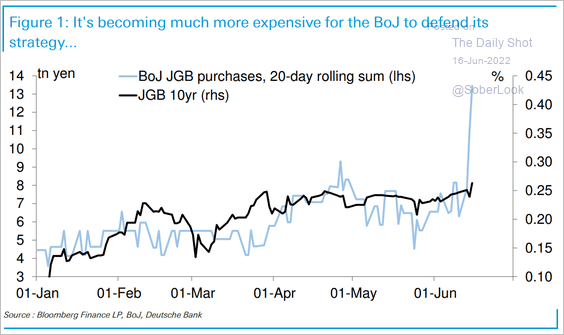
1. The BoJ’s yield targeting program is becoming expensive to defend as yields rise.
 Source: Deutsche Bank Research
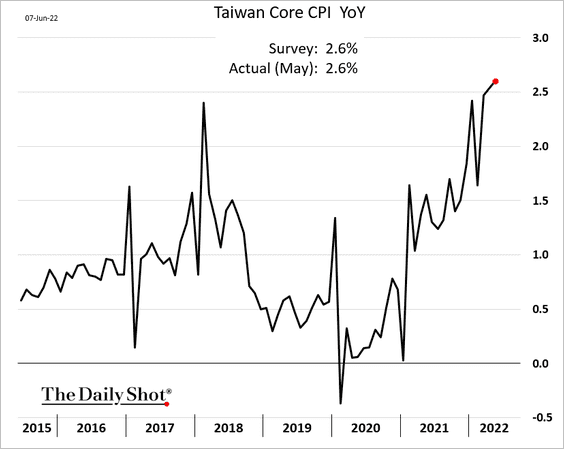
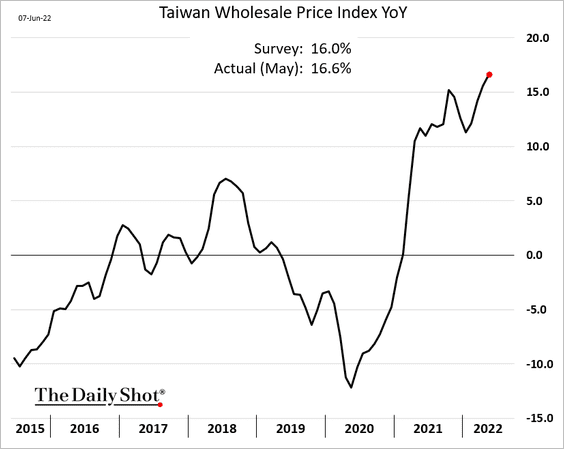
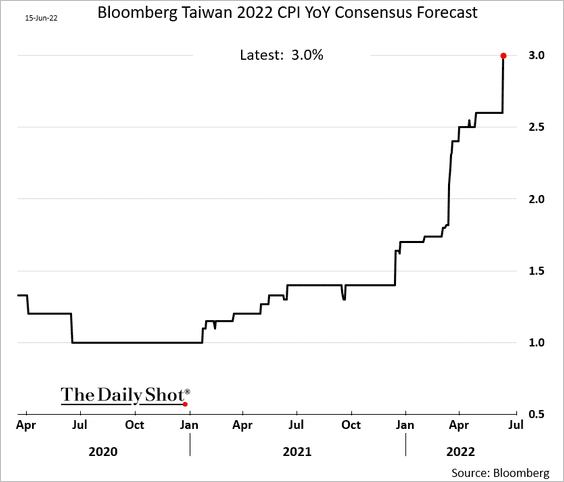
2. Economists expect Taiwan’s CPI to hit 3% for the full year.
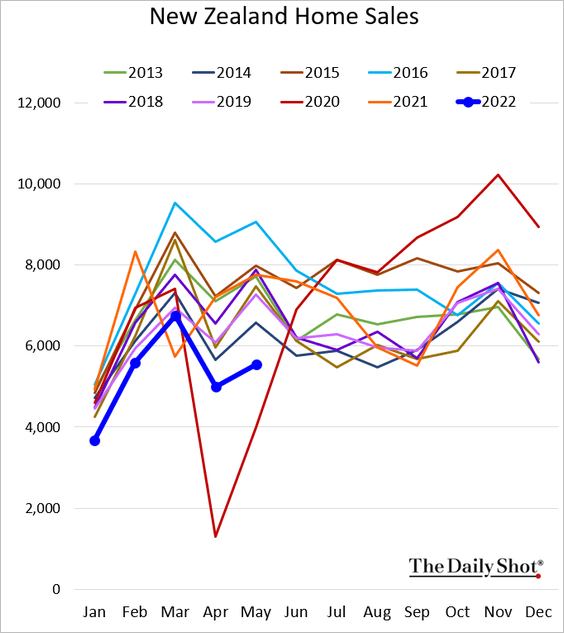
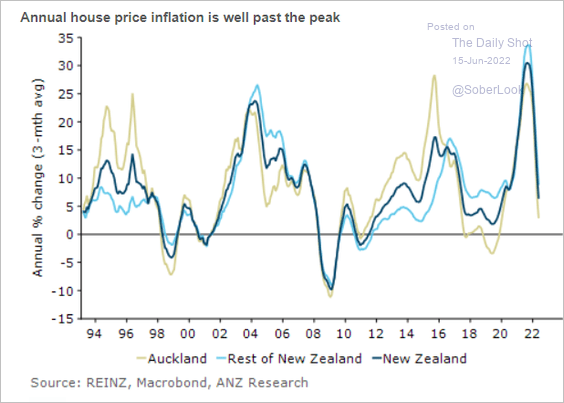
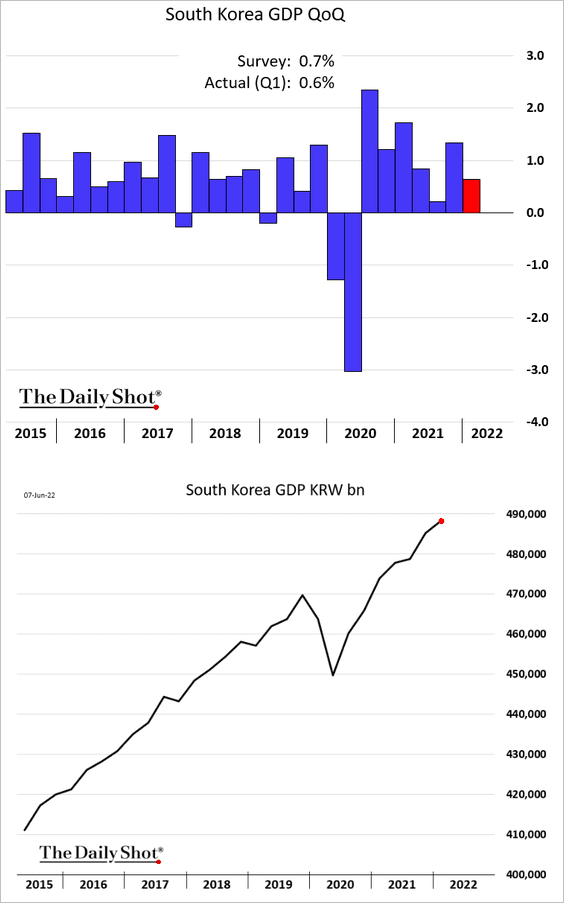
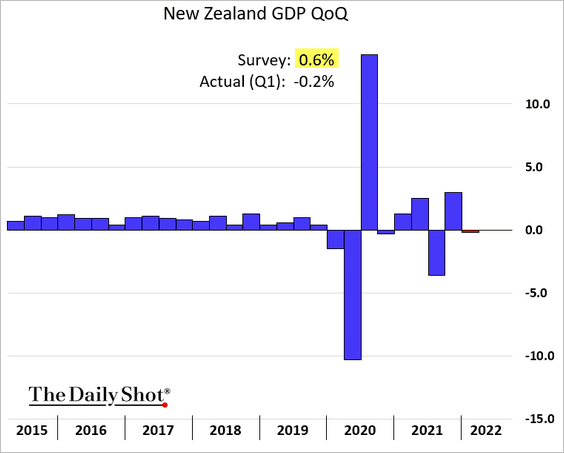
3. New Zealand’s GDP unexpectedly contracted in Q1.
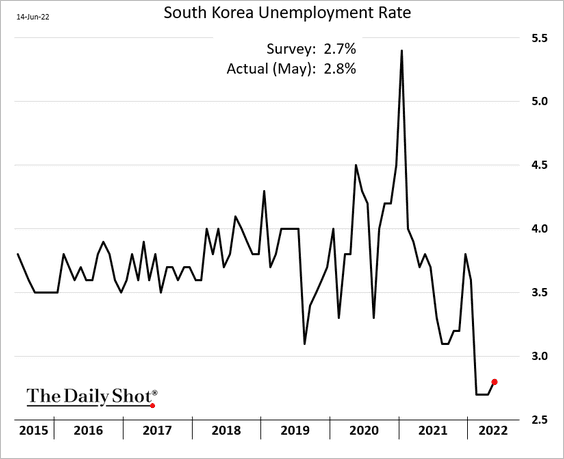
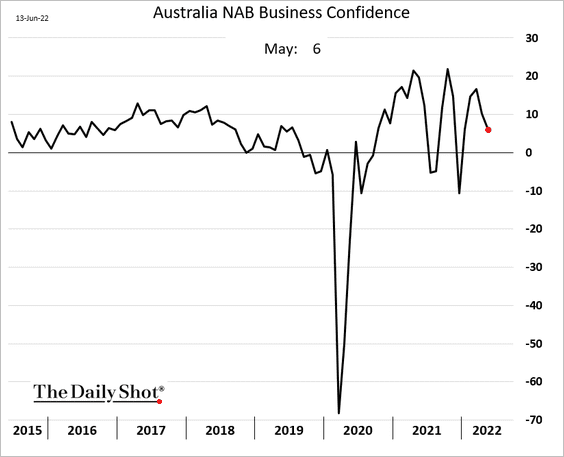
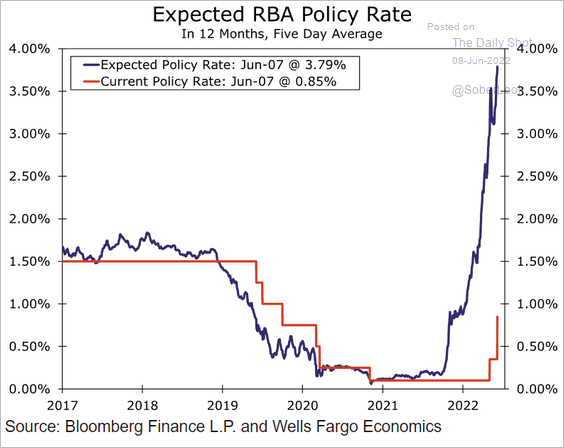
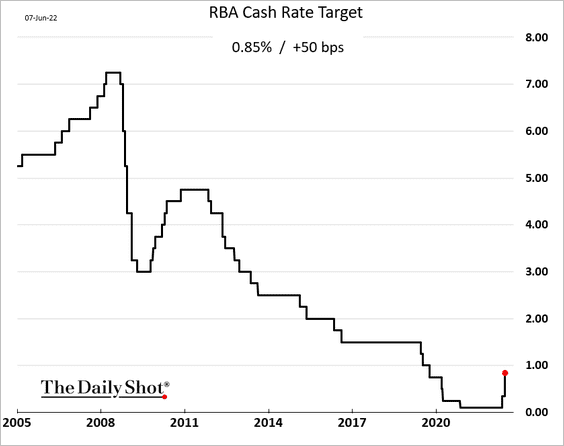
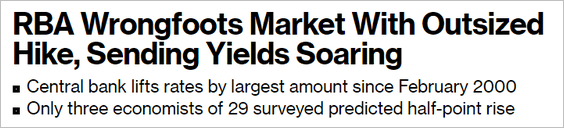
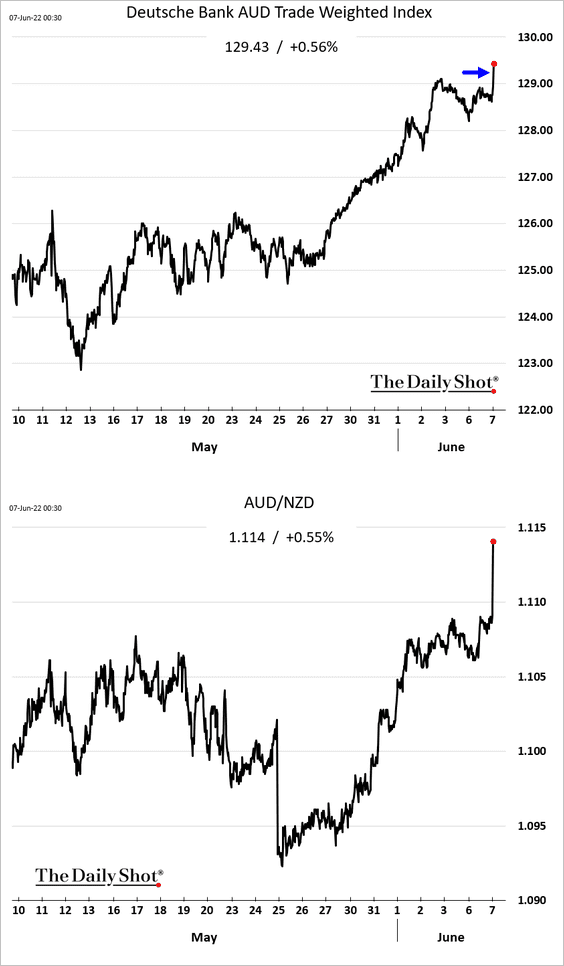
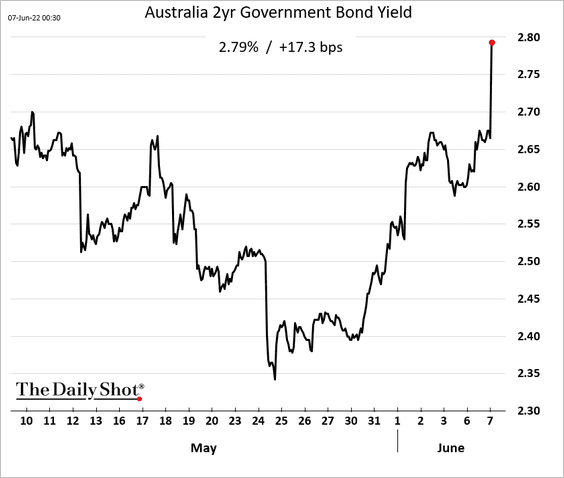
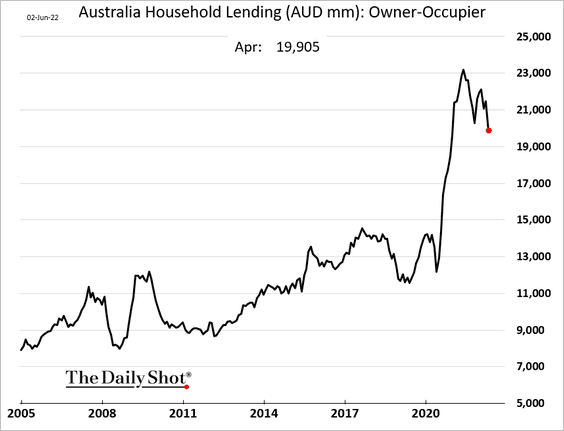
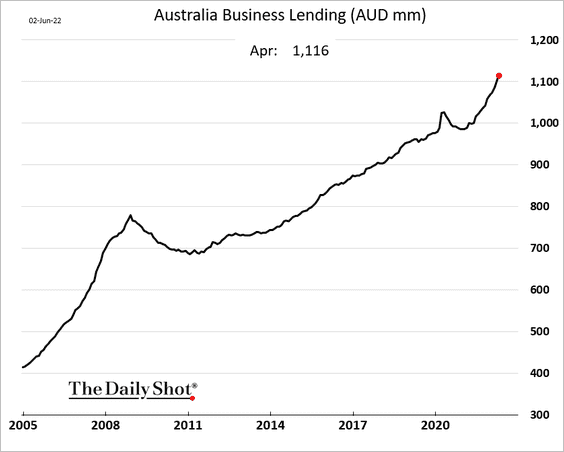
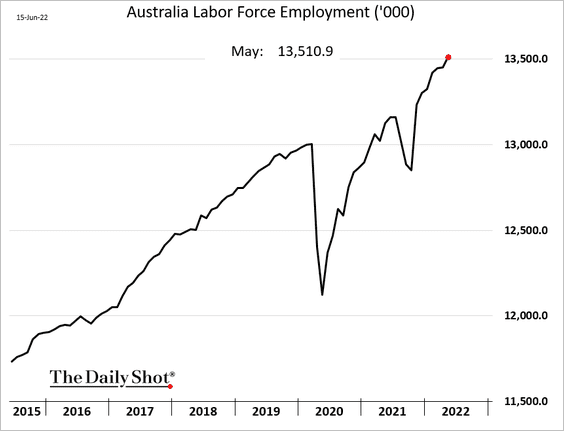
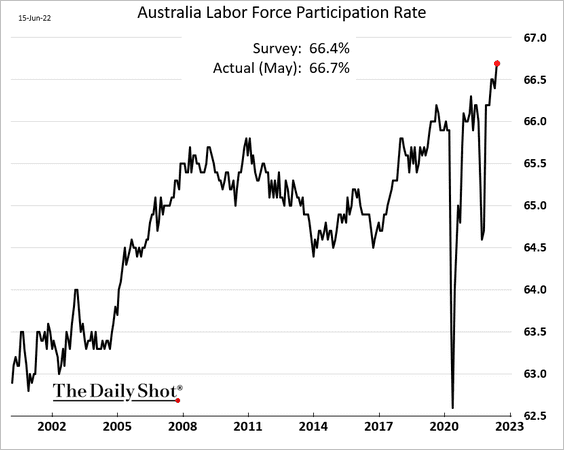
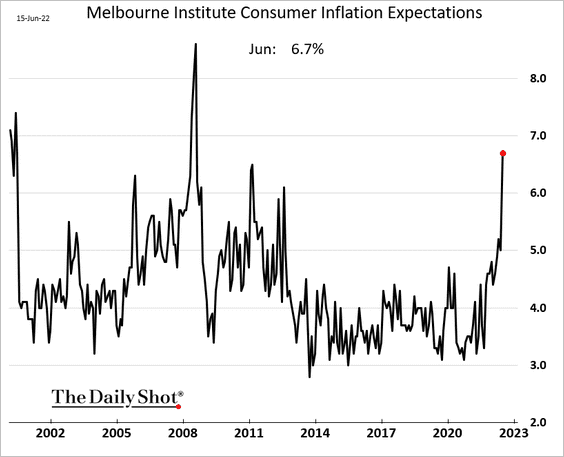
4. Next, we have some updates on Australia.
• The employment report topped expectations.
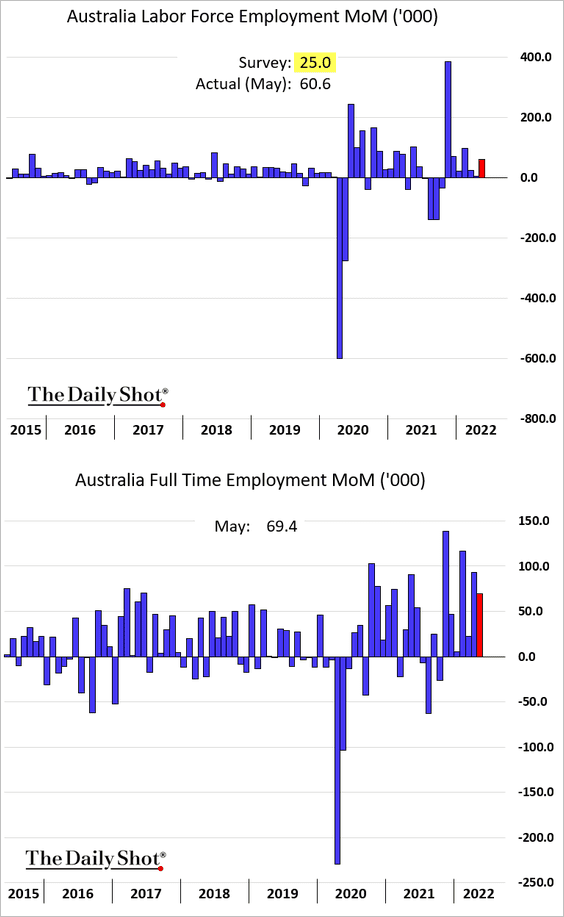
– The total employment trend outperforms most other economies.
– The unemployment rate was a touch higher than expected, but …
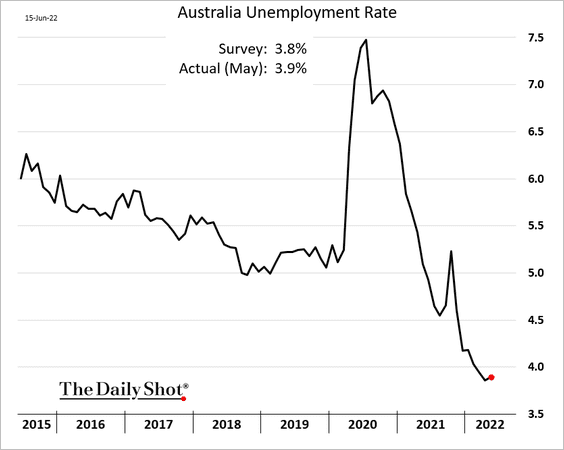
… the labor force participation rate hit a new high (also outperforming most economies).
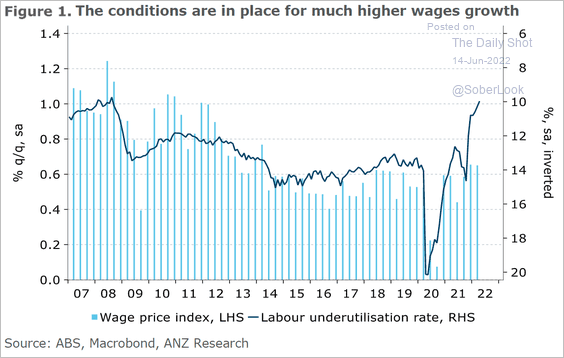
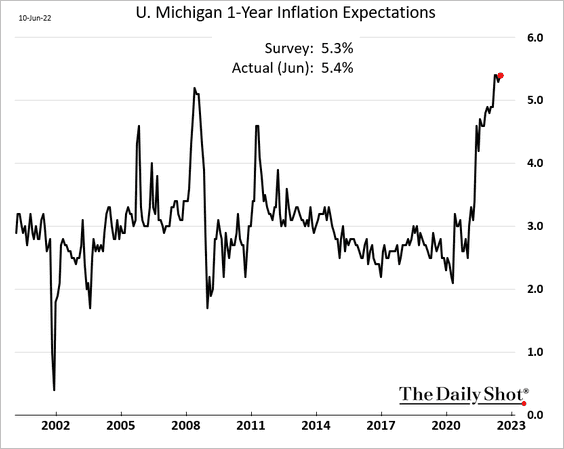
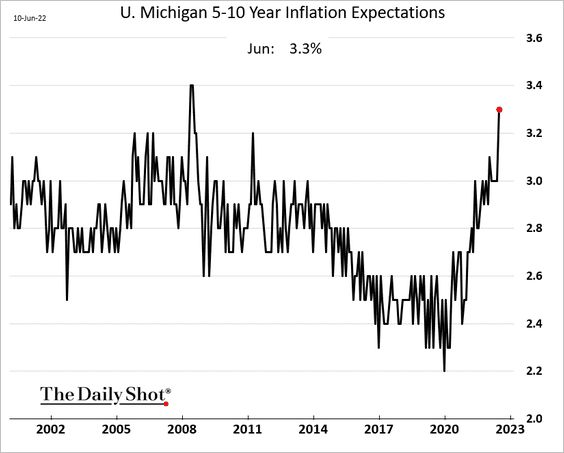
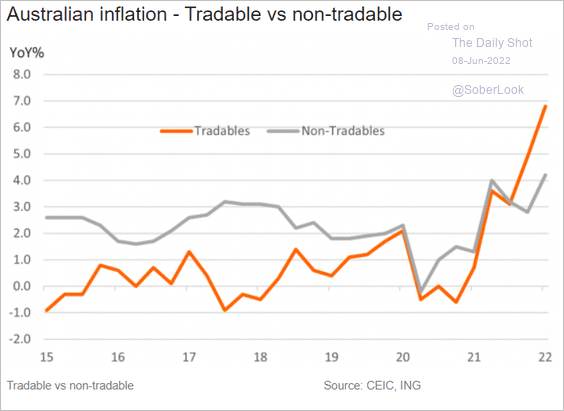
• Consumer inflation expectations surged this month.
Back to Index
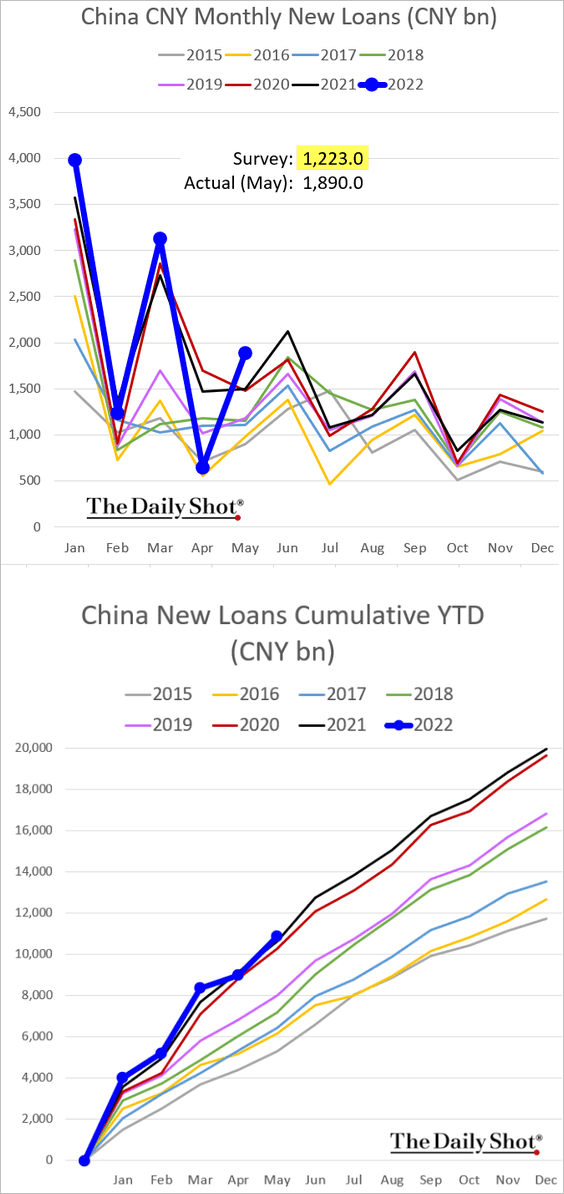
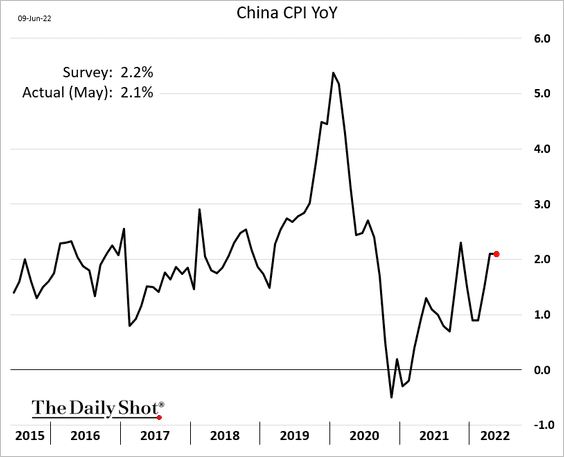
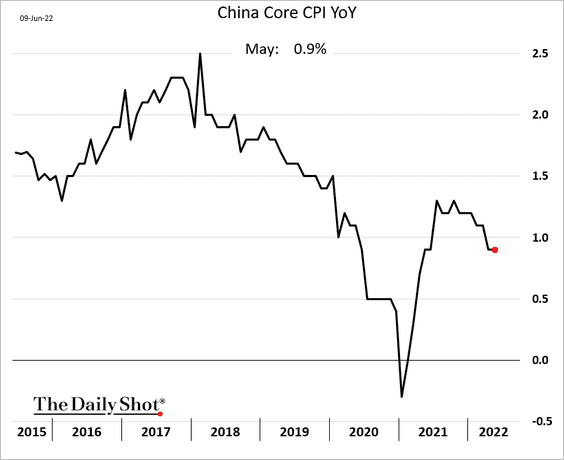
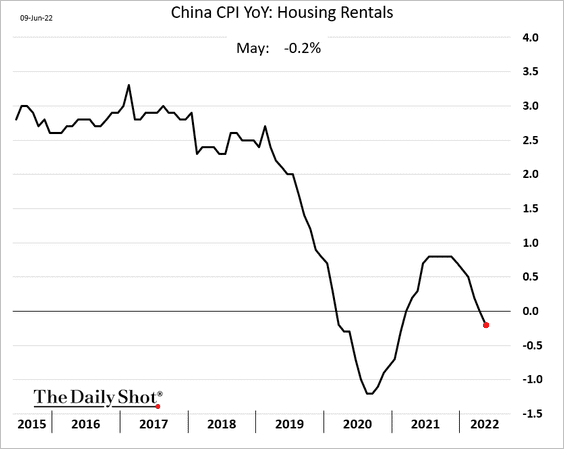
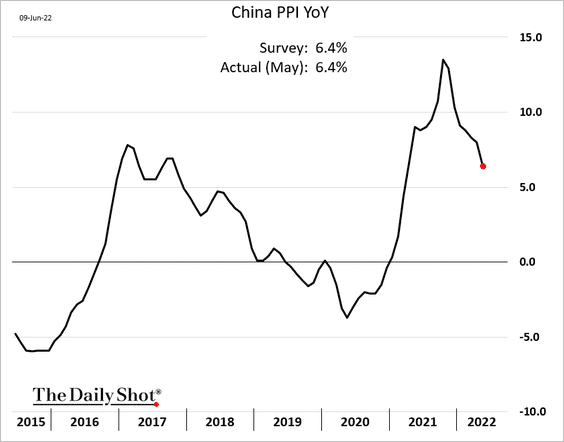
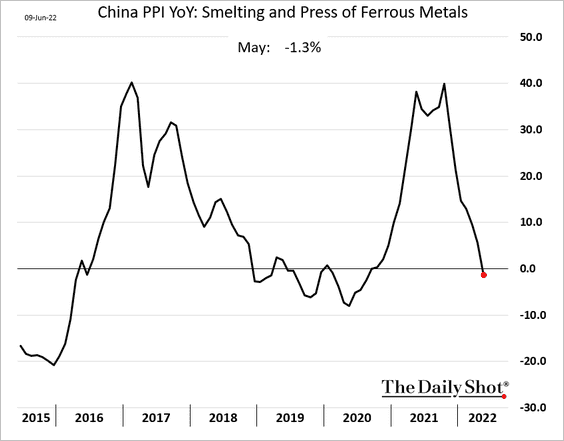
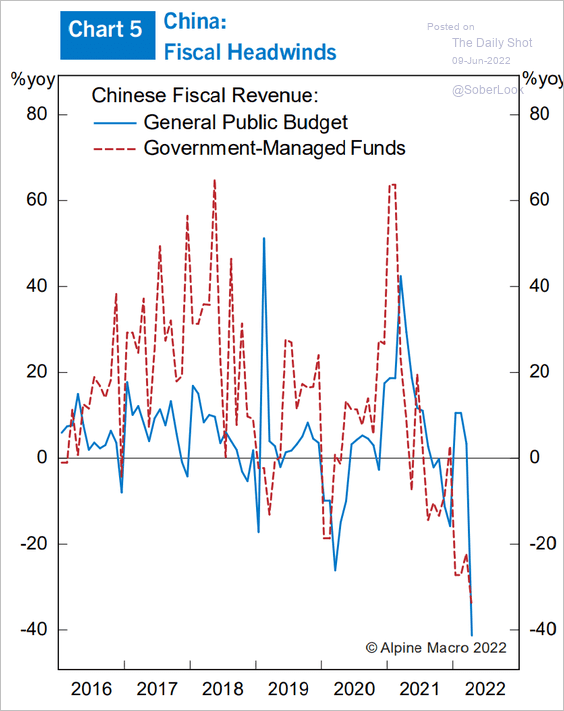
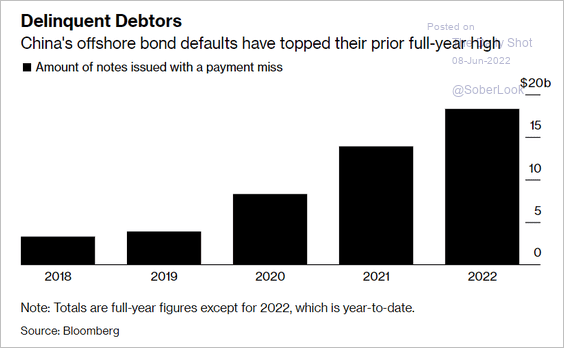
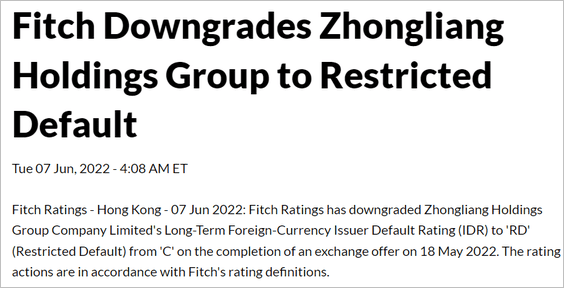
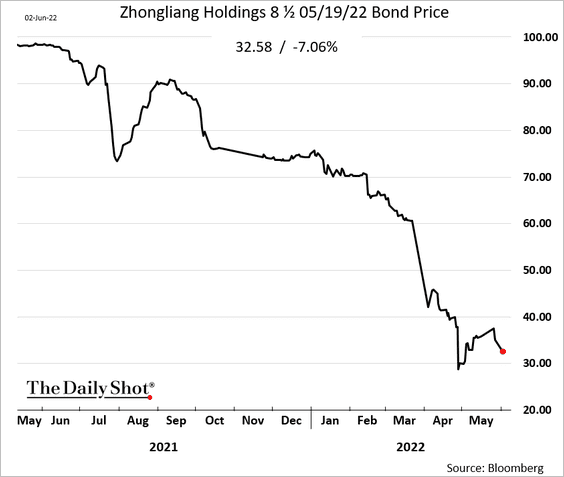
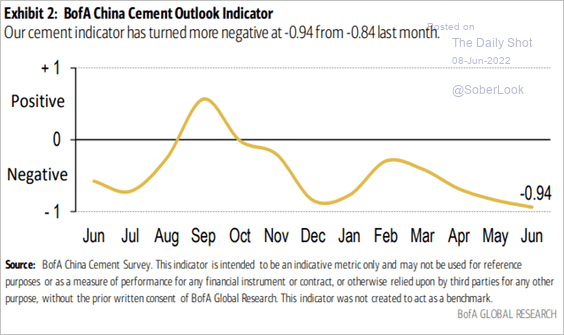
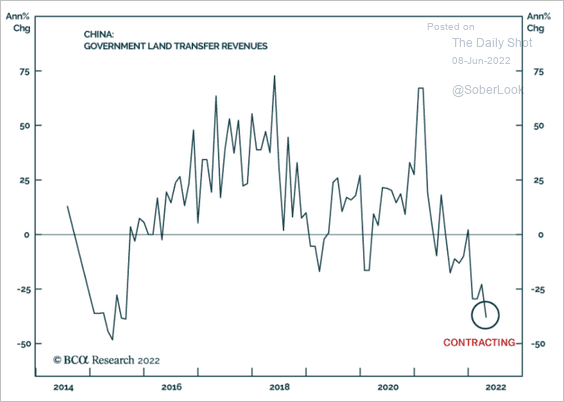
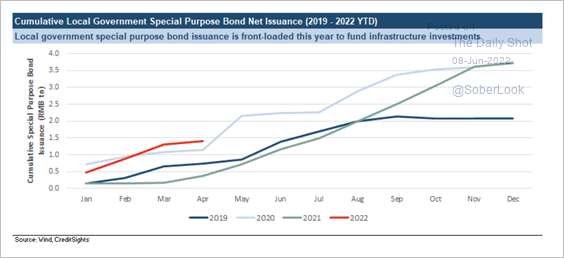
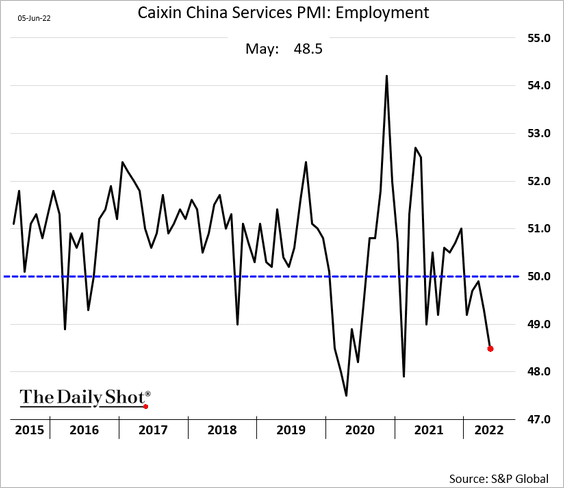
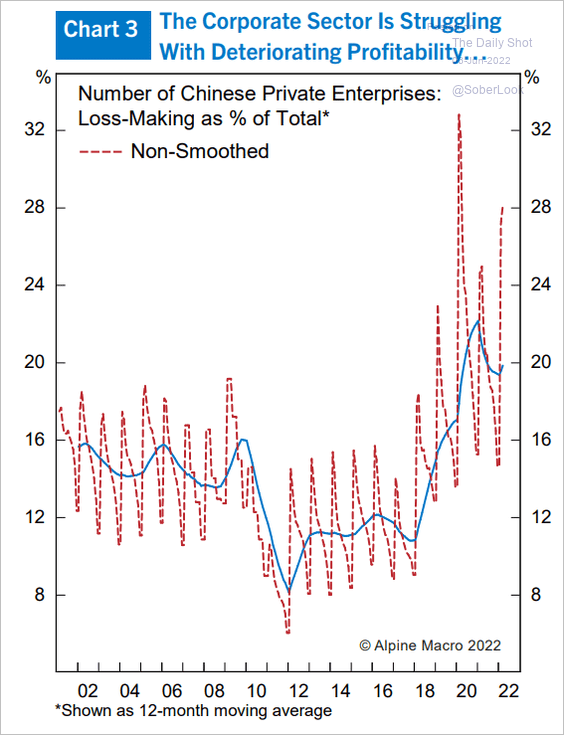
China
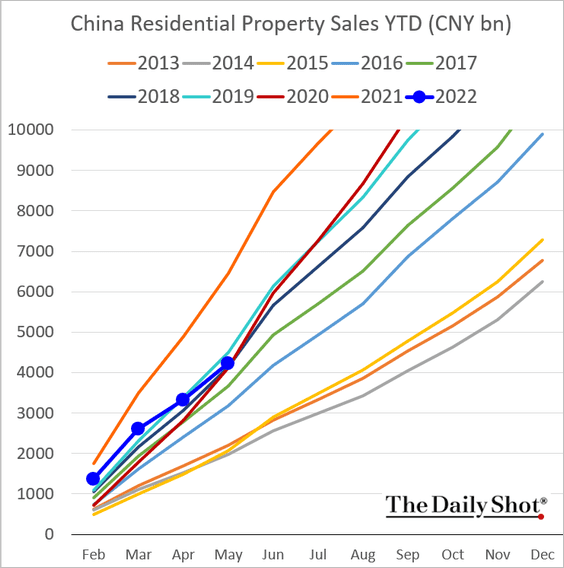
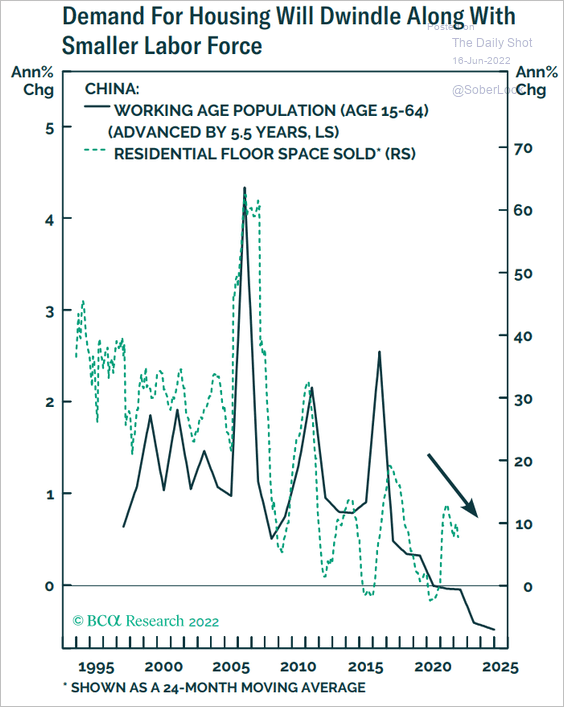
1. New home prices are down vs. a year ago.
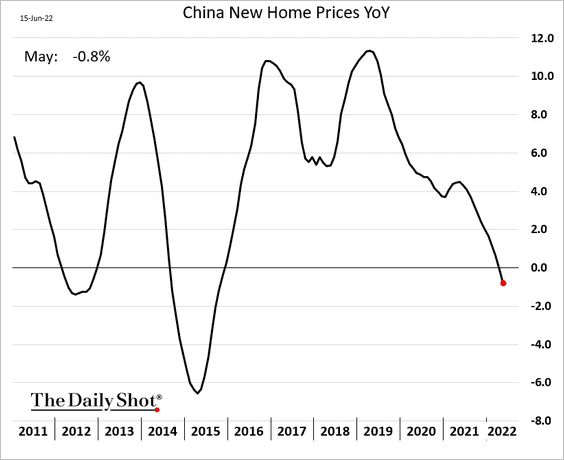
Demographic trends will be a headwind for housing demand.
 Source: BCA Research
——————–
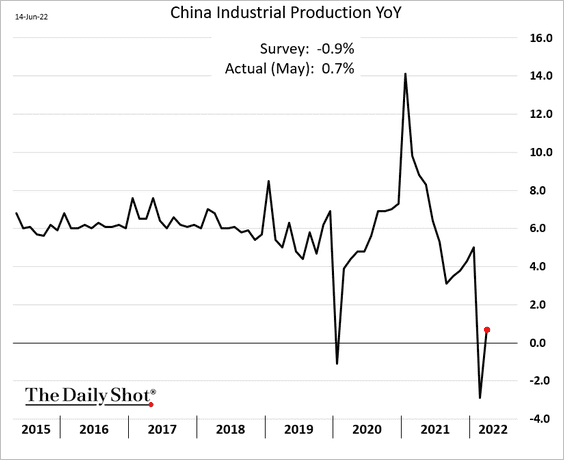
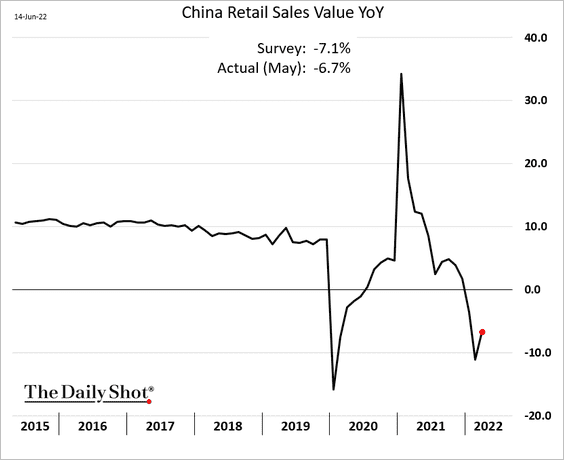
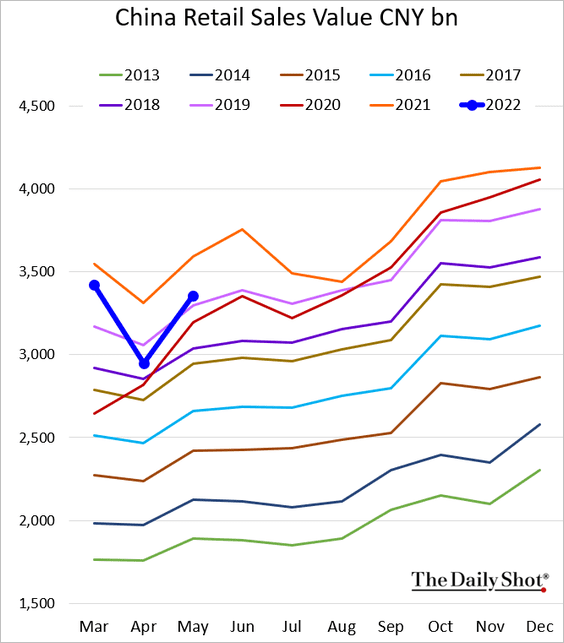
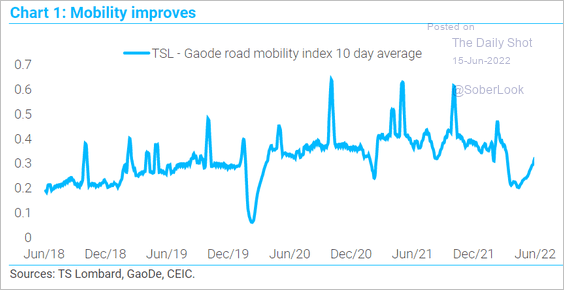
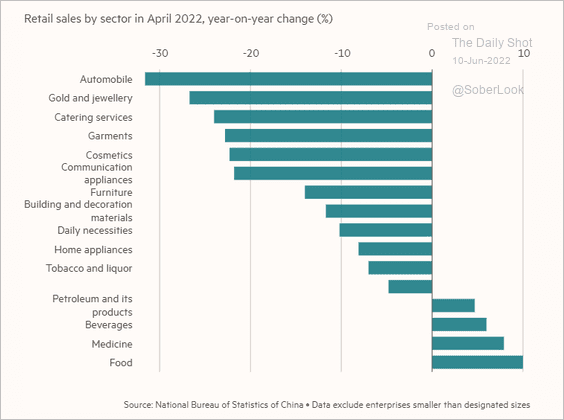
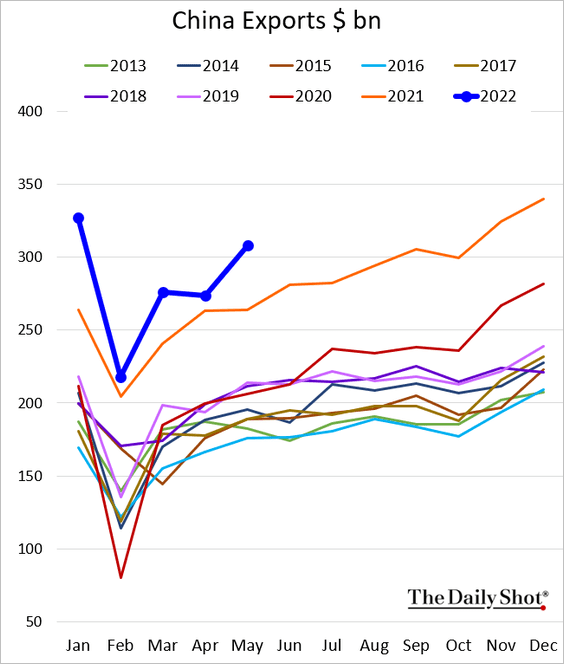
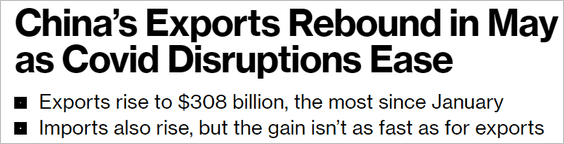
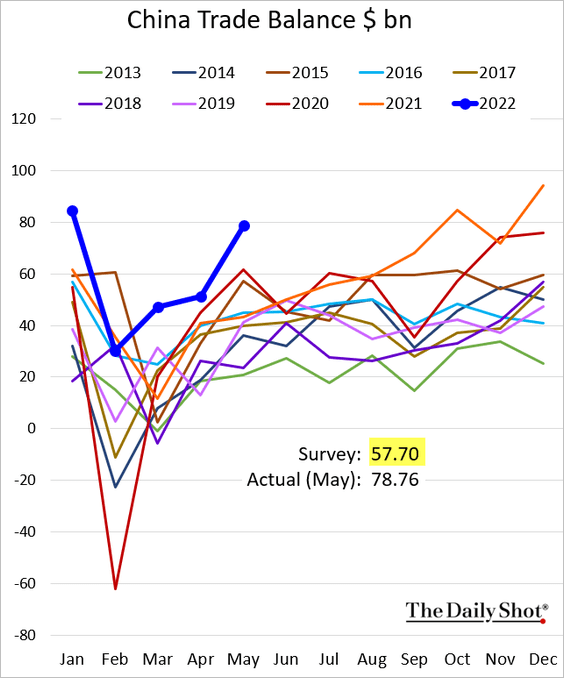
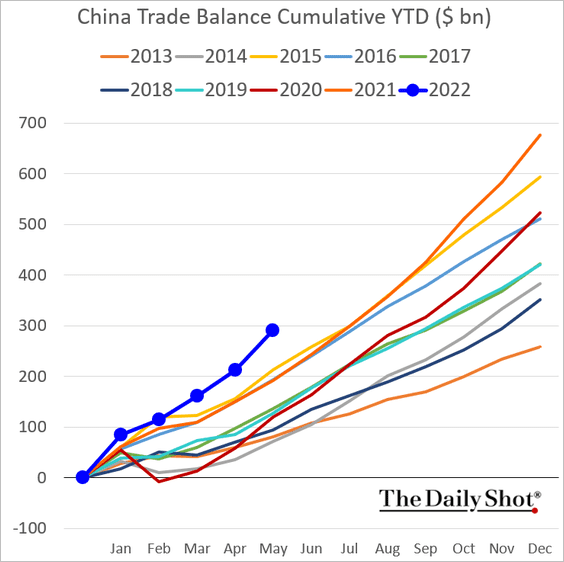
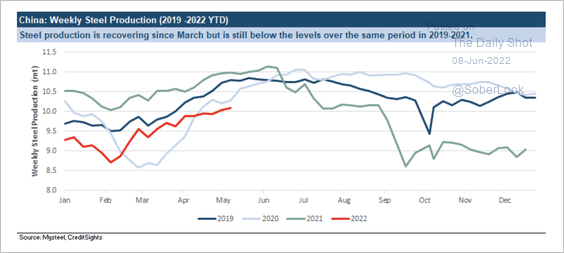
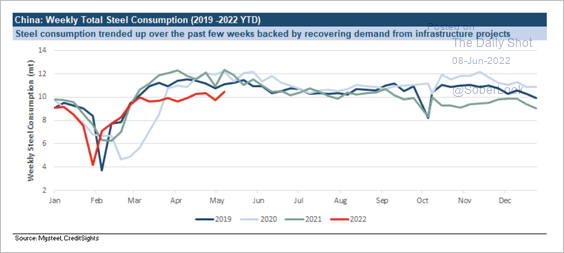
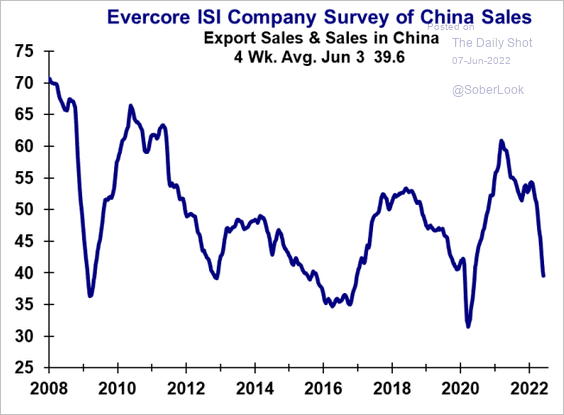
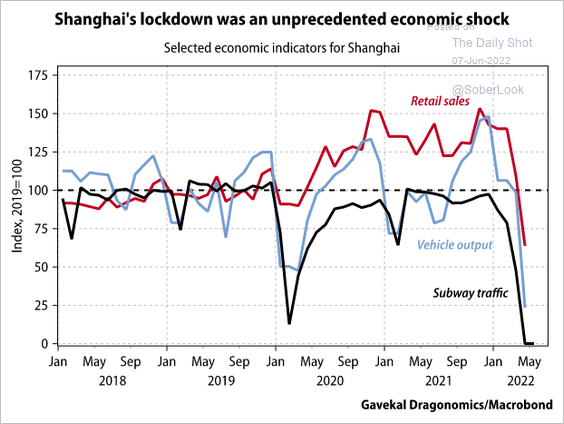
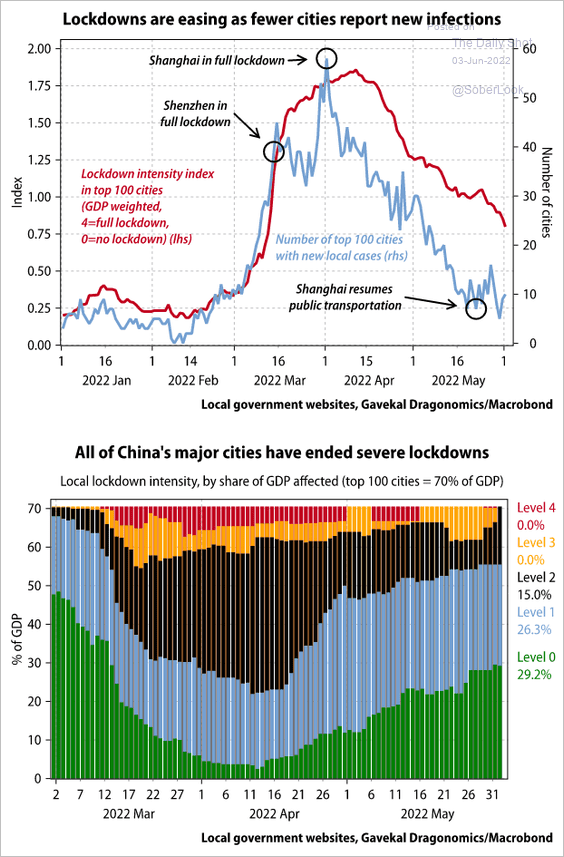
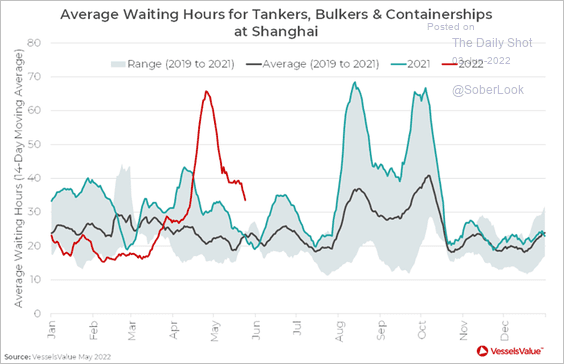
2. The post-lockdown recovery has started.
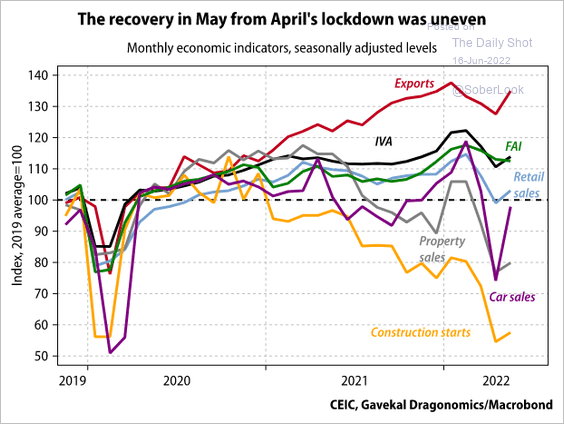 Source: Gavekal Research
Total retail sales remain depressed, but car sales are rebounding.
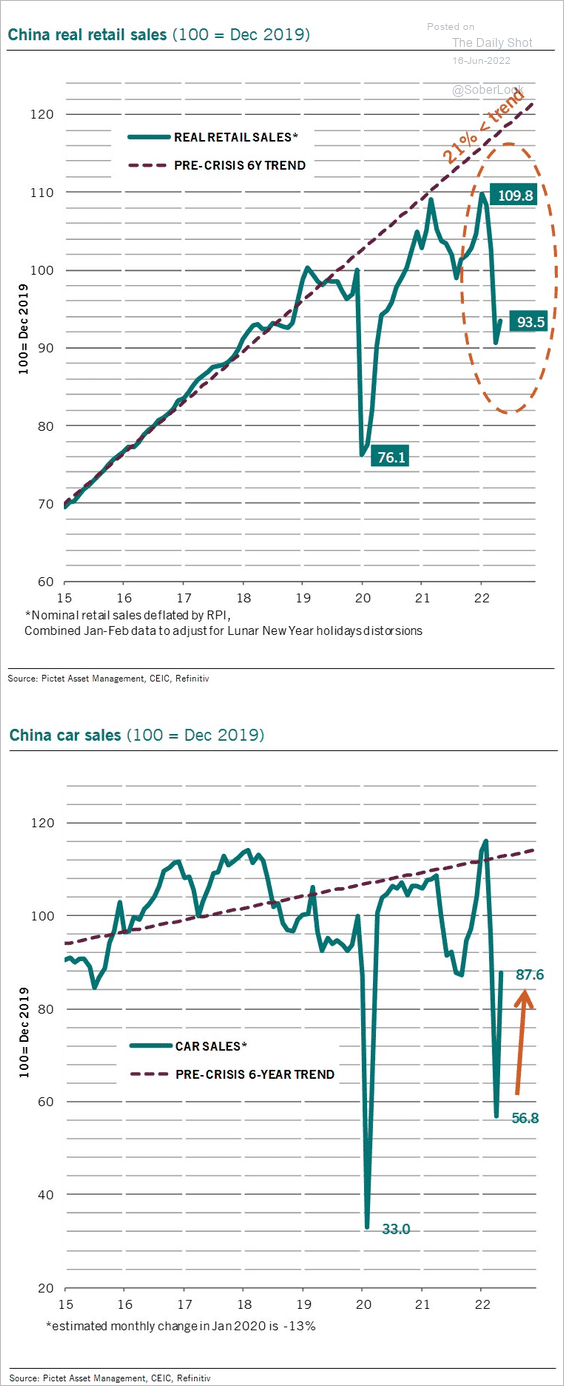 Source: @PkZweifel
——————–
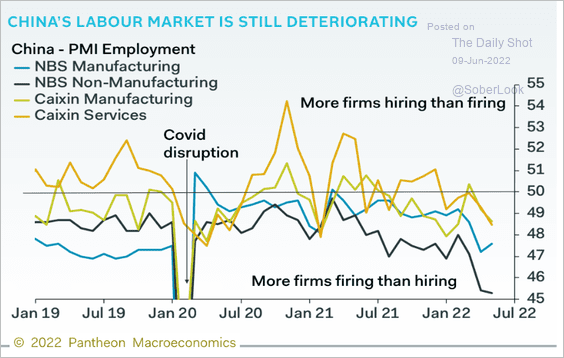
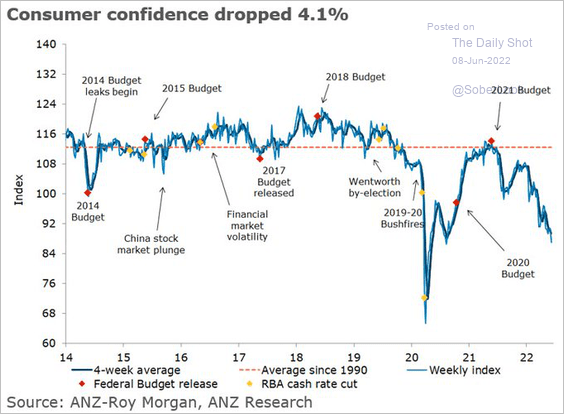
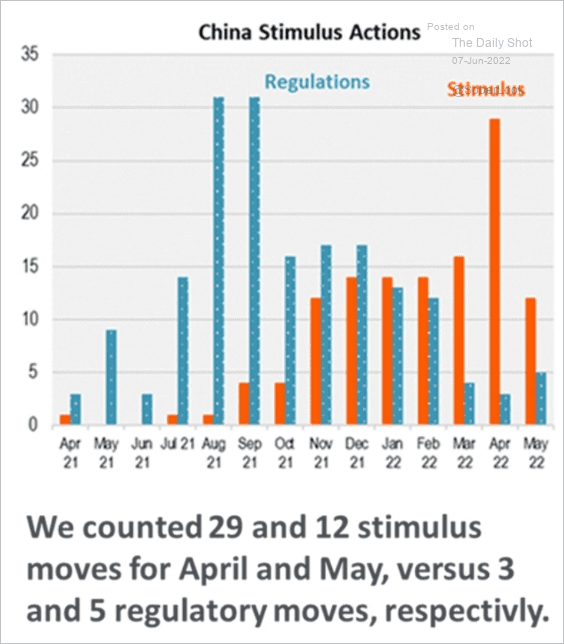
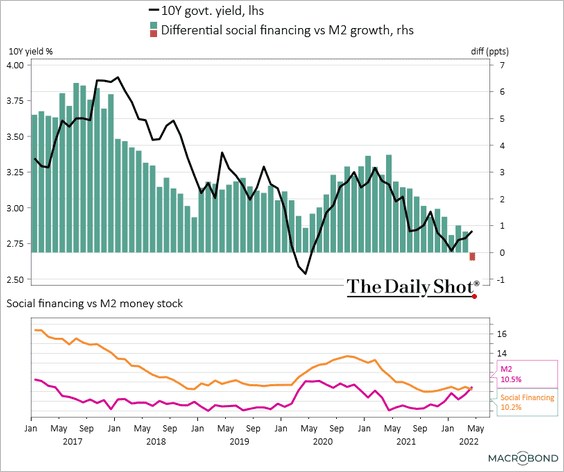
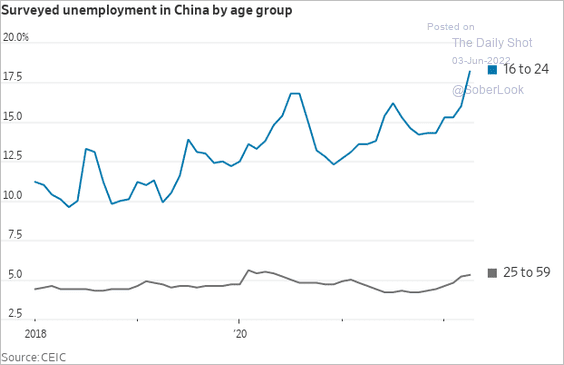
3. Relatively high unemployment will force the PBoC to remain accommodative.
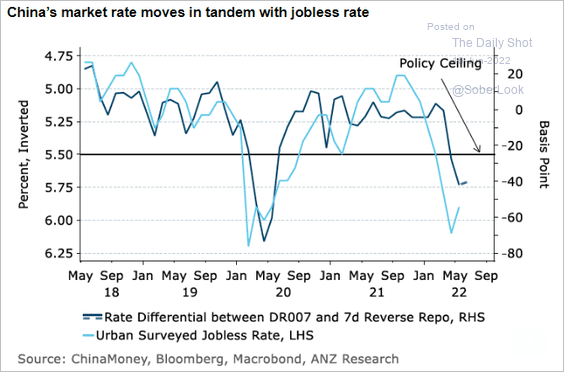 Source: @ANZ_Research
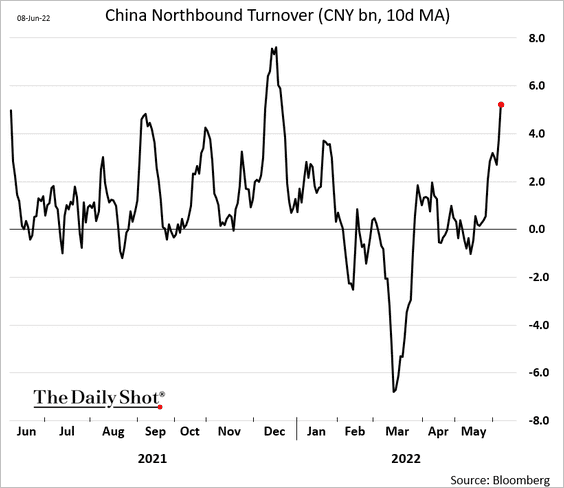
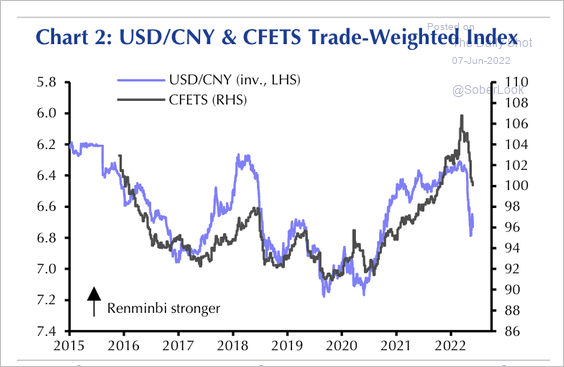
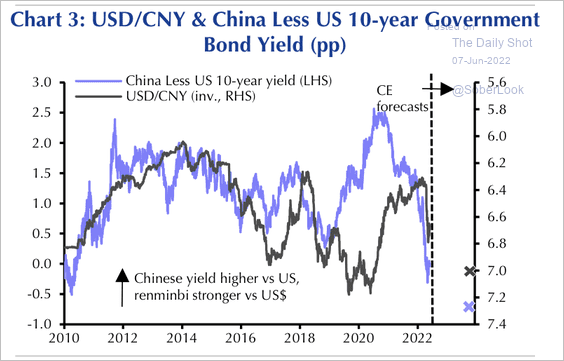
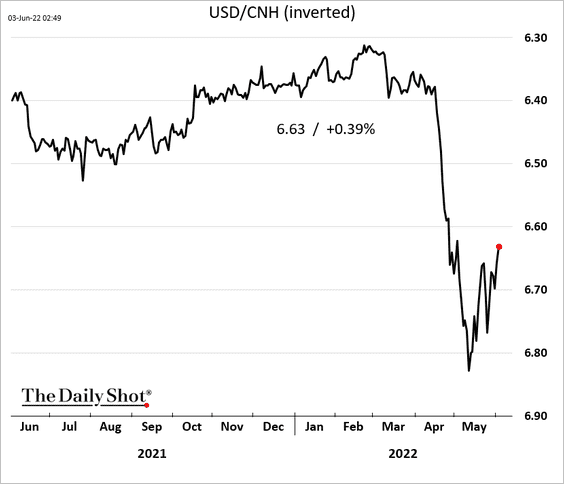
4. Interest rate differentials point to a weaker Chinese yuan vs. the dollar.
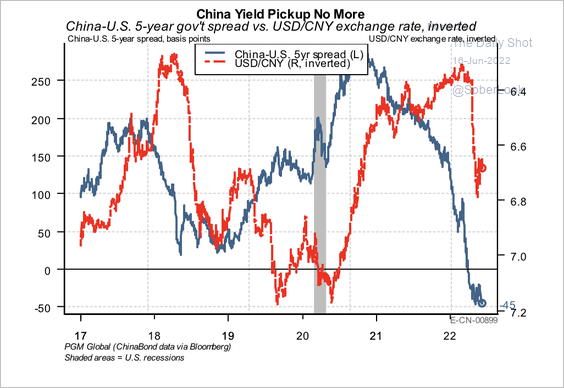 Source: PGM Global
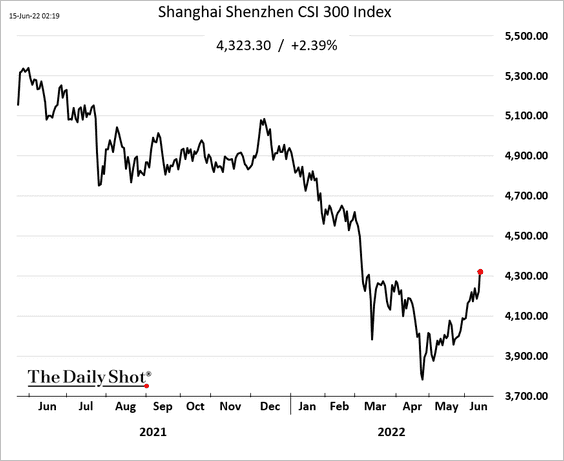
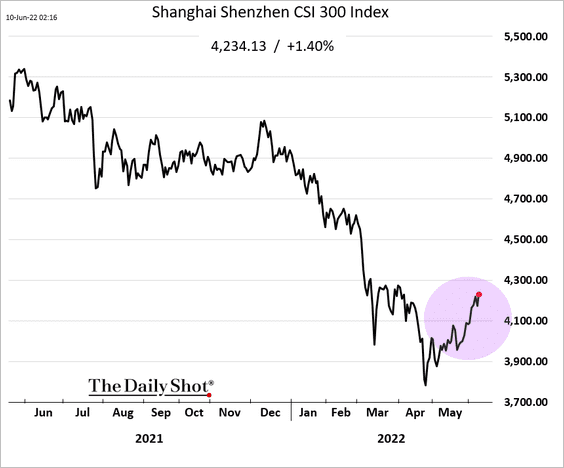
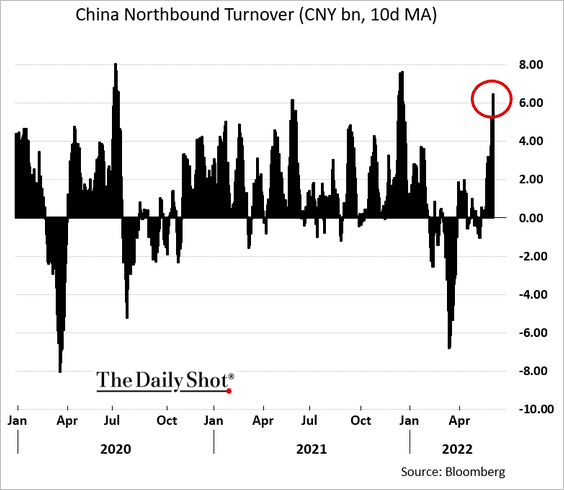
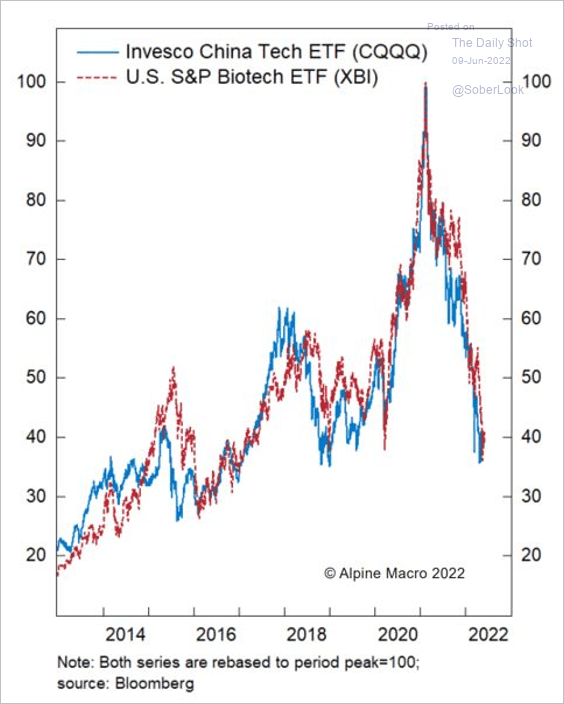
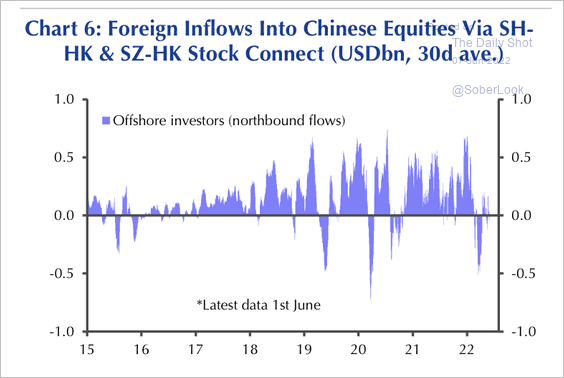
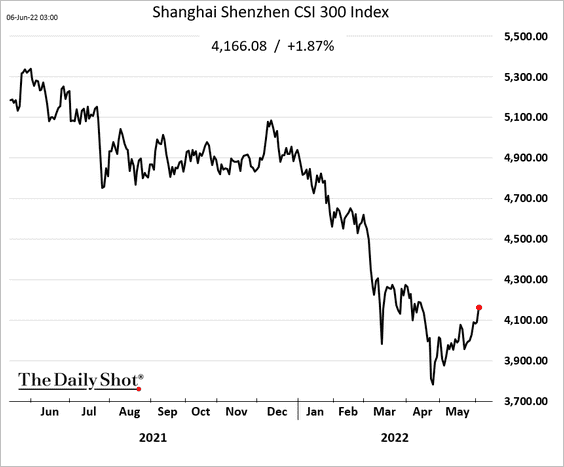
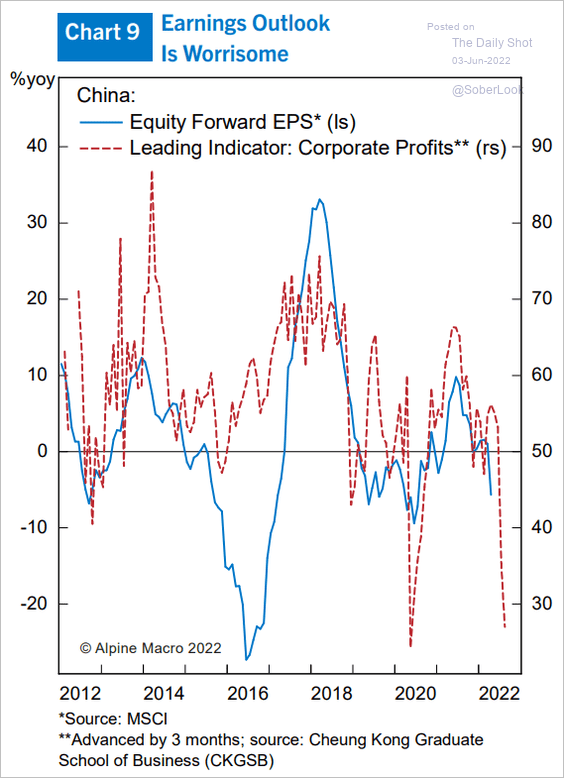
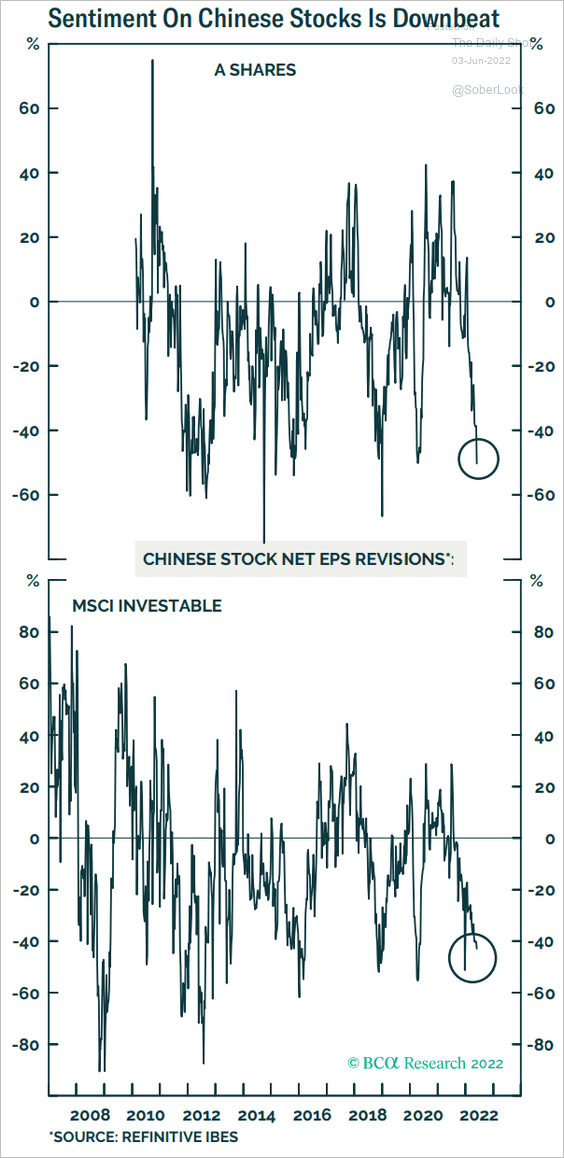
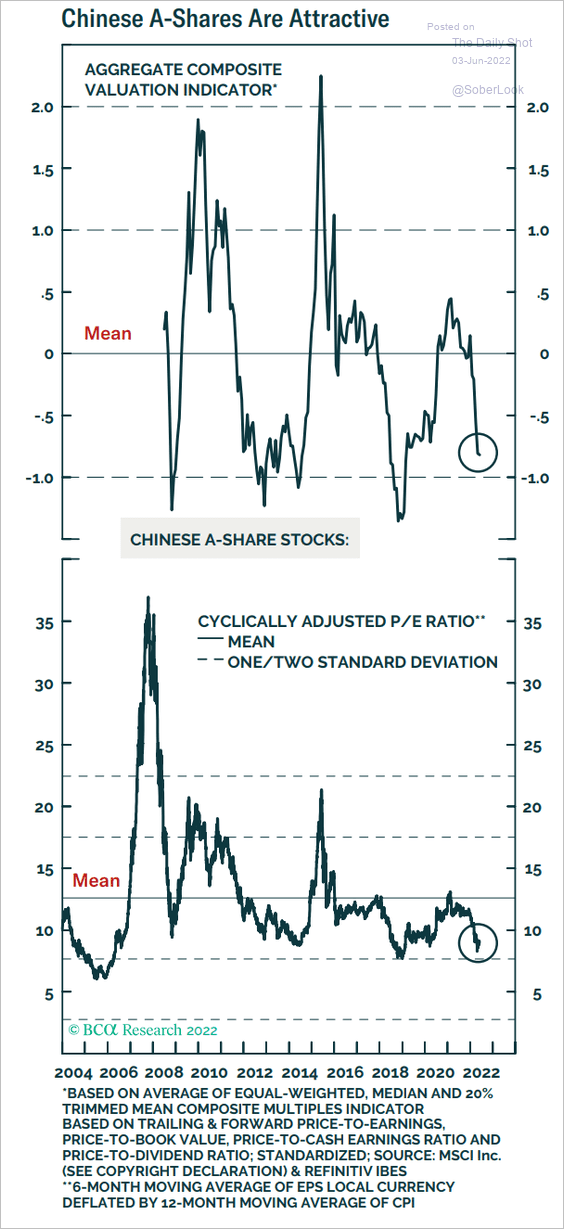
5. Chinese stocks are rising from low valuation levels, although the earnings outlook is uncertain.
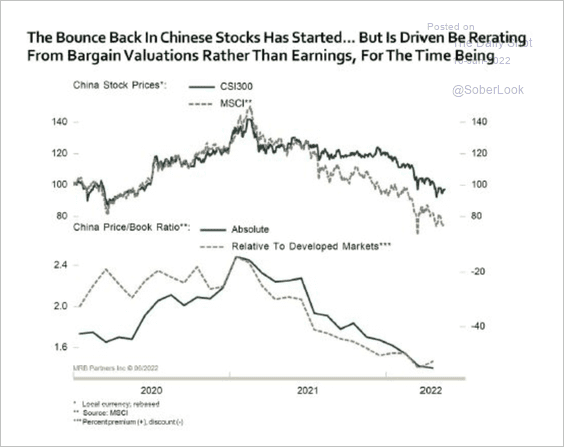 Source: MRB Partners
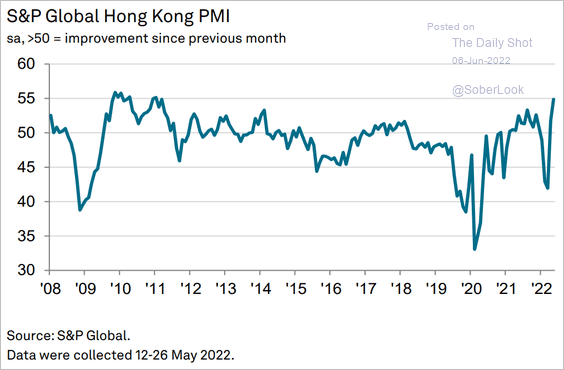
6. Hong Kong’s economy has been rebounding.
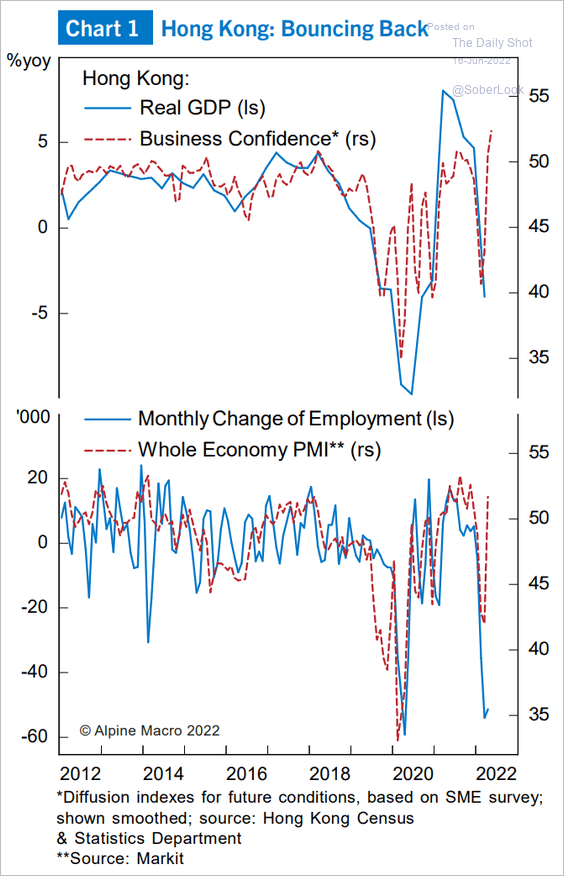 Source: Alpine Macro
And there is plenty of room for recovery.
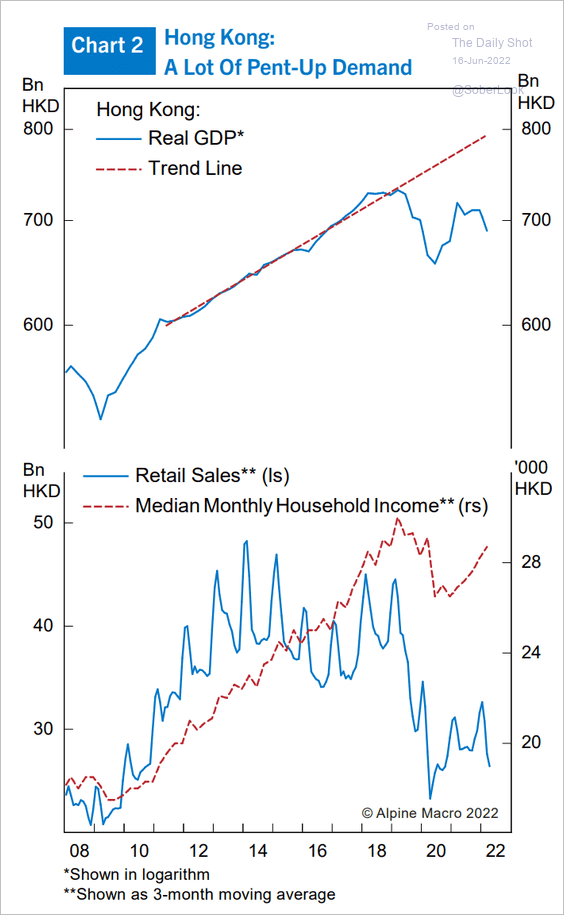 Source: Alpine Macro
Back to Index
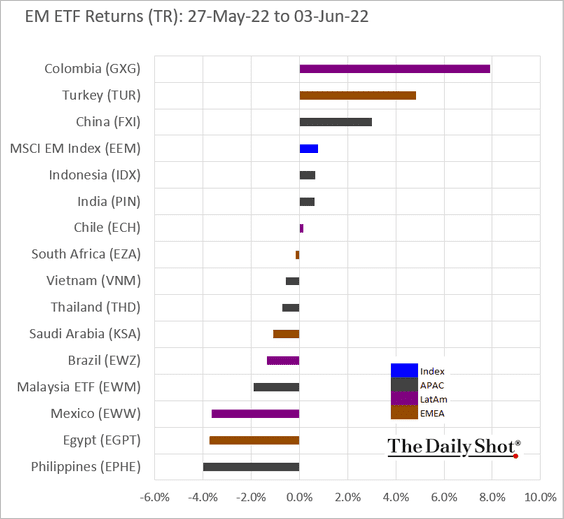
Emerging Markets
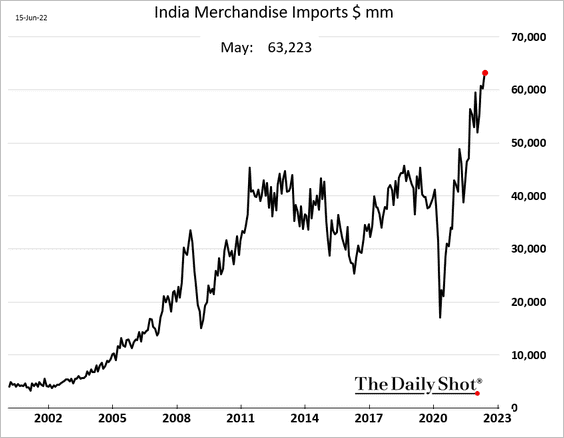
1. India’s current account has been deteriorating.
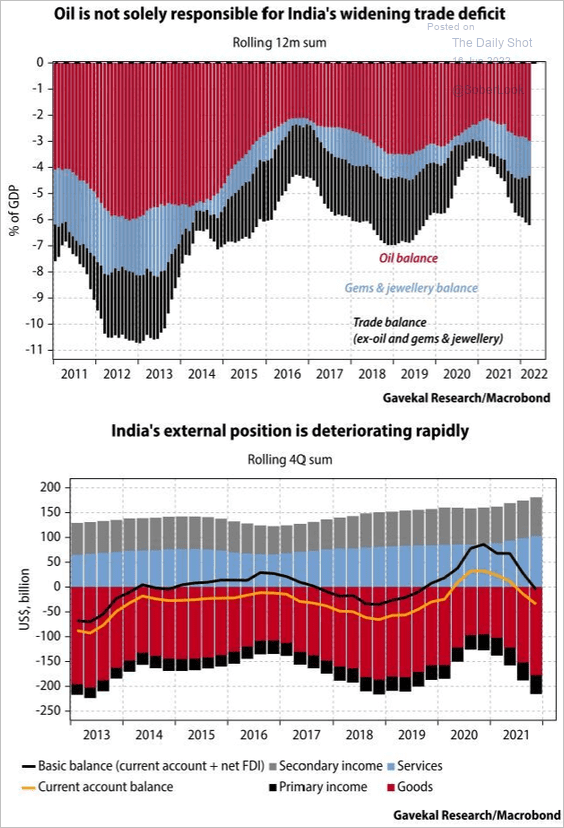 Source: Gavekal Research
The trade deficit hit a new record in May, …
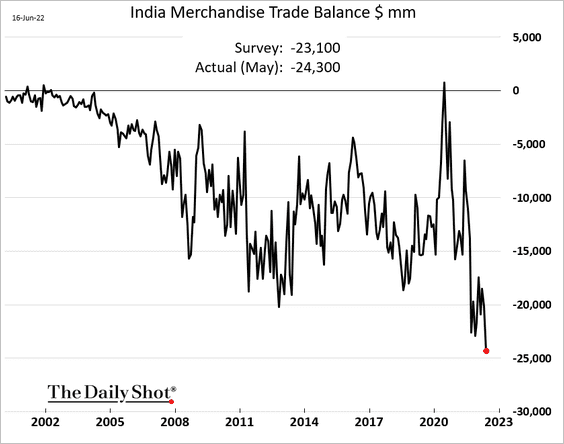
… as imports surge (boosted by elevated energy prices).
——————–
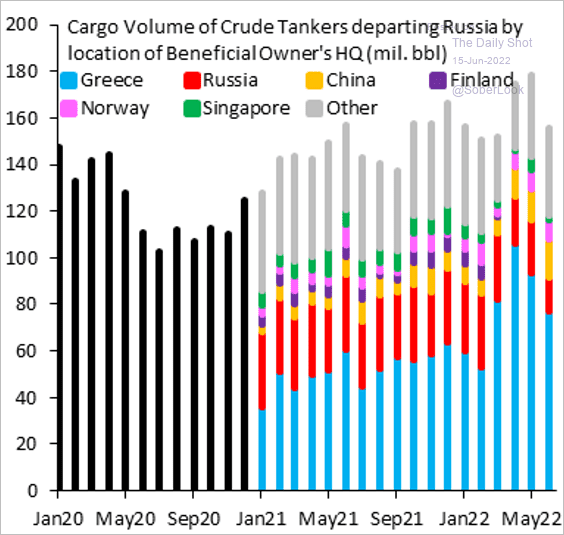
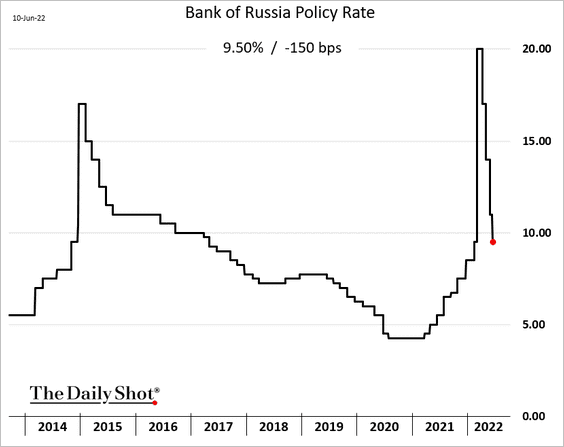
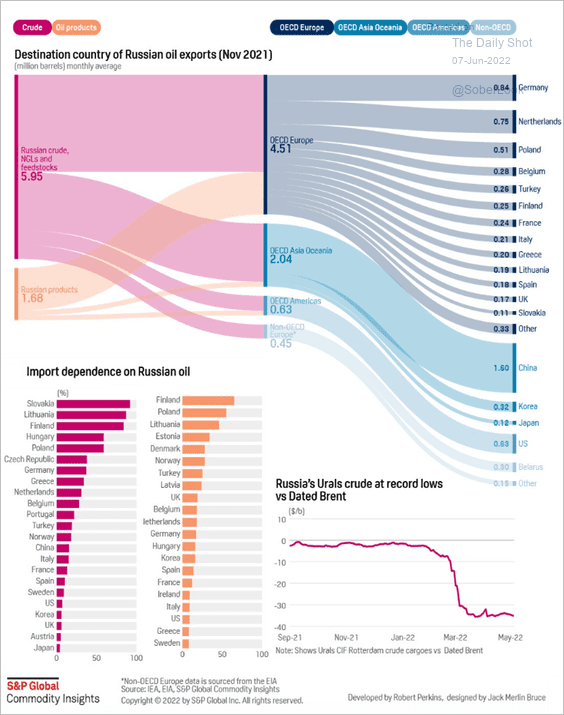
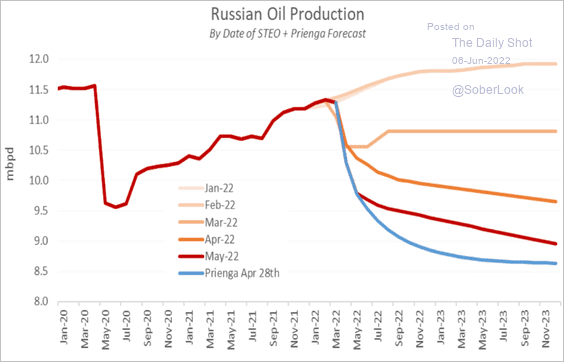
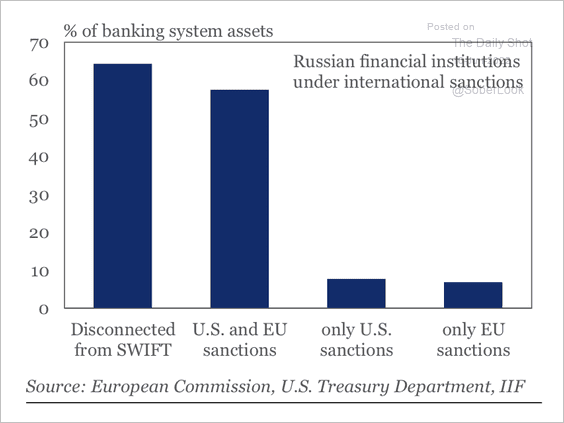
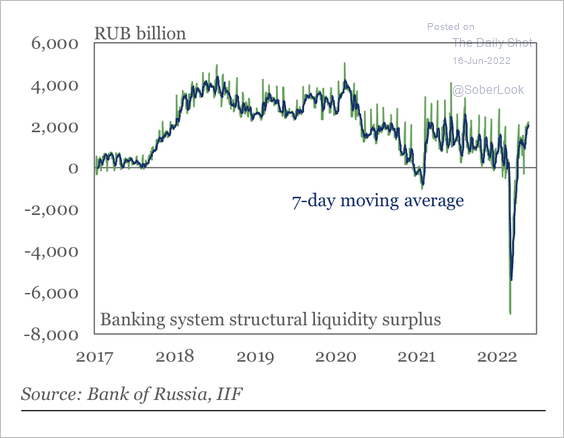
2. Here are some updates on Russia.
• Russian banking sector sanctions have been significant.
 Source: IIF
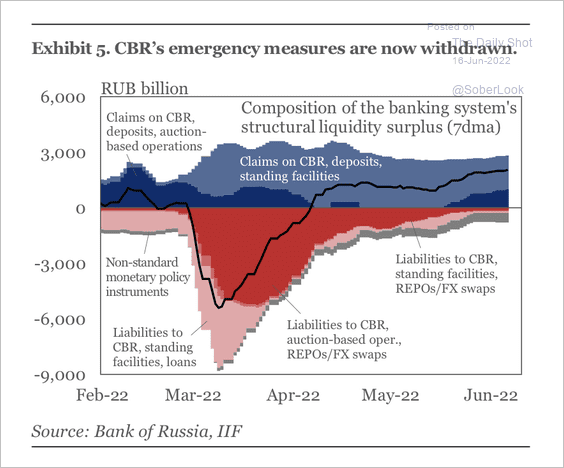
– Structural liquidity has recovered from a deficit in Russia’s banking system.
 Source: IIF
– The central bank’s emergency measures are now withdrawn.
 Source: IIF
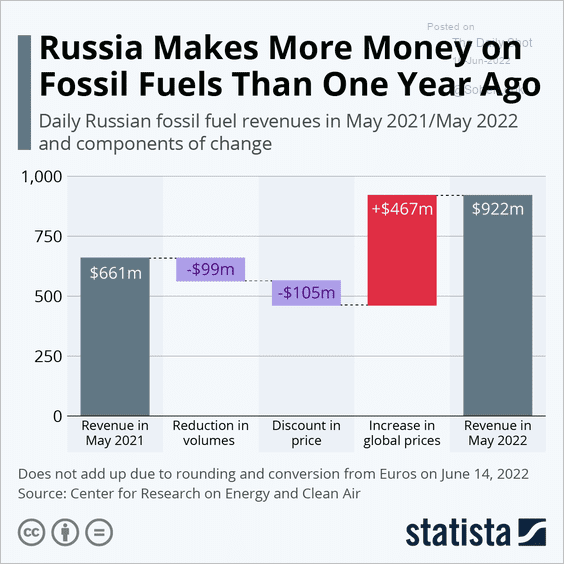
• Energy revenue is up vs. a year ago.
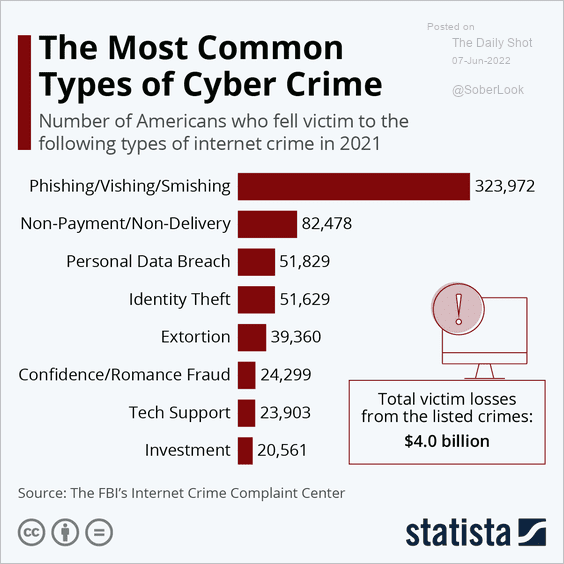
 Source: Statista
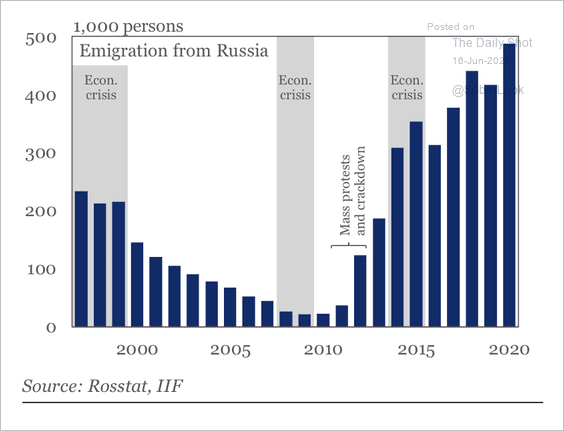
• Emigration from Russia has risen over the last decade.
 Source: IIF
——————–
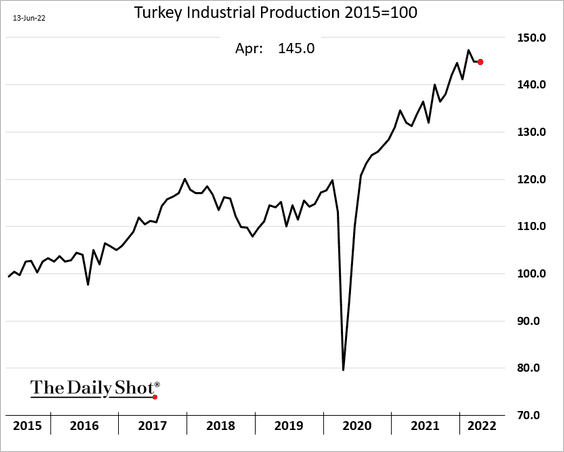
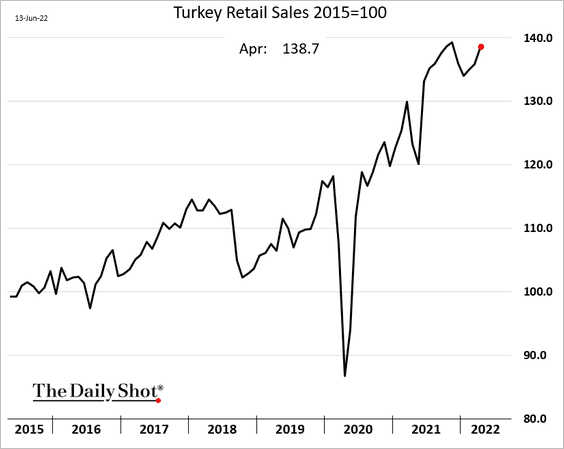
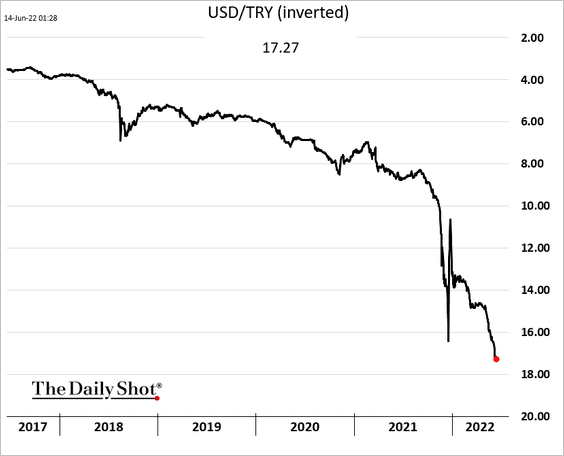
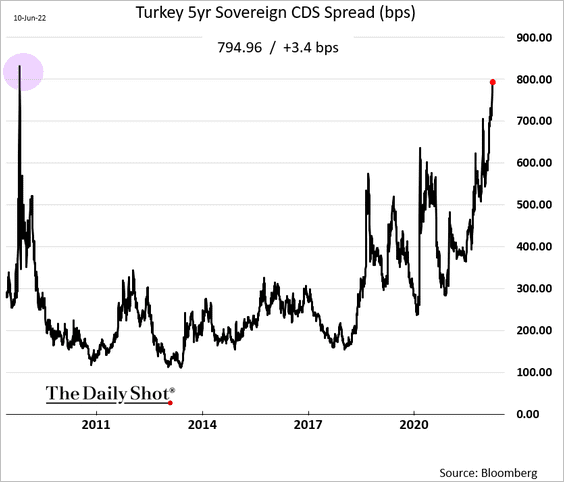
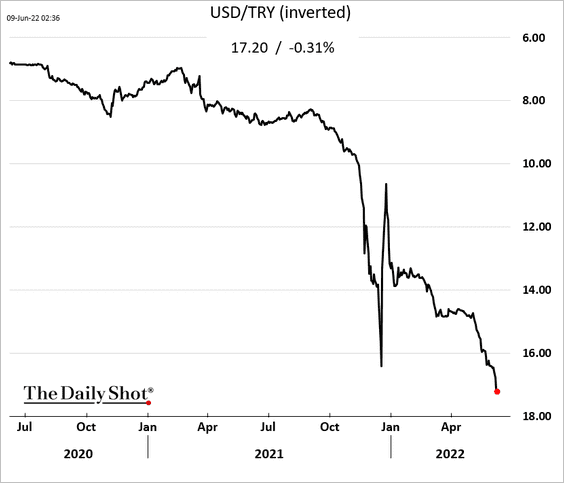
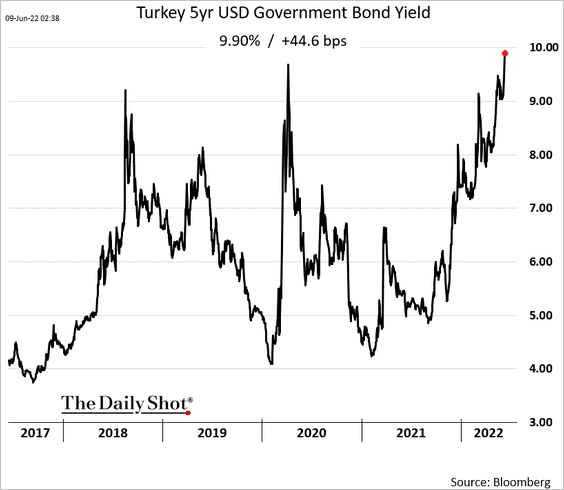
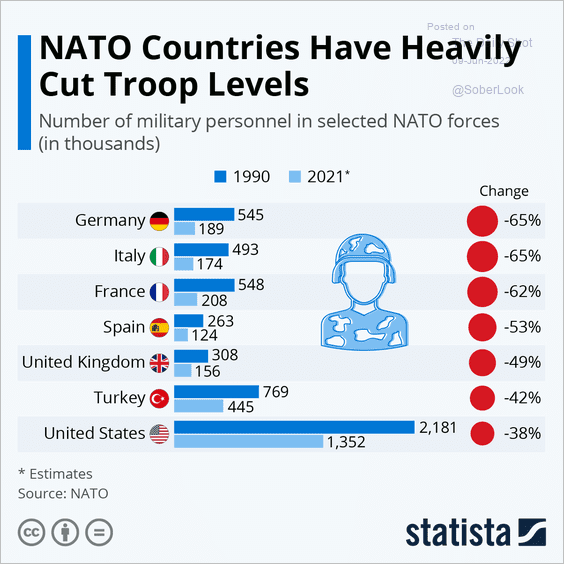
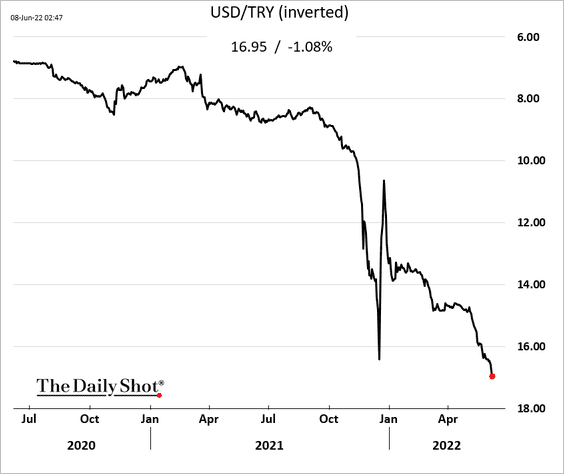
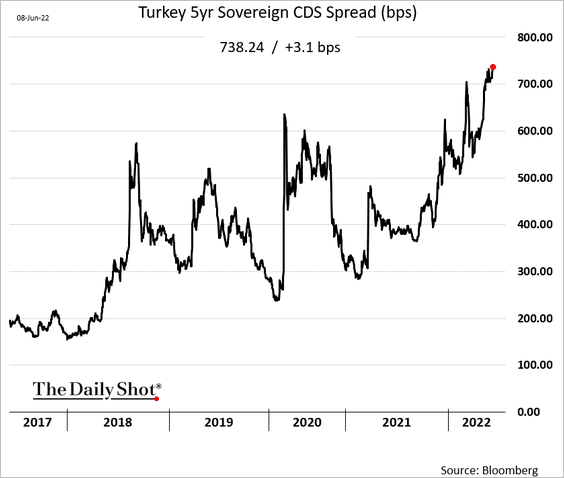
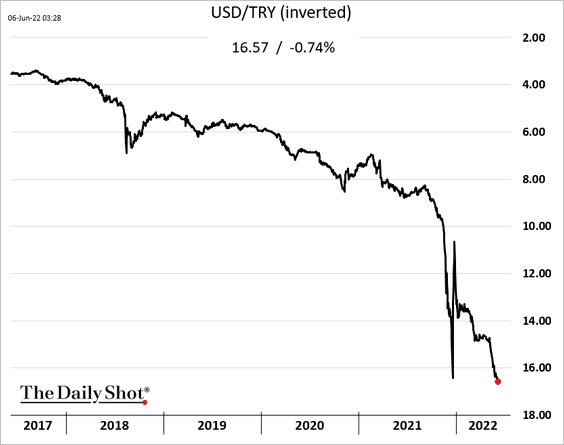
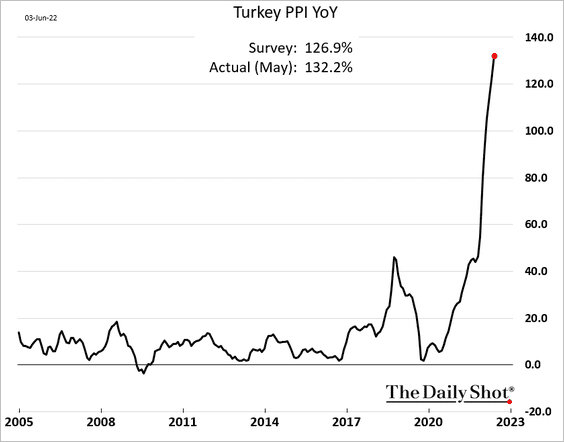
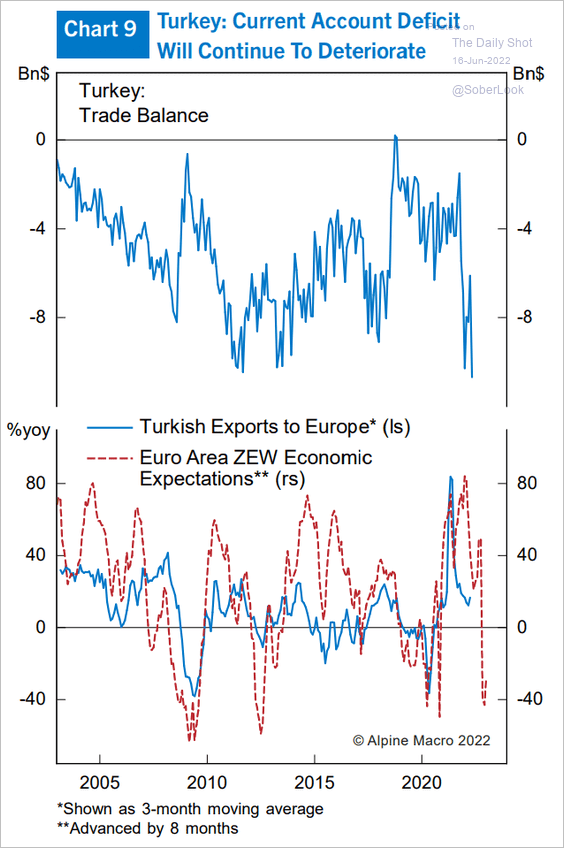
3. Turkey’s exports continue to face headwinds.
 Source: Alpine Macro
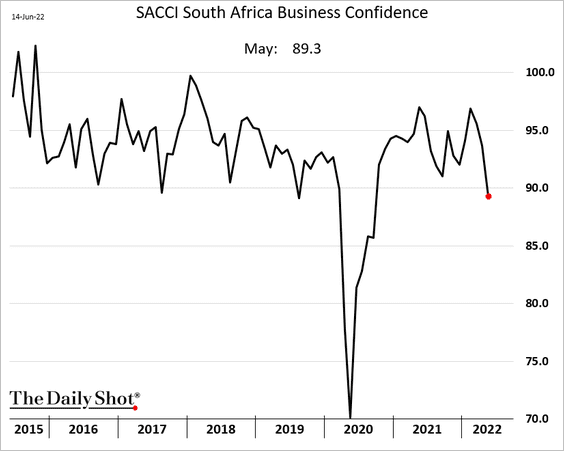
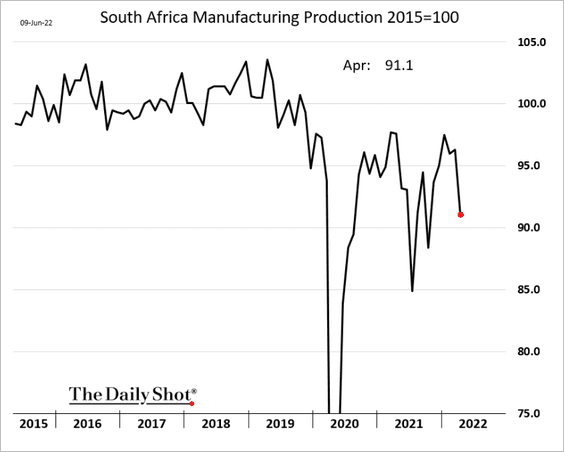
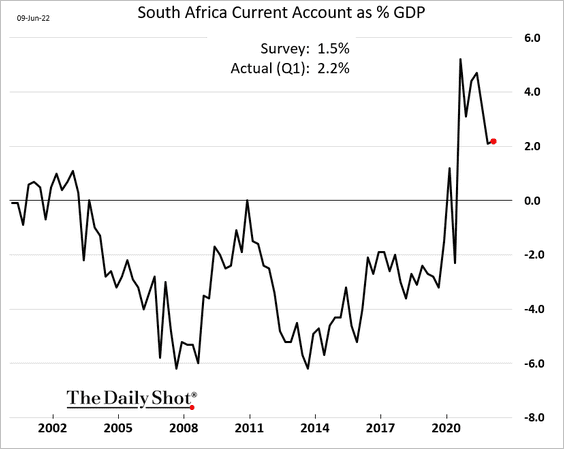
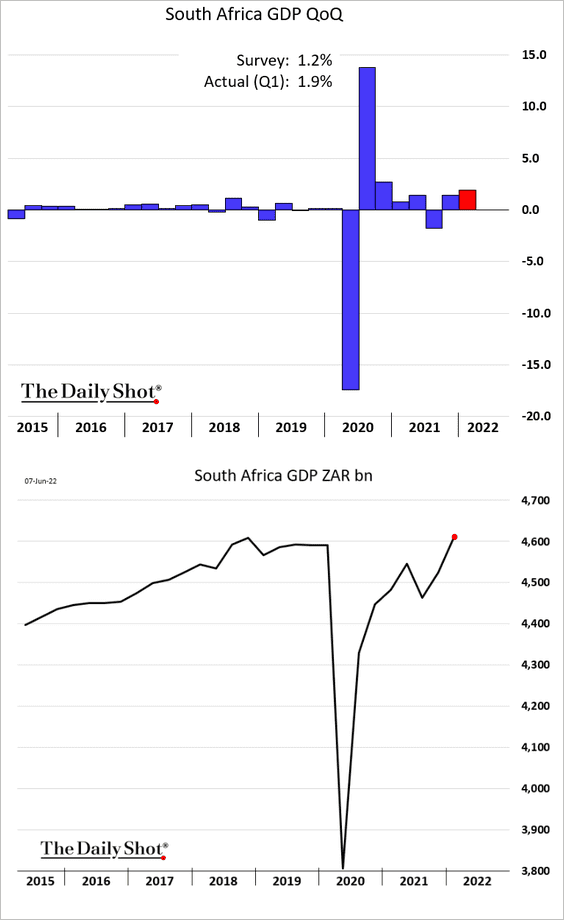
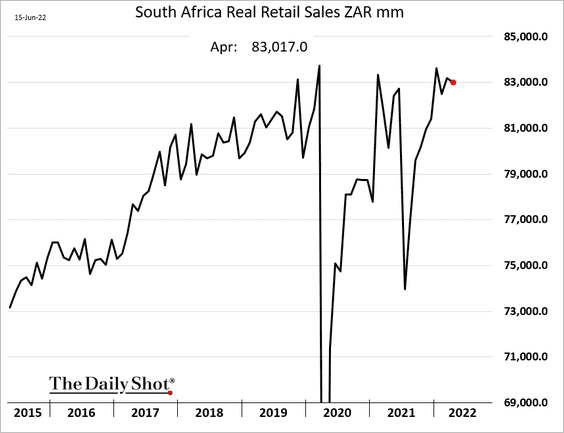
4. South Africa’s retail sales are holding up well.
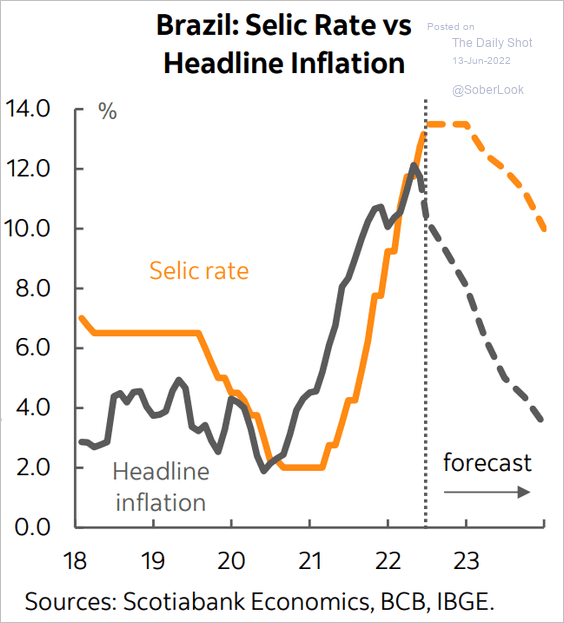
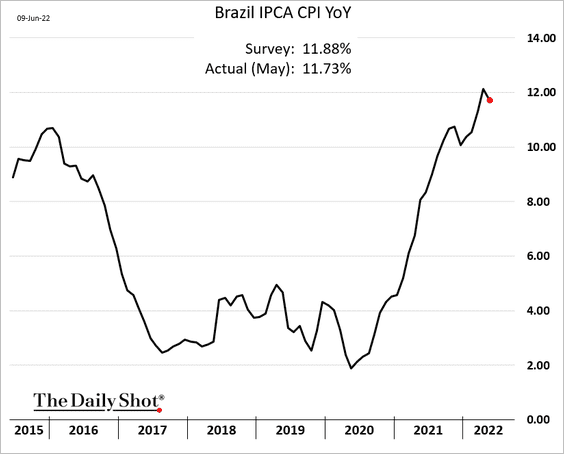
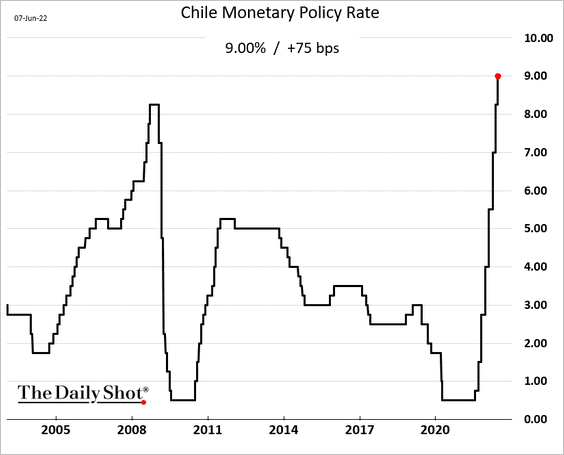
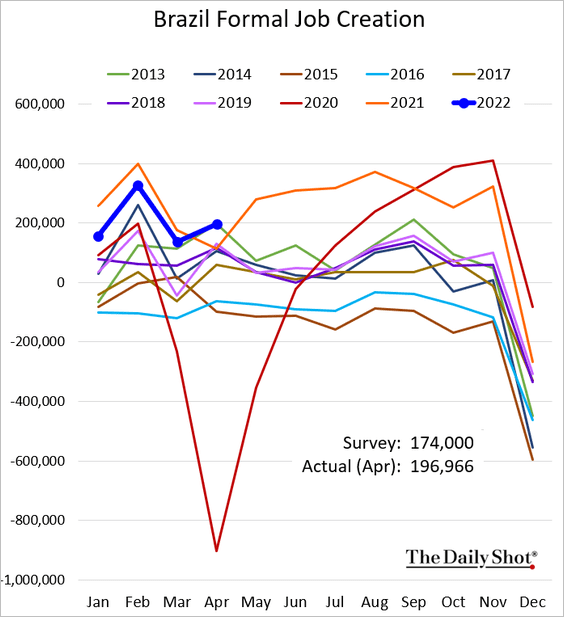
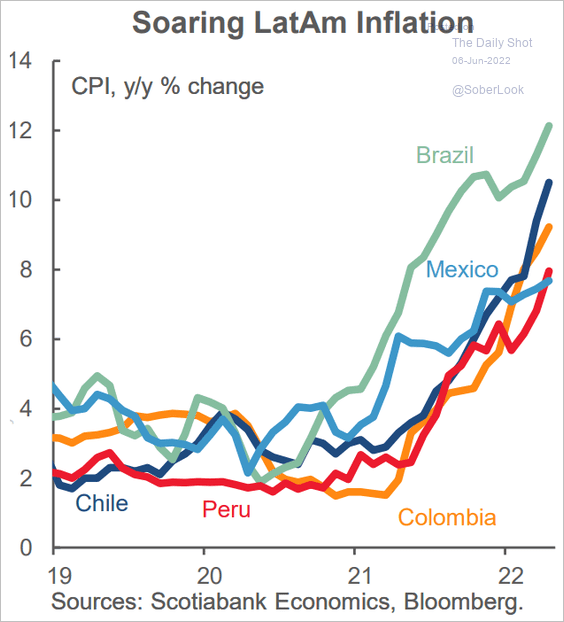
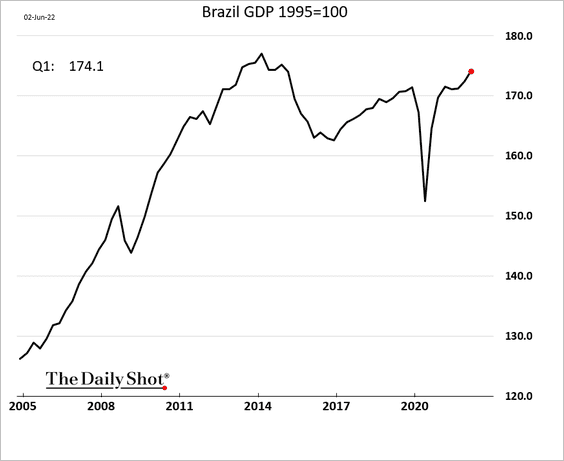
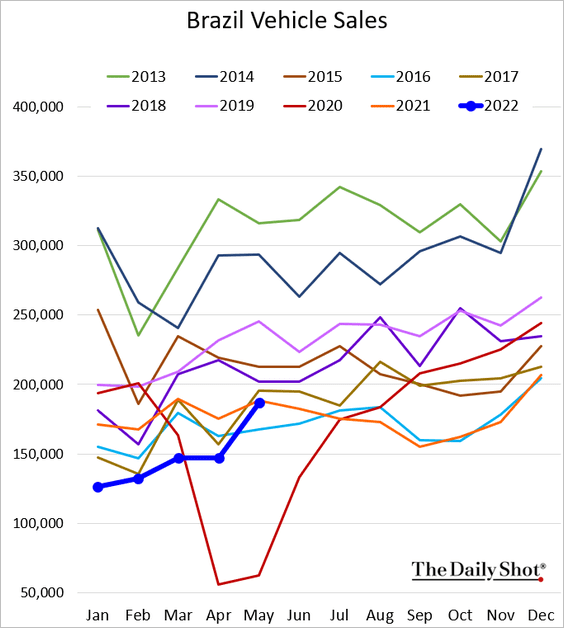
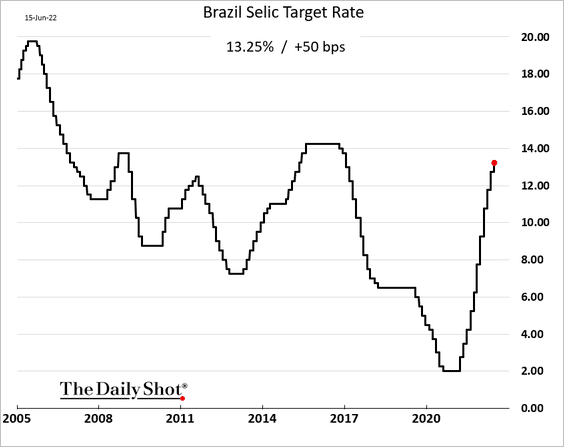
5. Brazil’s central bank delivered a 50 bps rate hike. There is at least one more coming (perhaps several).
Back to Index
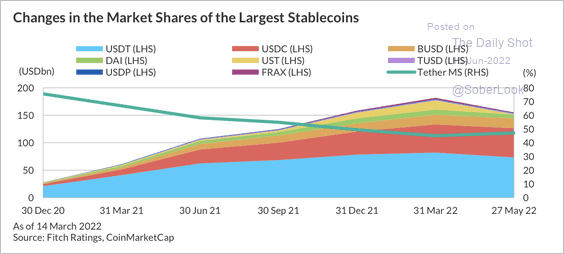
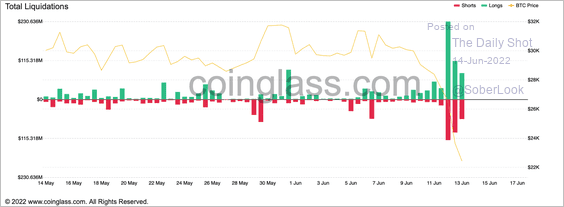
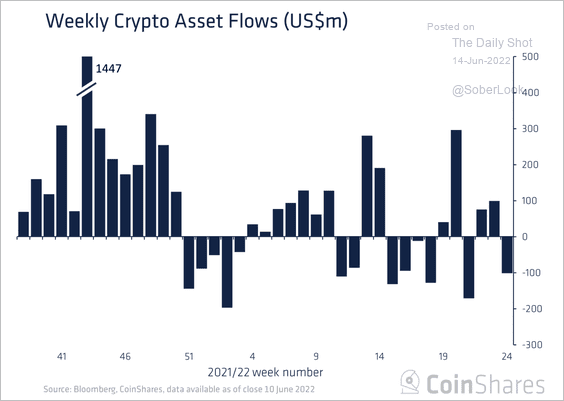
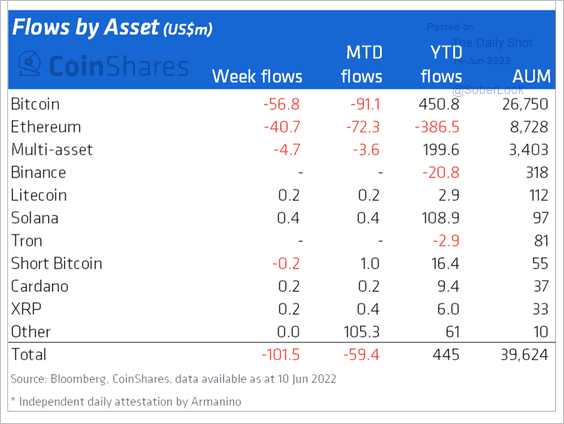
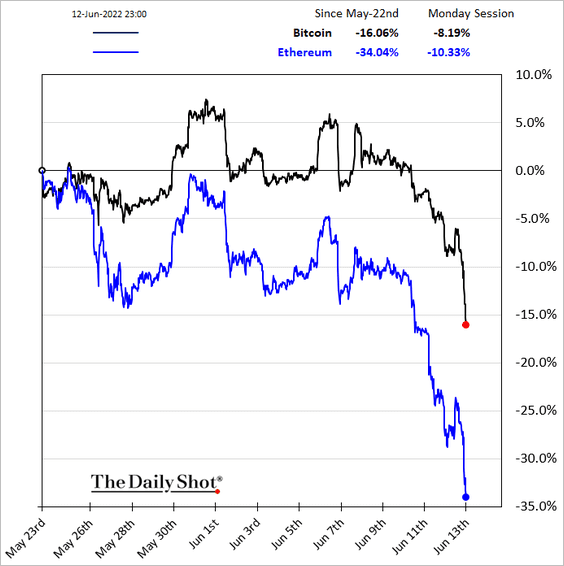
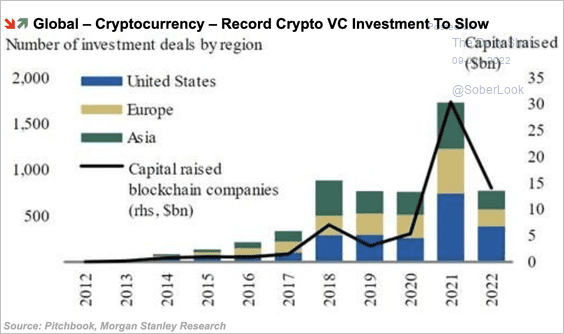
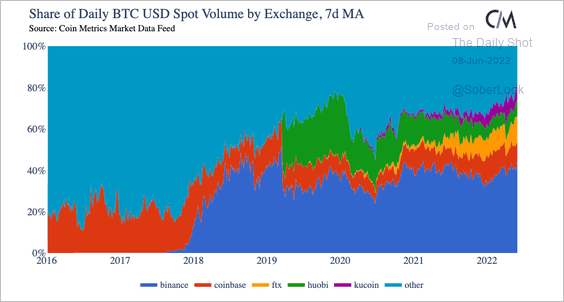
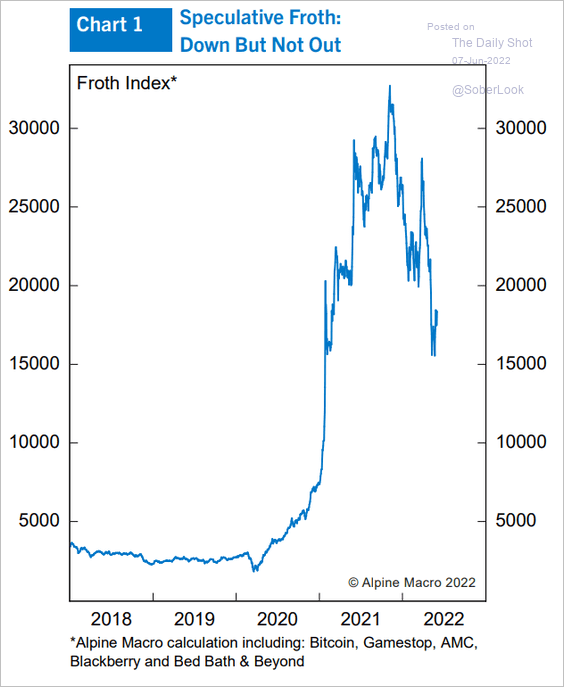
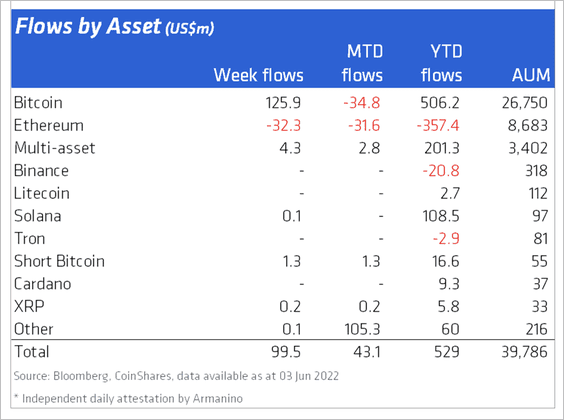
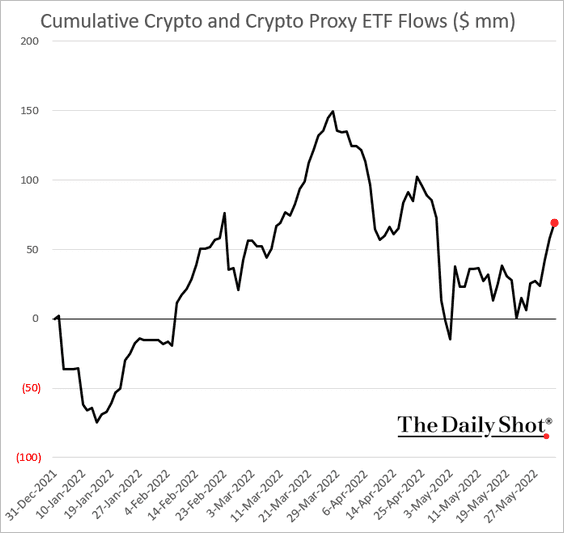
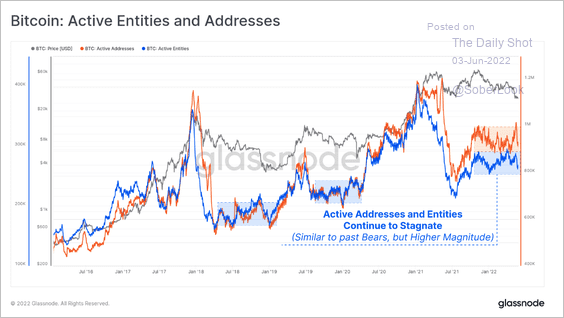
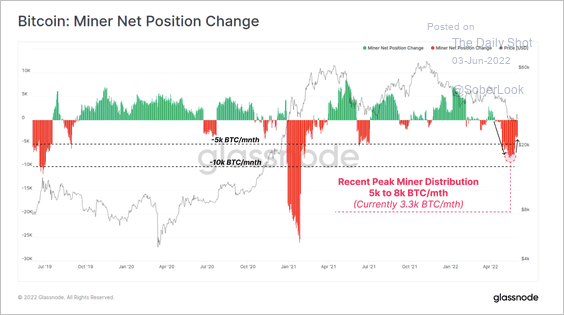
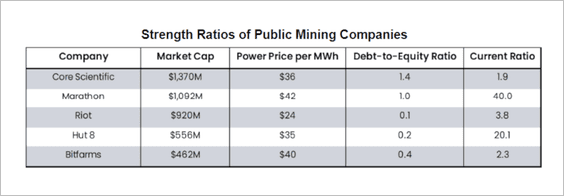
Cryptocurrency
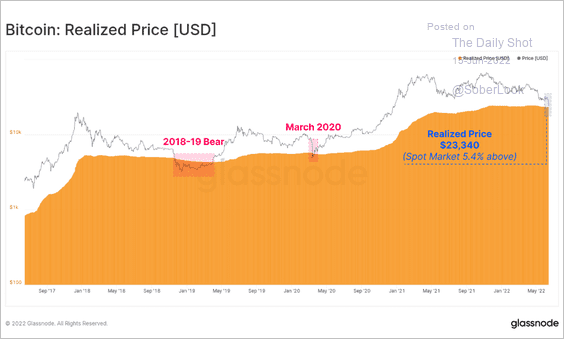
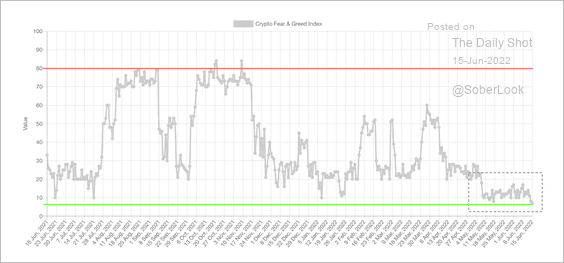
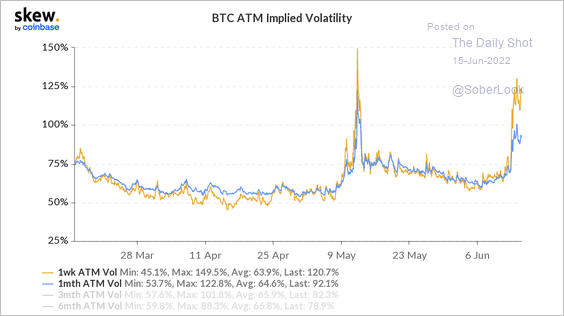
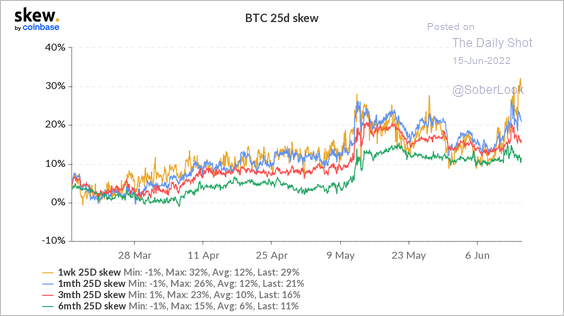
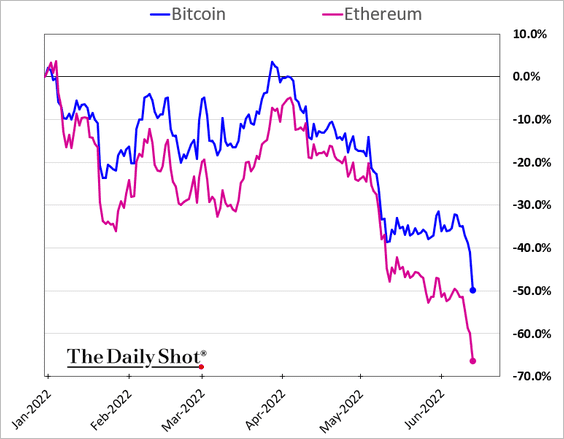
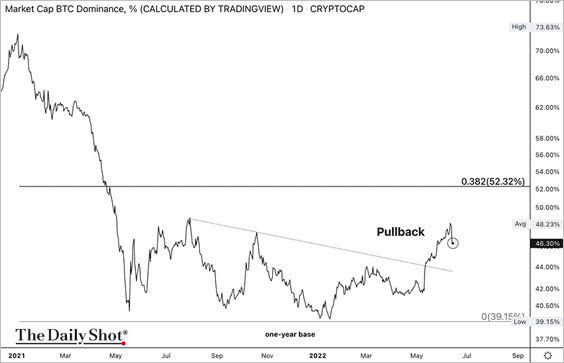
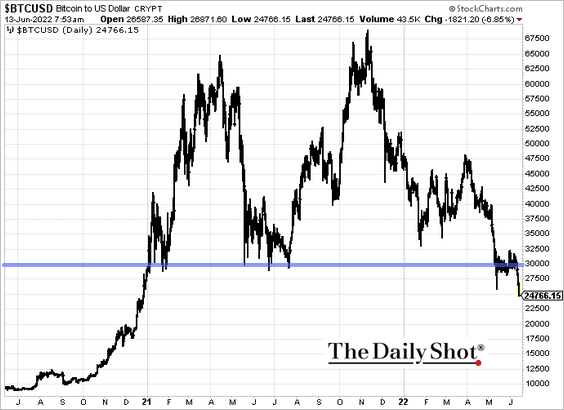
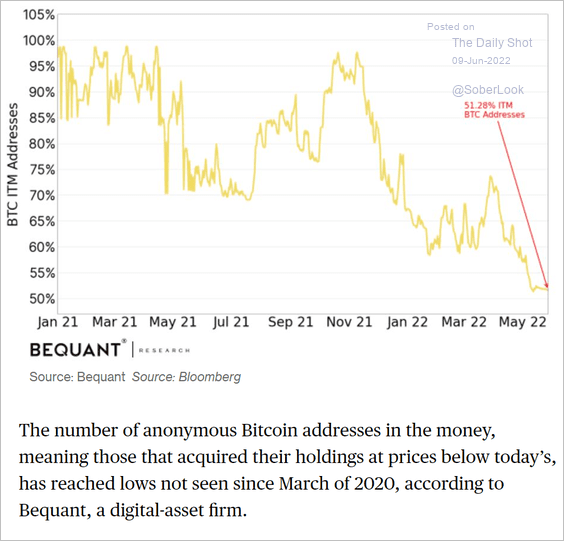
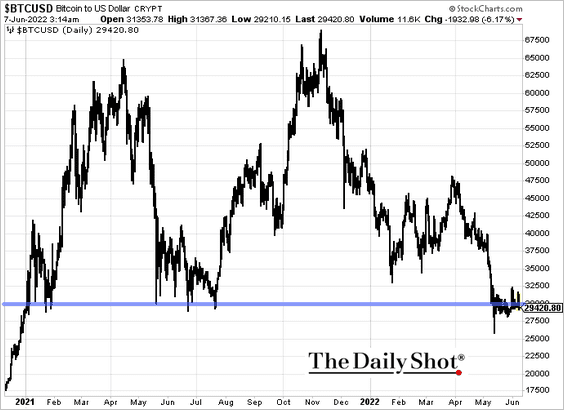
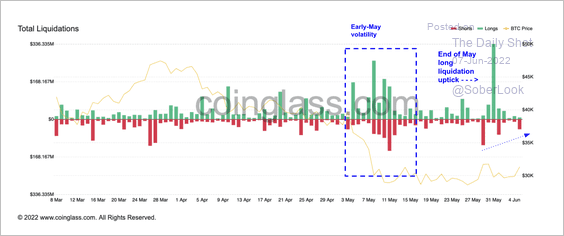
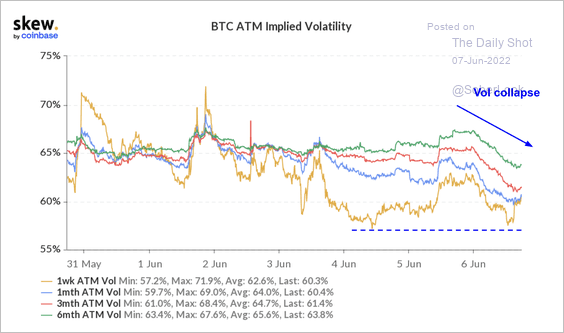
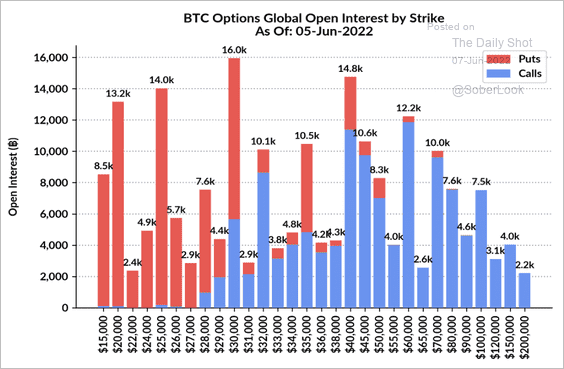
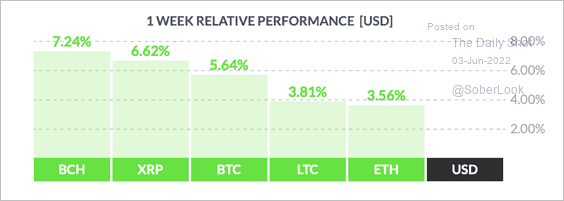
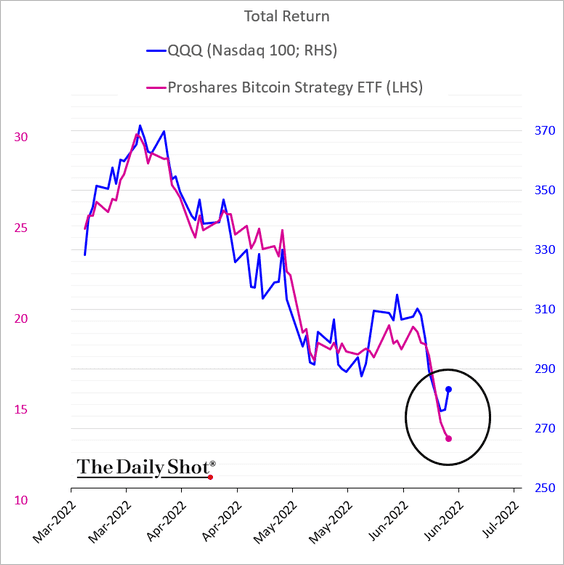
1. Bitcoin held support at $20k, …
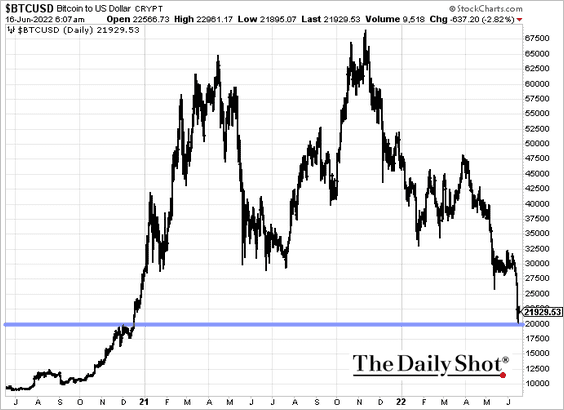
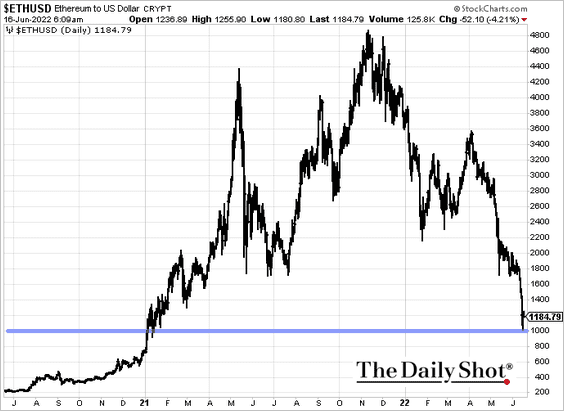
… and ether’s crash was stopped at $1,000. Cryptos could face further headwinds as central banks remove accommodation.
——————–
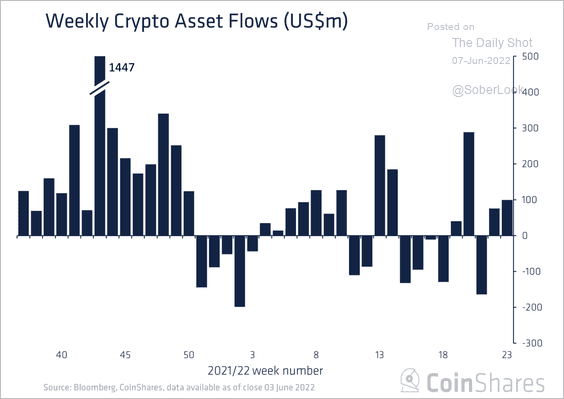
2. Bitcoin decoupled from stocks this week.
3. Here are the public companies with the highest bitcoin holdings on their balance sheets.
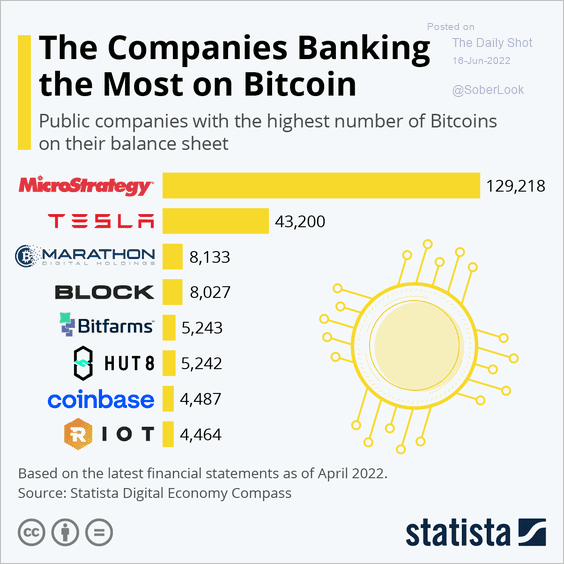 Source: Statista
Back to Index
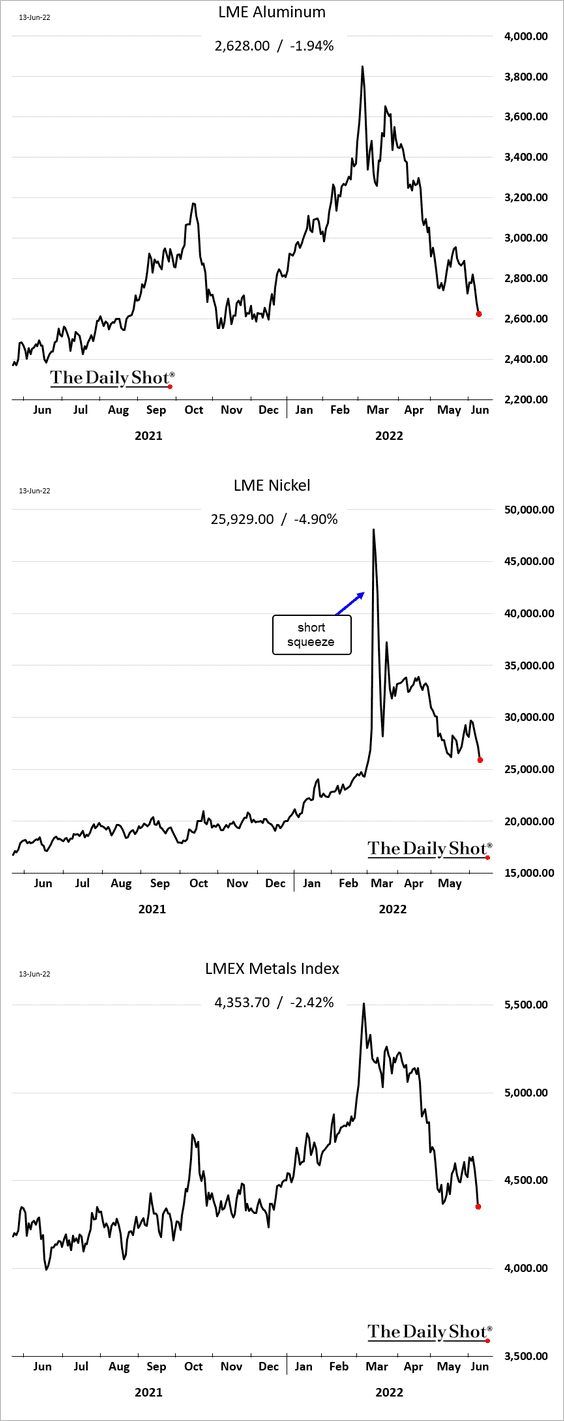
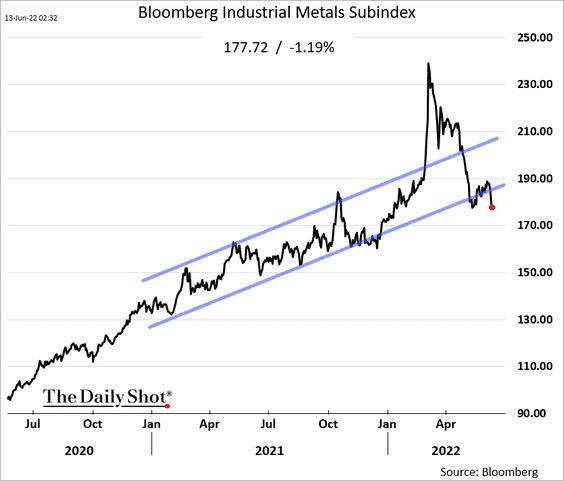
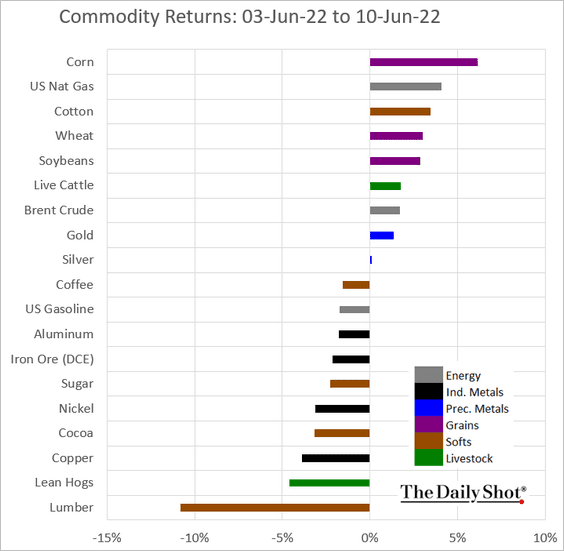
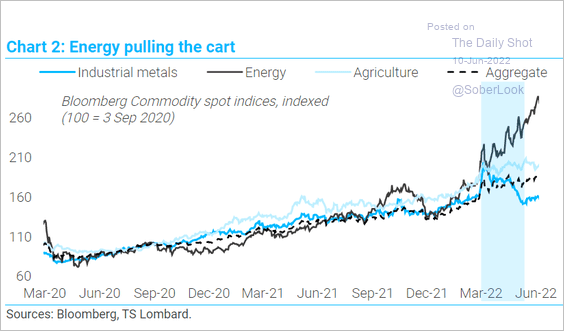
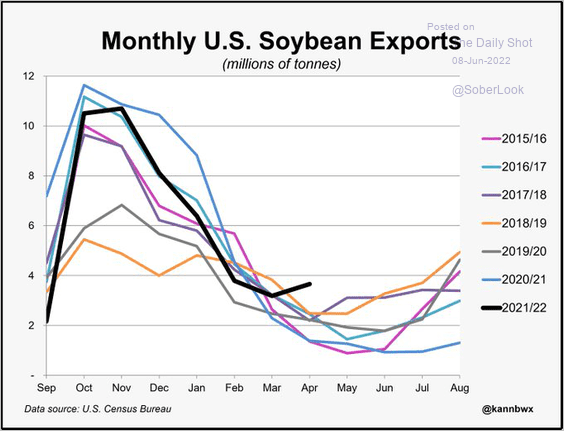
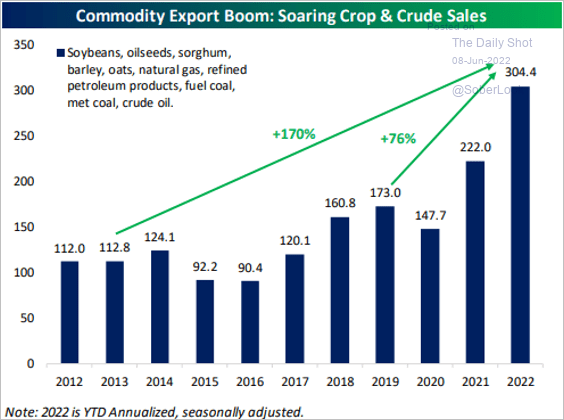
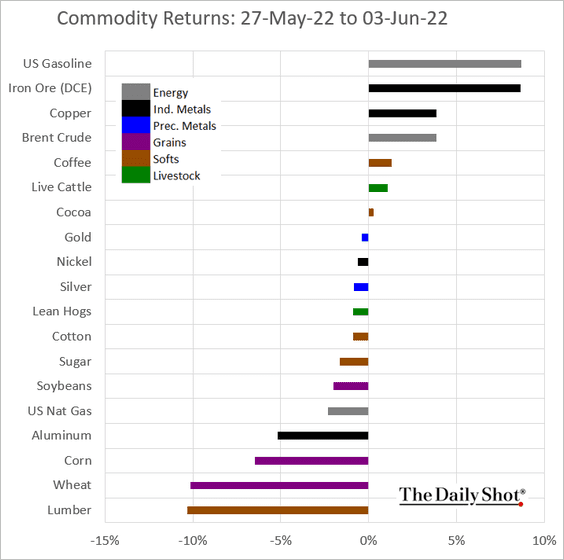
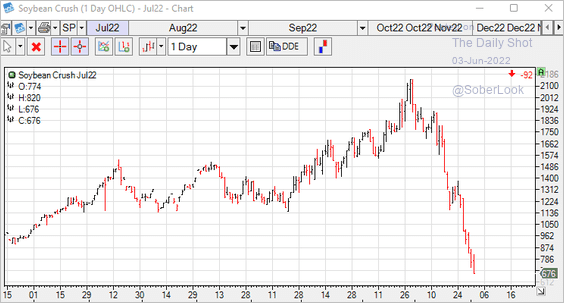
Commodities
1. China’s share of global lithium demand is expected to rise, which should boost production.
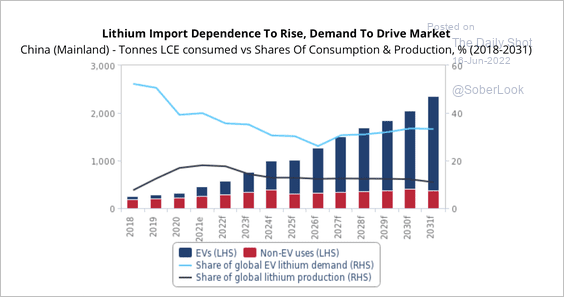 Source: Fitch Solutions Macro Research
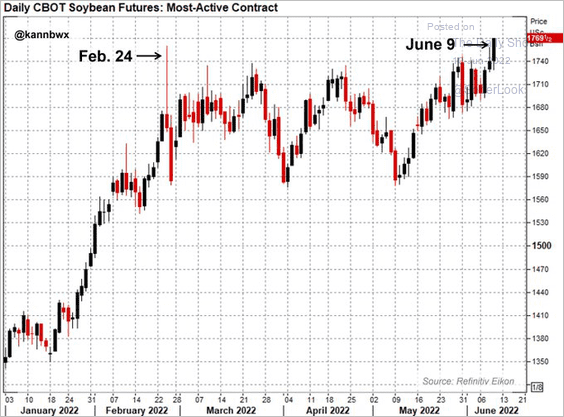
2. Have agricultural commodity prices peaked? Here is a forecast from Capital Economics.
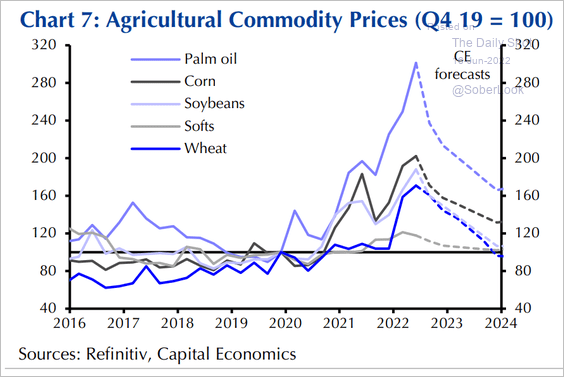 Source: Capital Economics
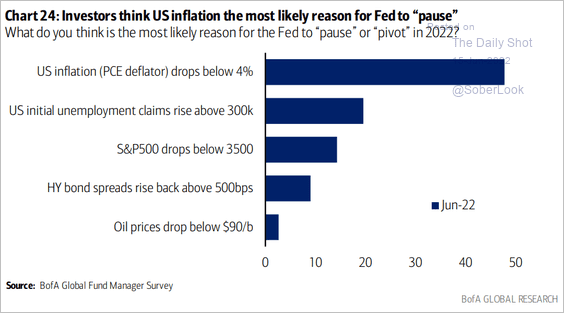
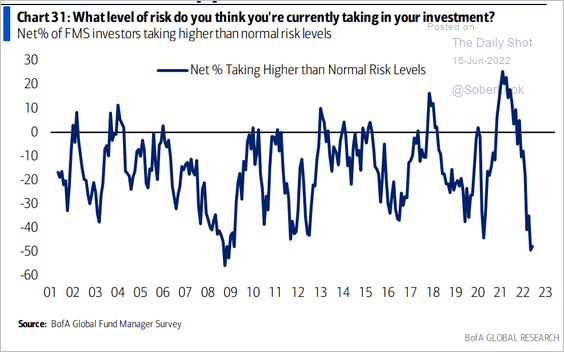
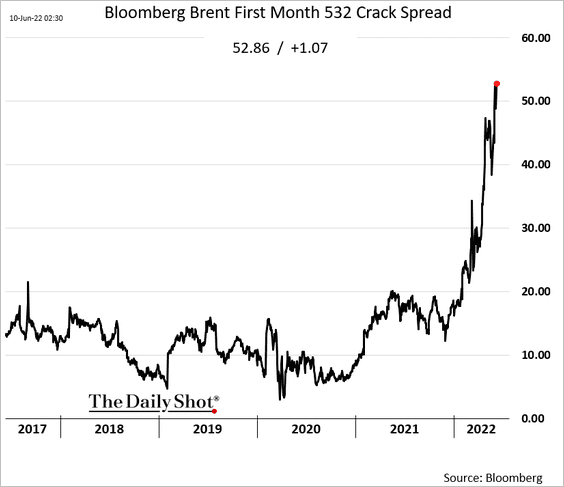
3. Fund managers now see long commodities/oil as the most crowded trade.
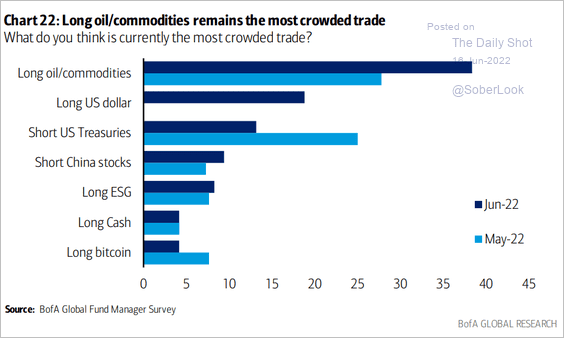 Source: BofA Global Research
Back to Index
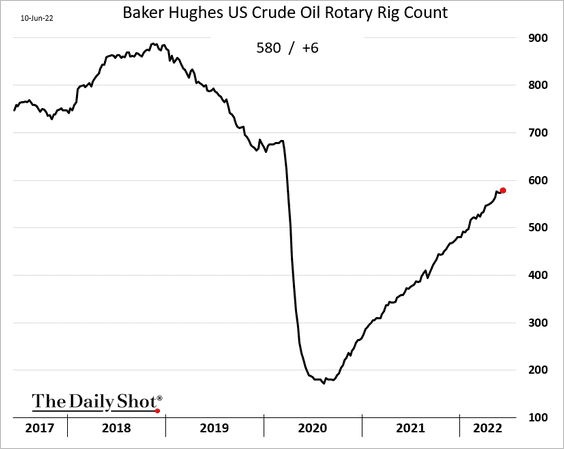
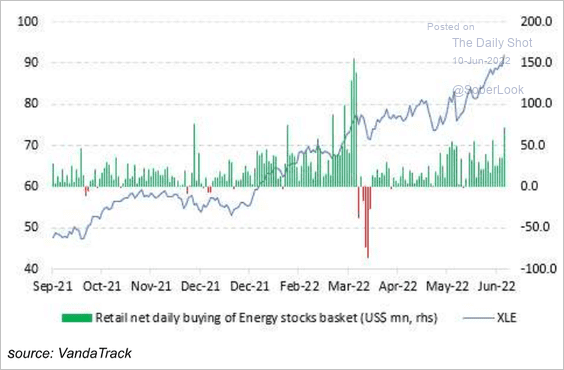
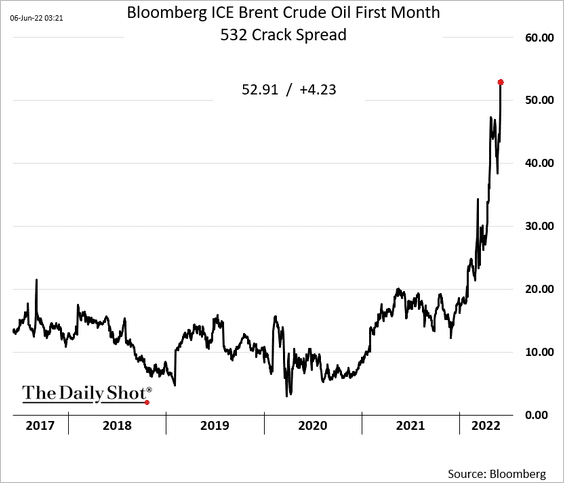
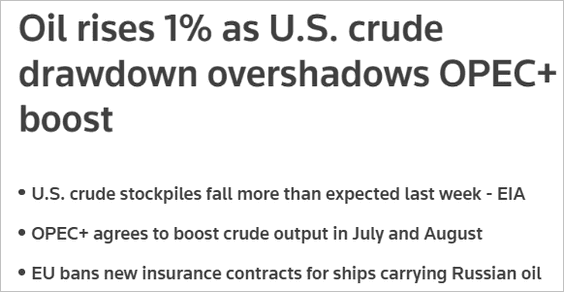
Energy
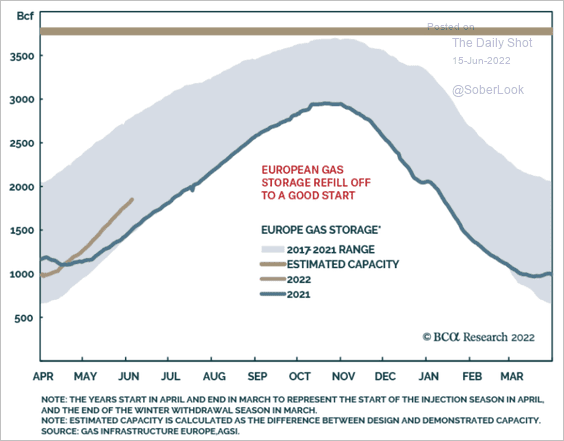
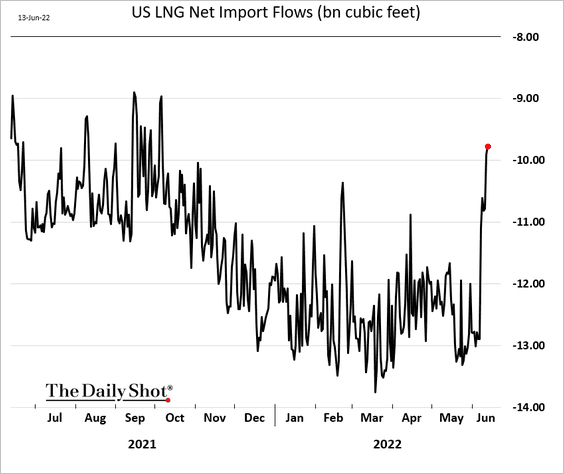
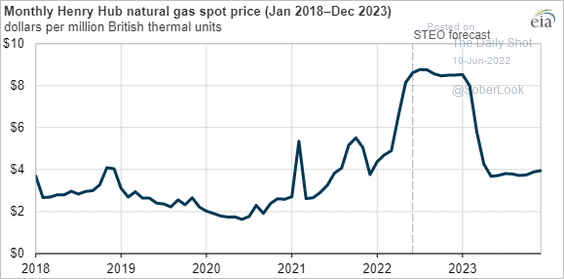
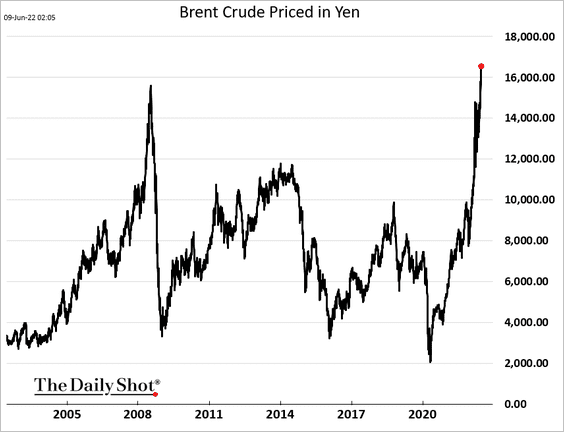
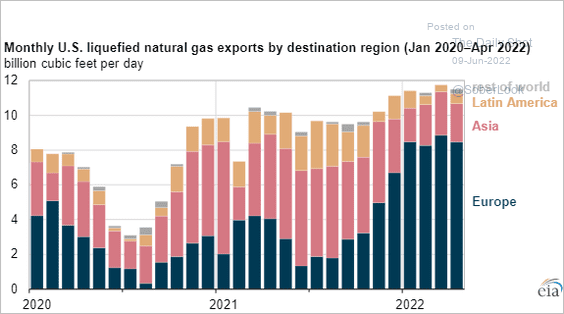
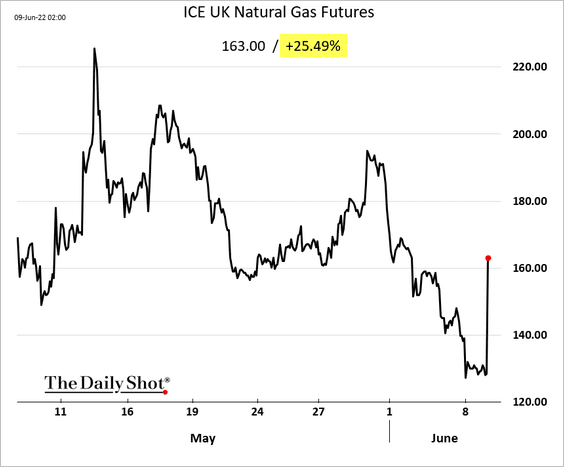
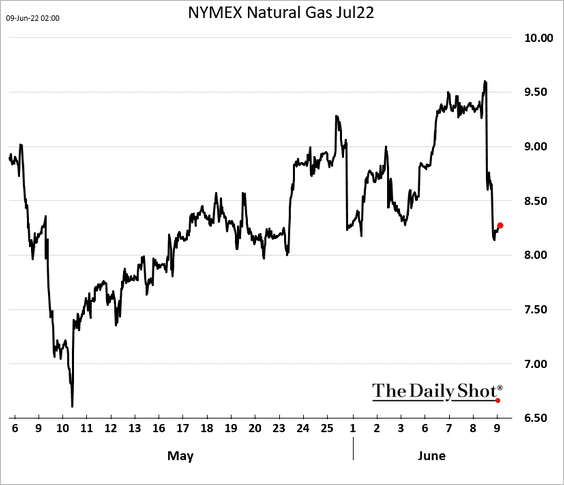
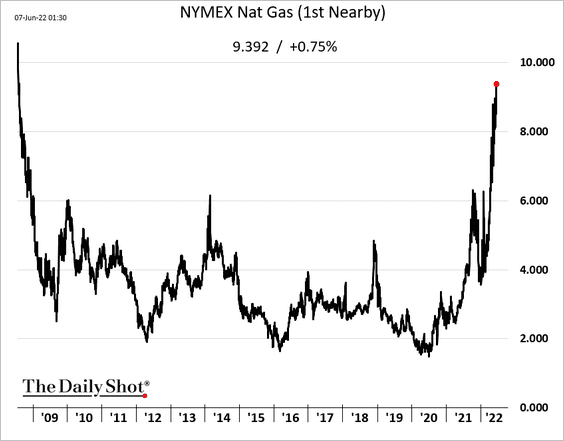
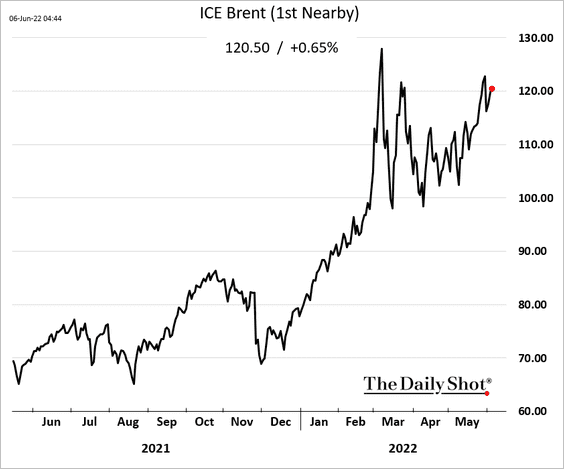
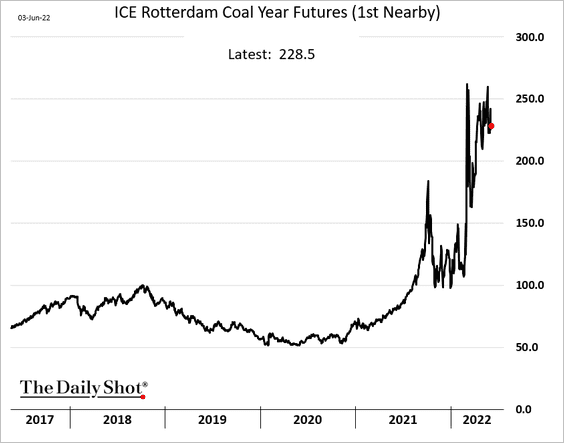
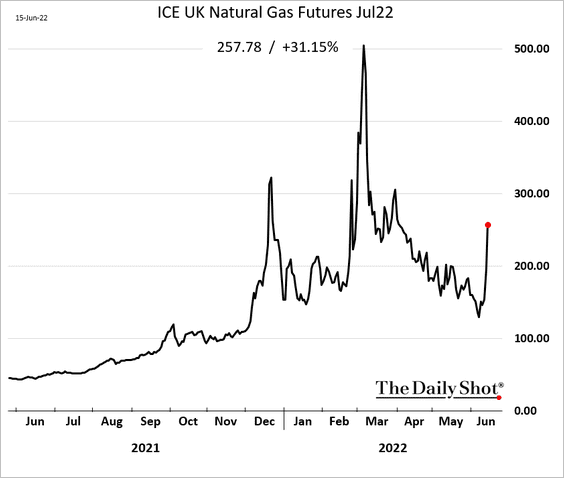
1. Russia is taking advantage of the US LNG outage by tightening natural gas supplies to Europe. Prices surged.
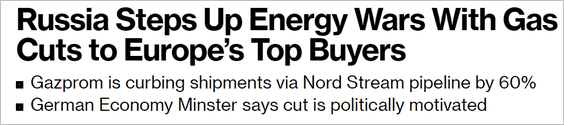 Source: @markets Read full article
——————–
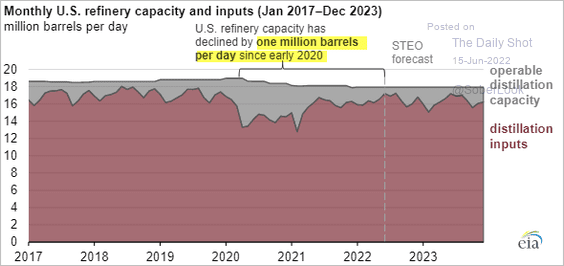
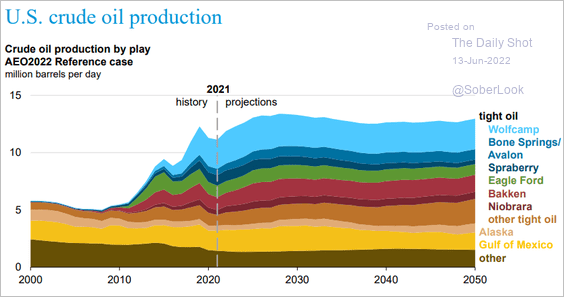
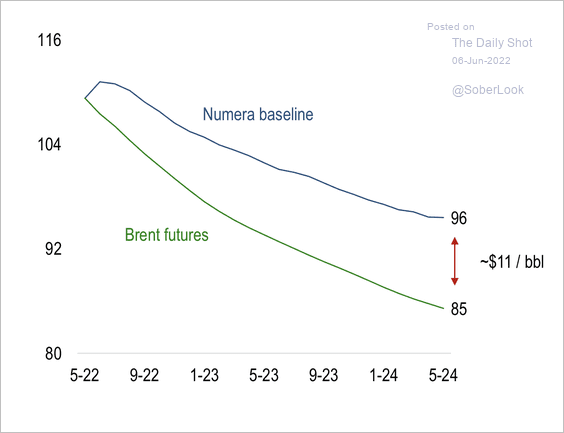
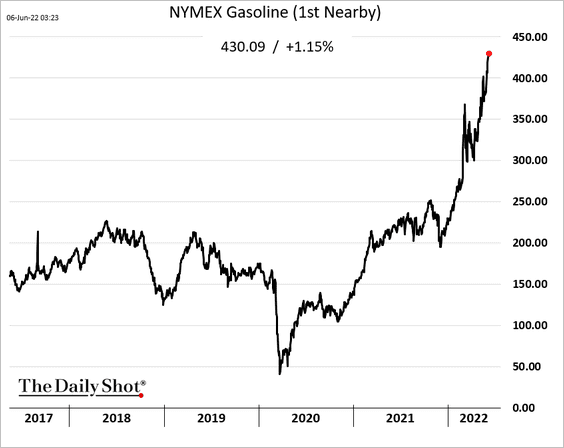
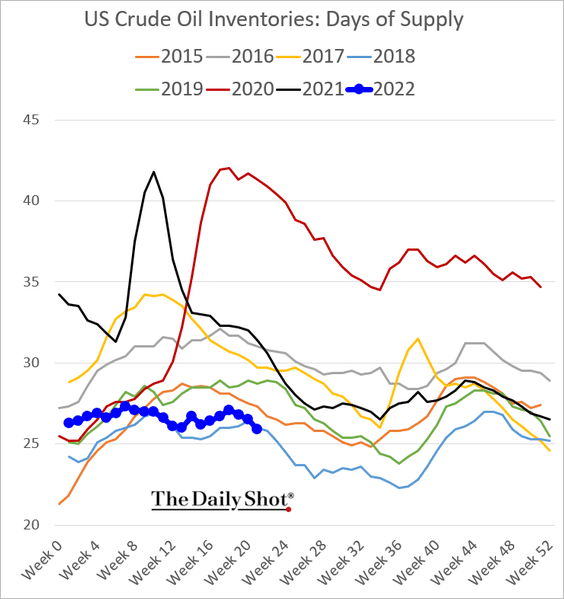
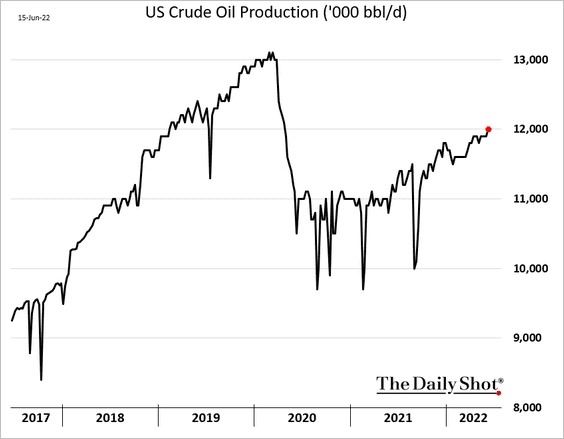
2. US crude oil production finally reached 12 million barrels/day last week (still 1 million bbl/d below the pre-COVID peak).
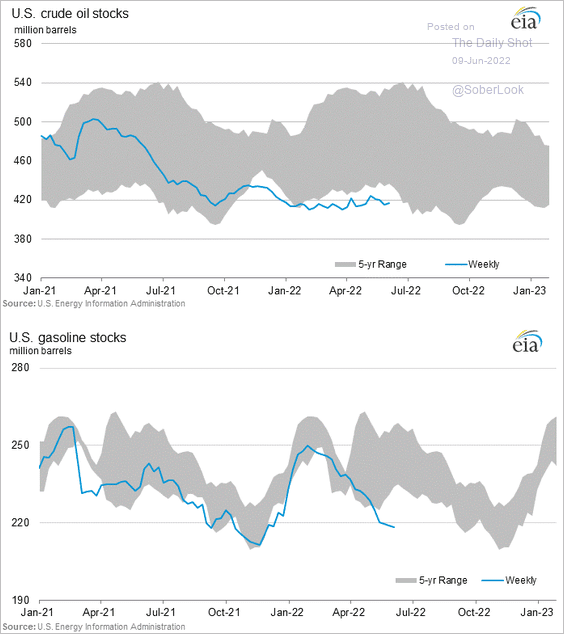
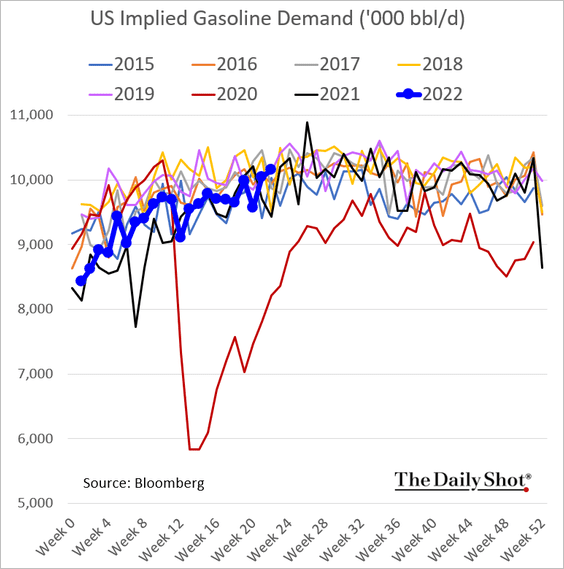
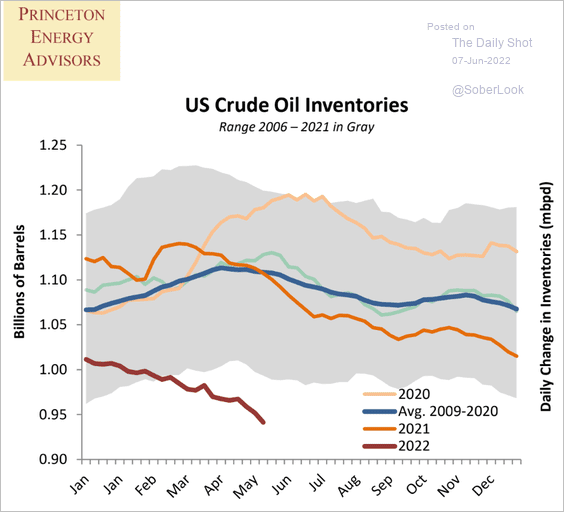
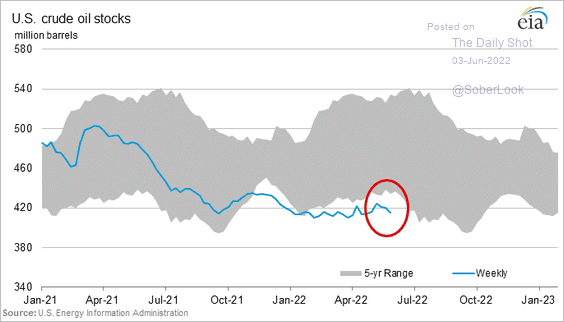
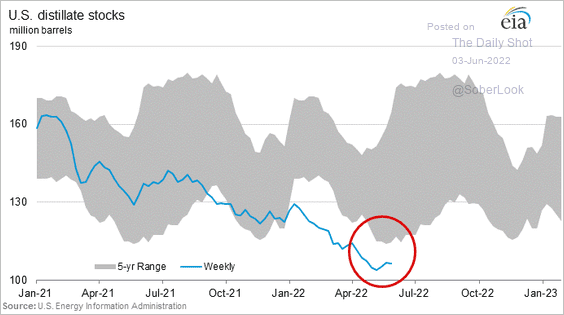
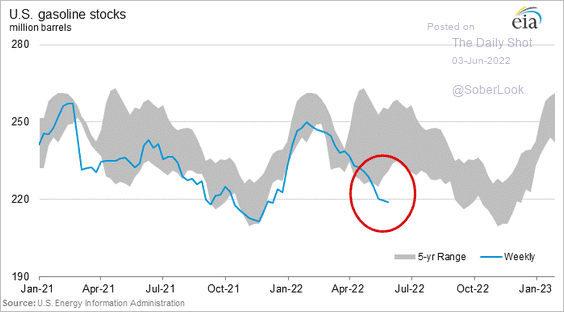
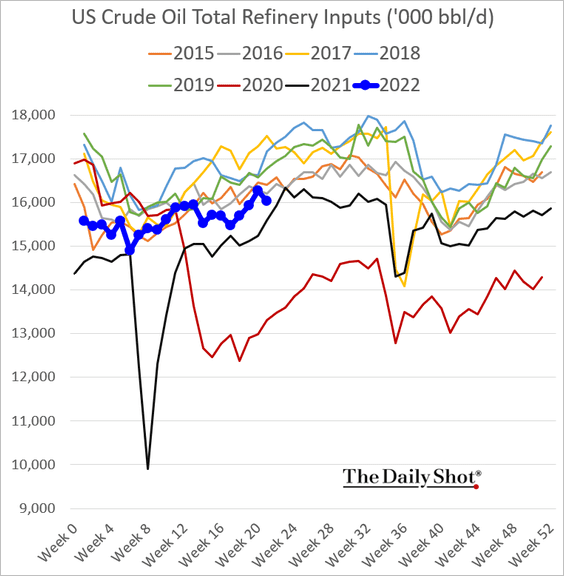
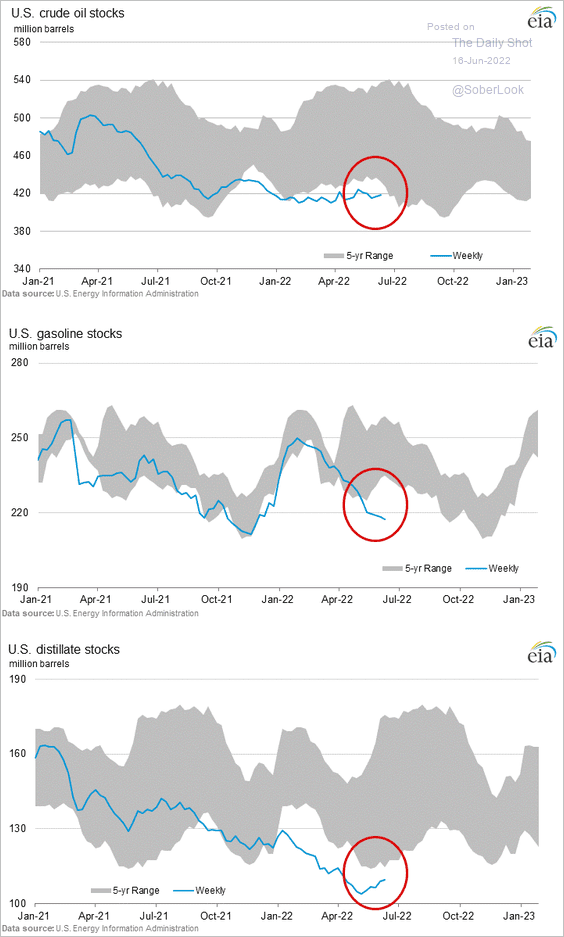
3. US crude oil and distillates inventories showed some improvement, but gasoline stocks continue to plummet.
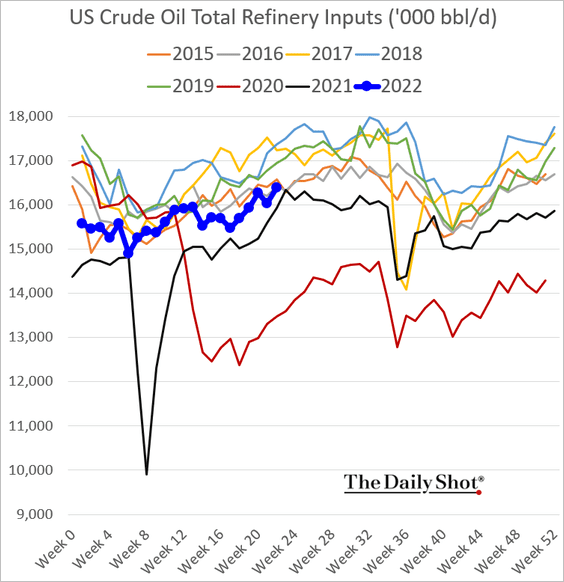
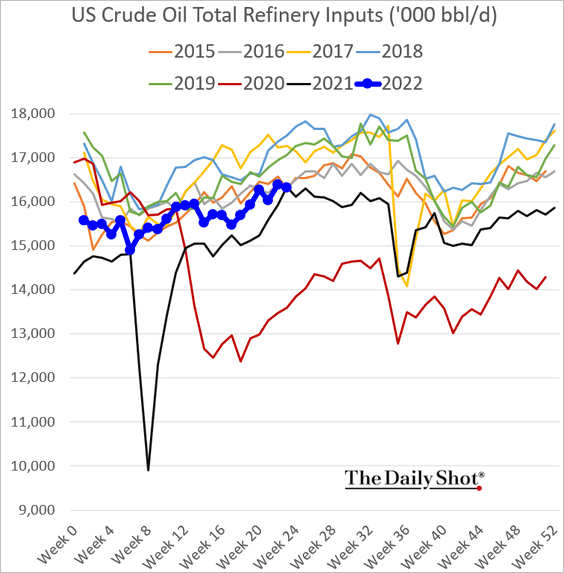
US refinery inputs remain well below pre-COVID levels.
——————–
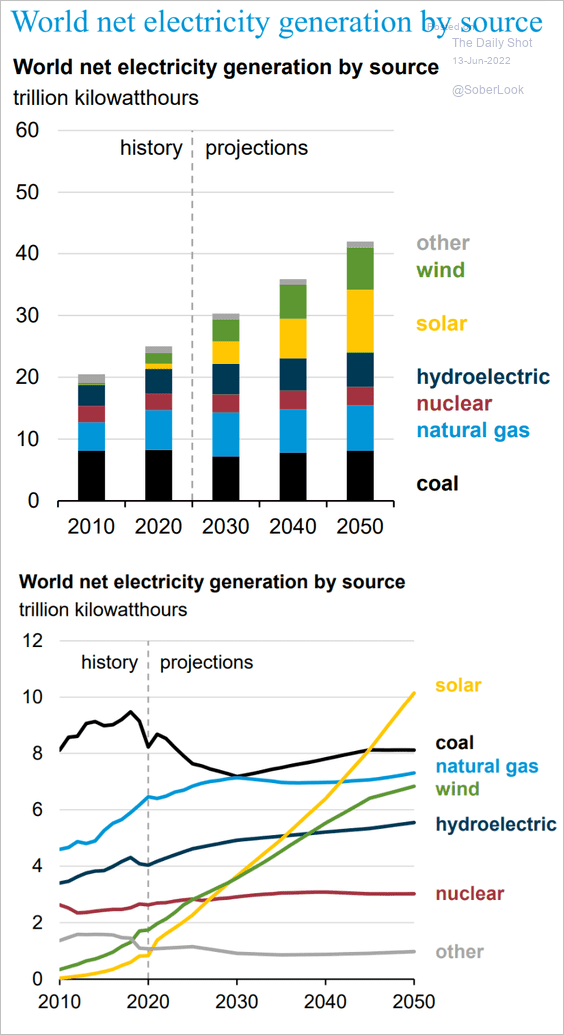
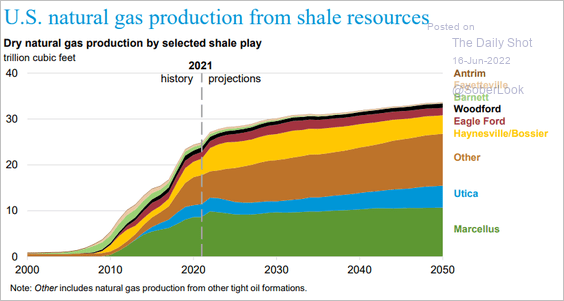
4. This chart shows the EIA’s projections for US shale gas output.
 Source: @EIAgov
Back to Index
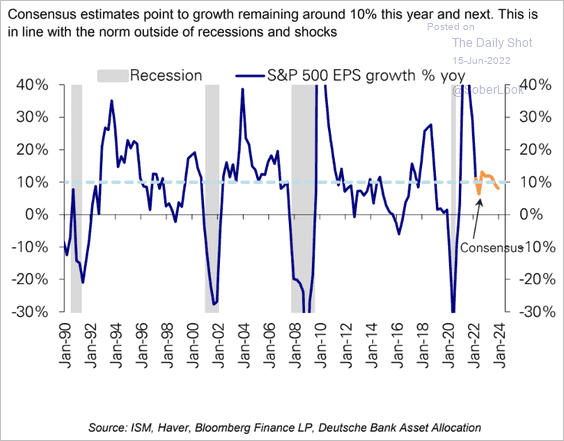
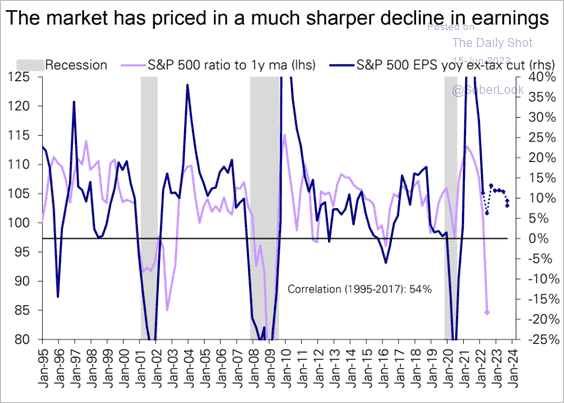
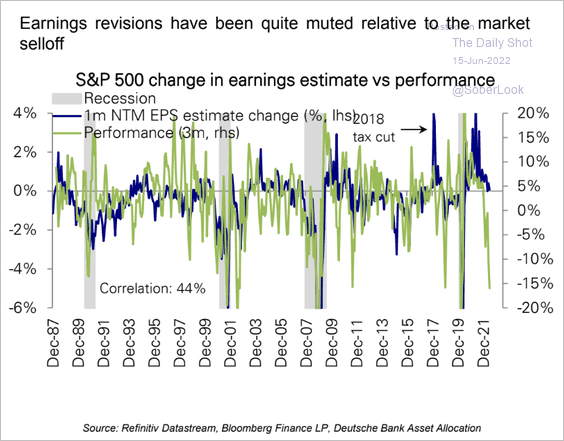
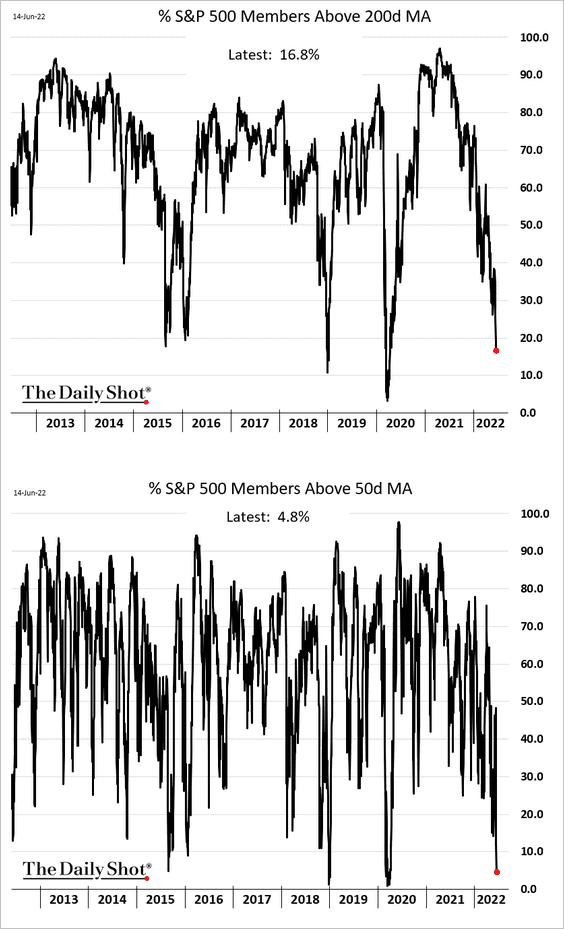
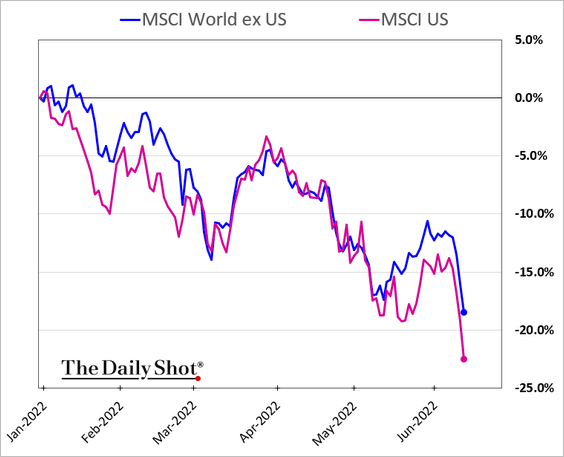
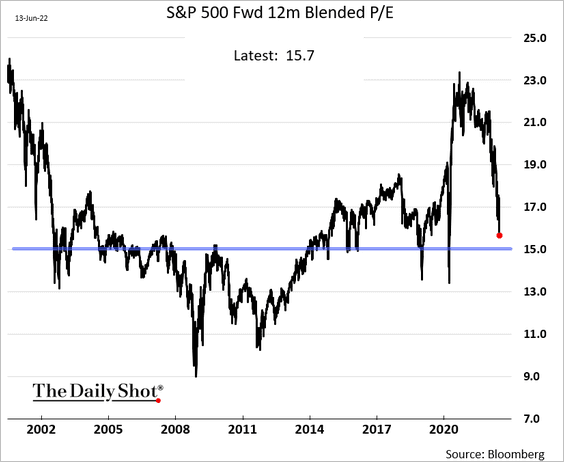
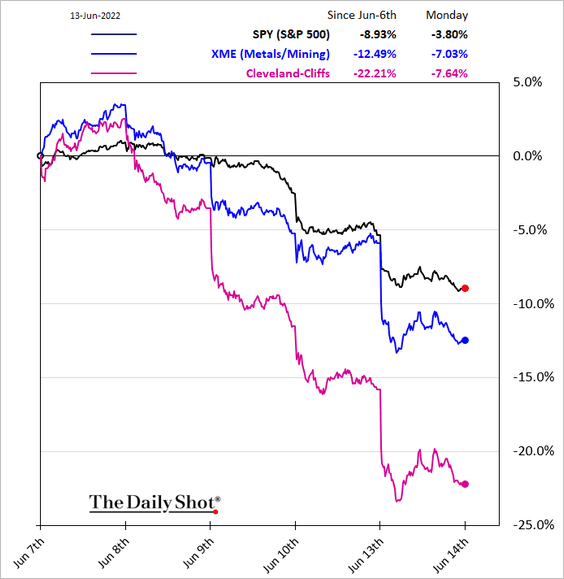
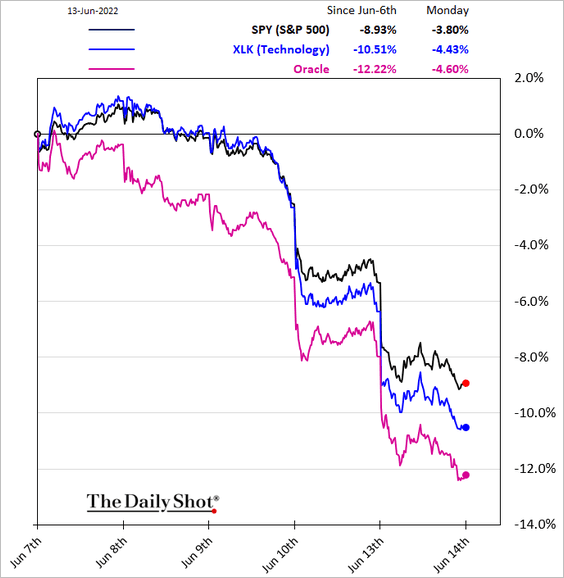
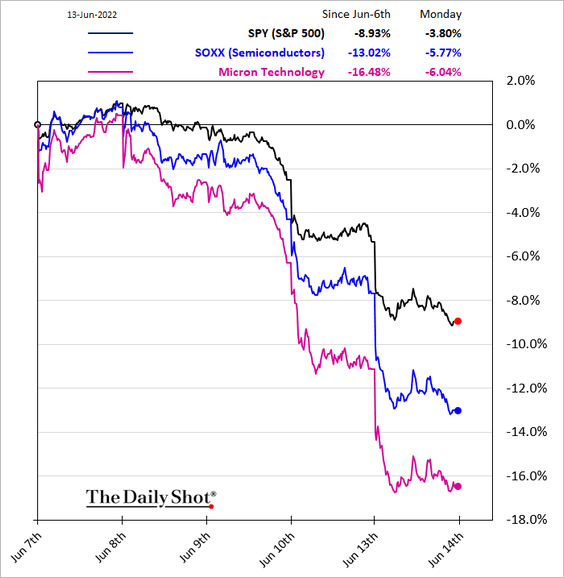
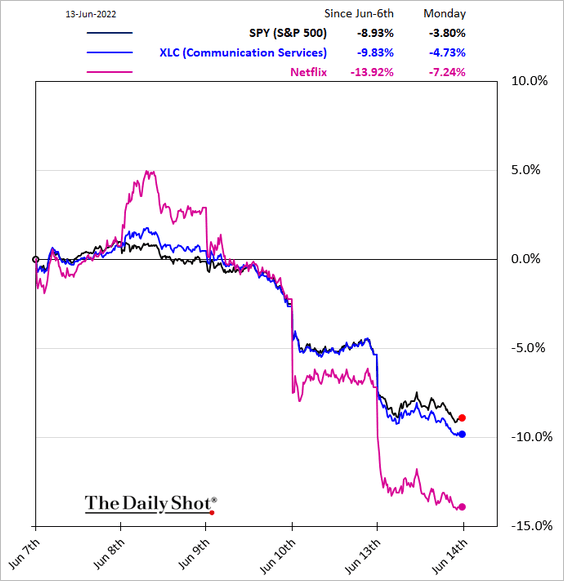
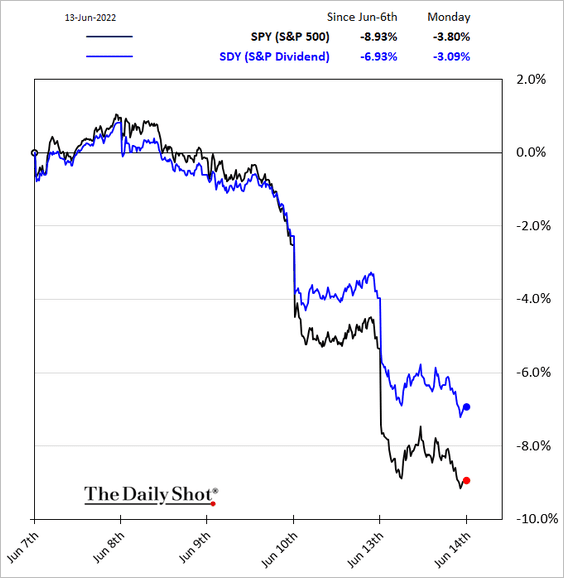
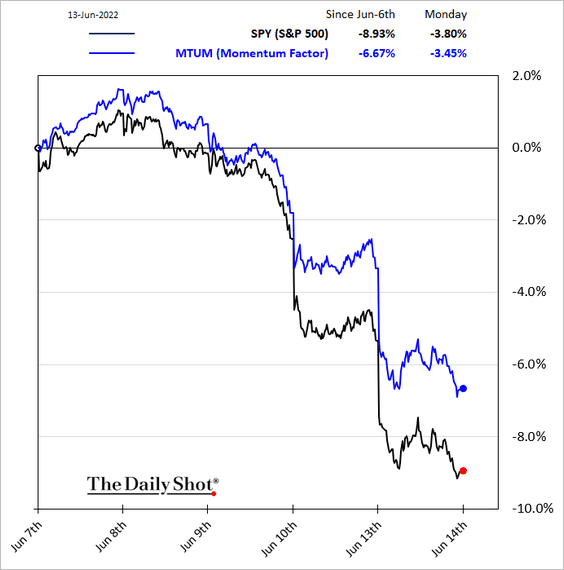
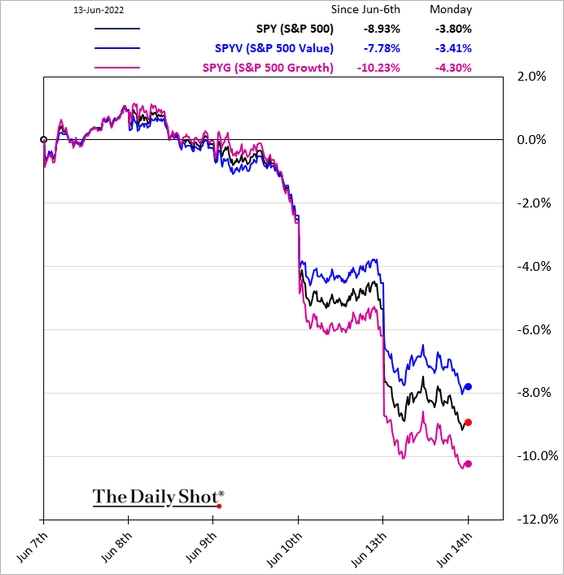
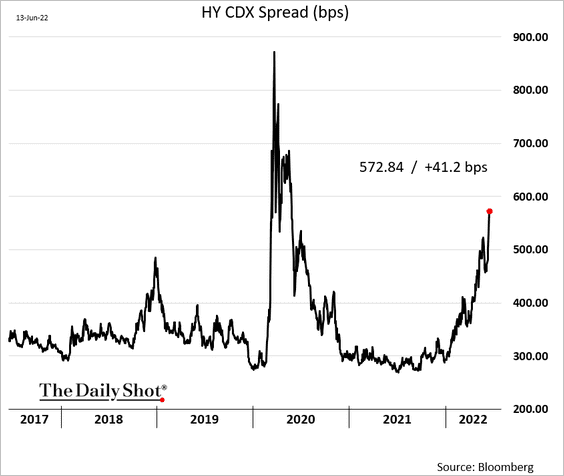
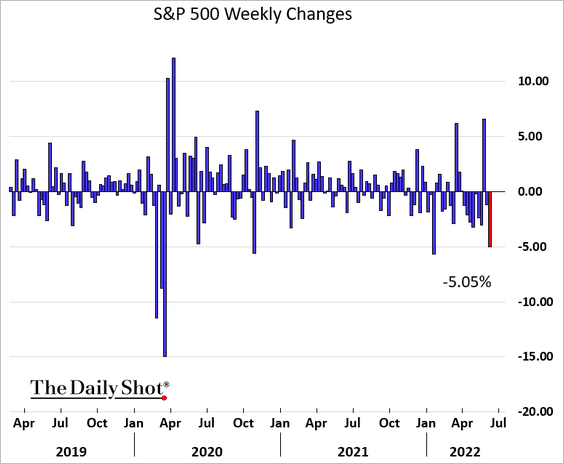
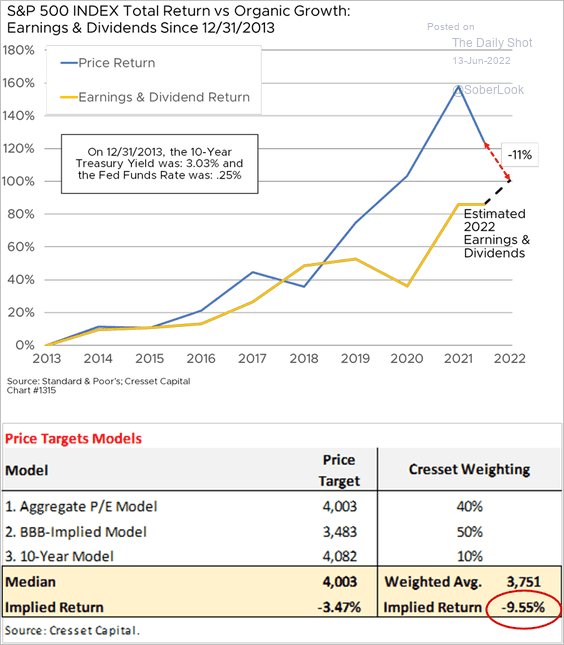
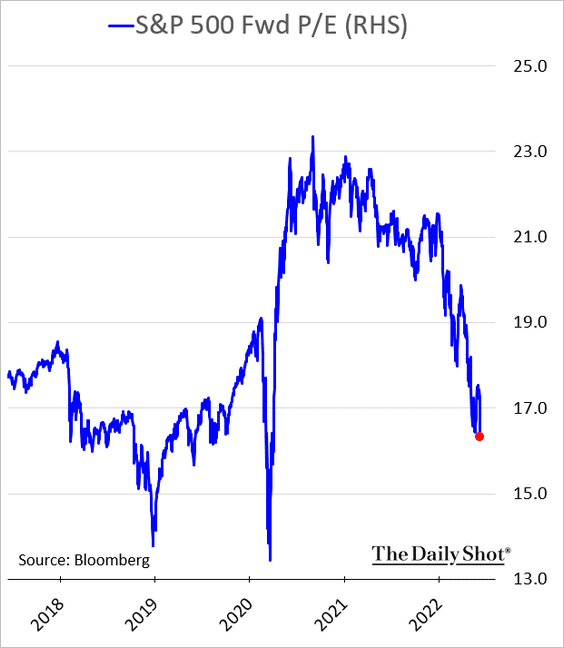
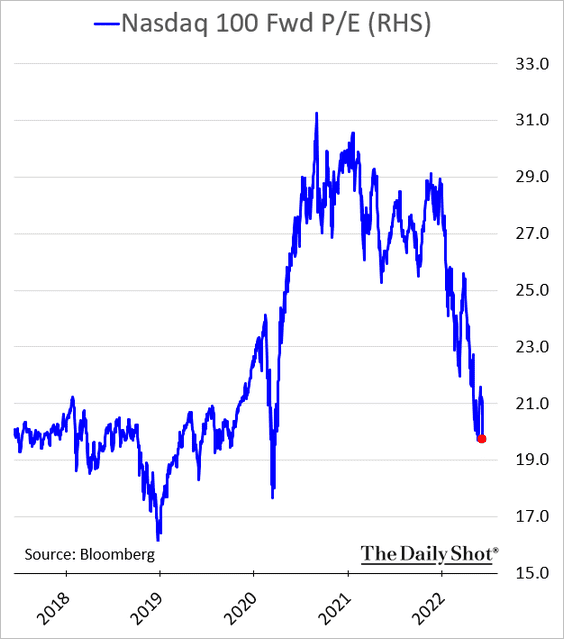
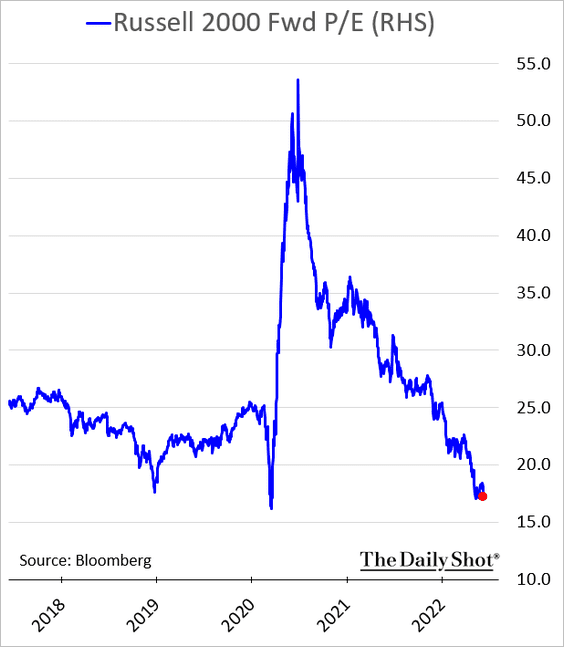
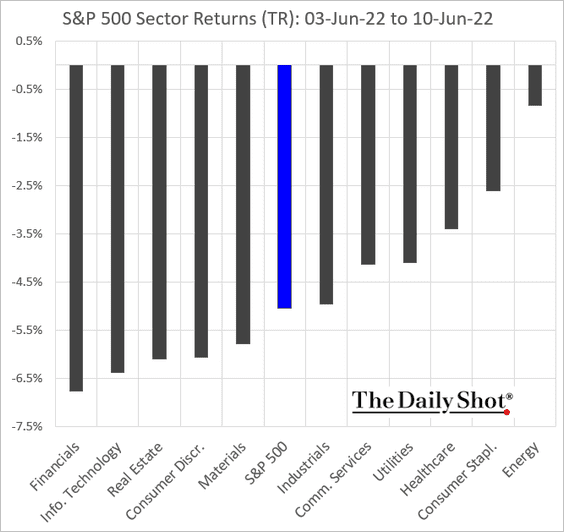
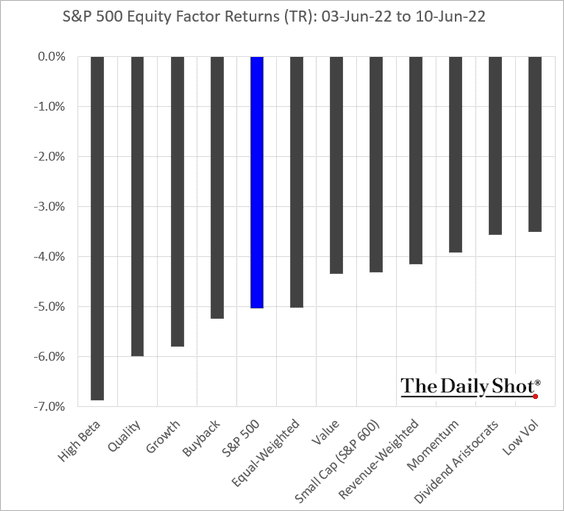
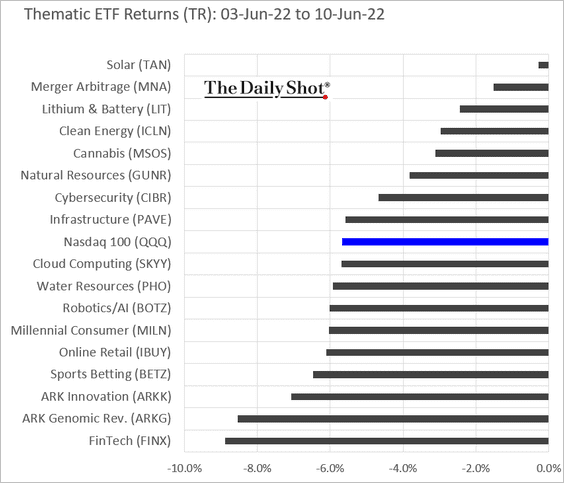
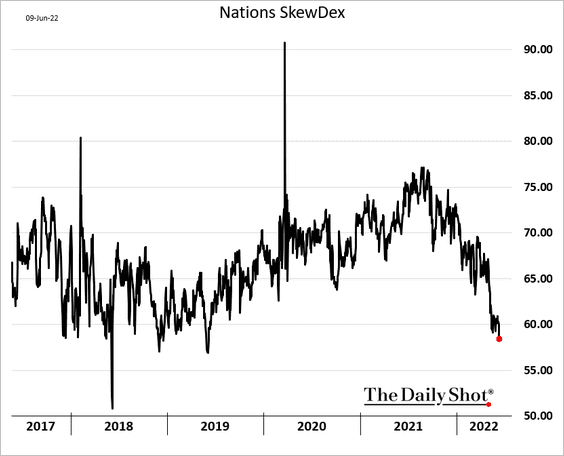
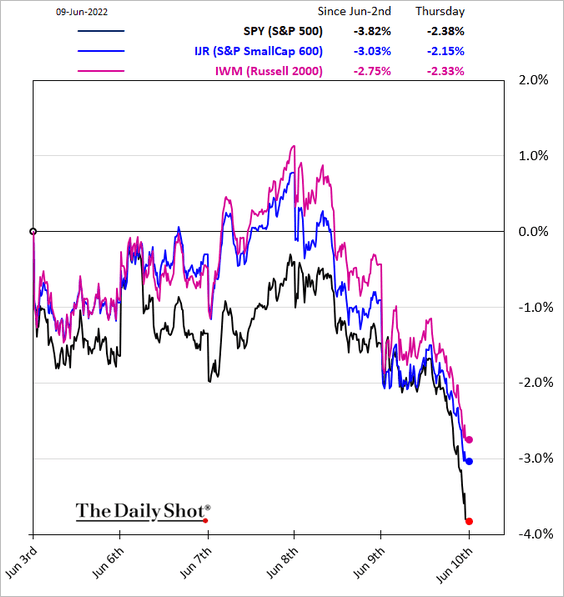
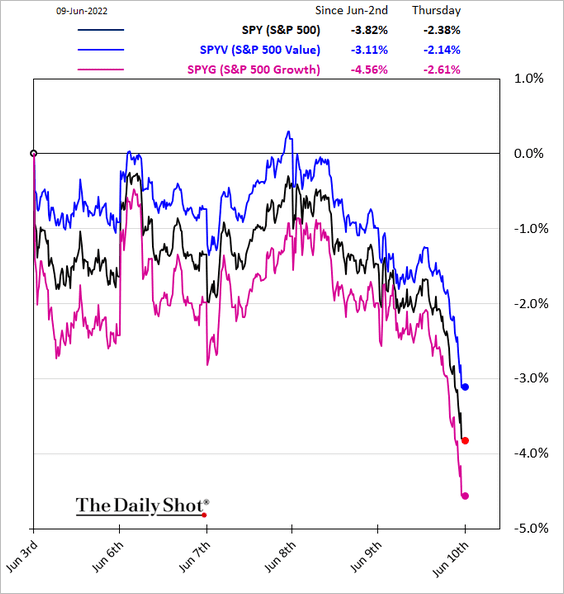
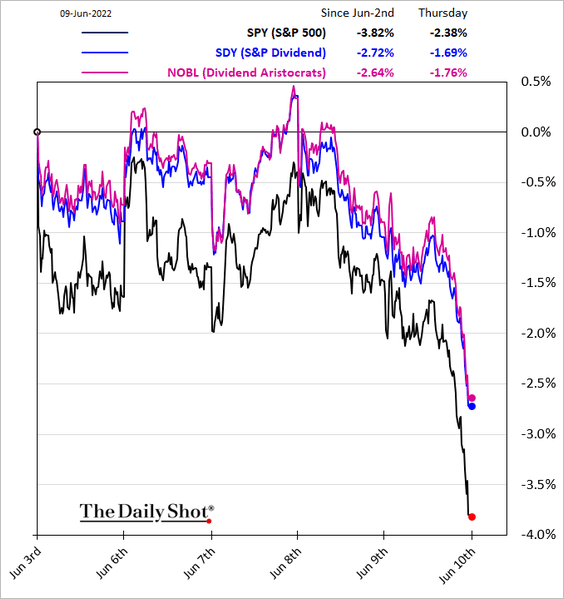
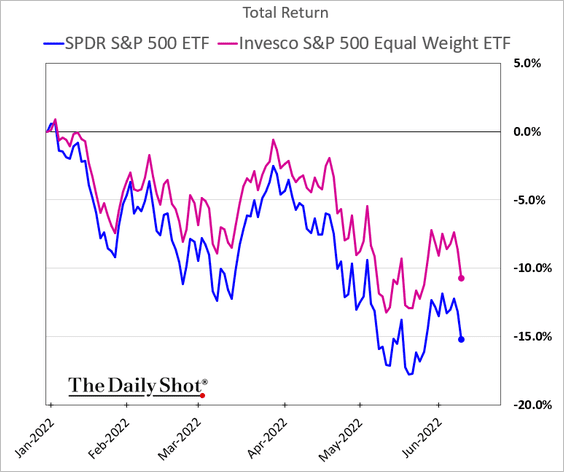
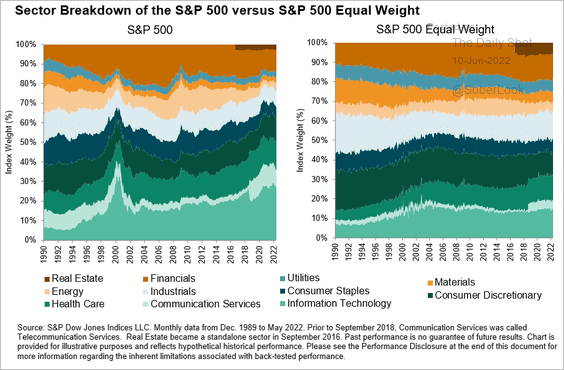
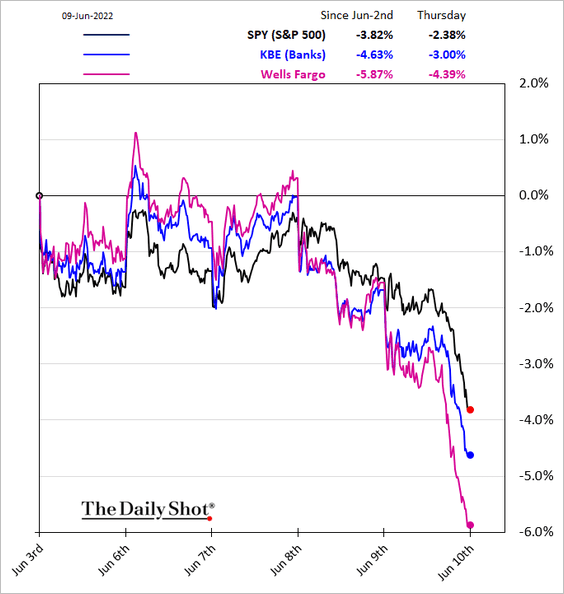
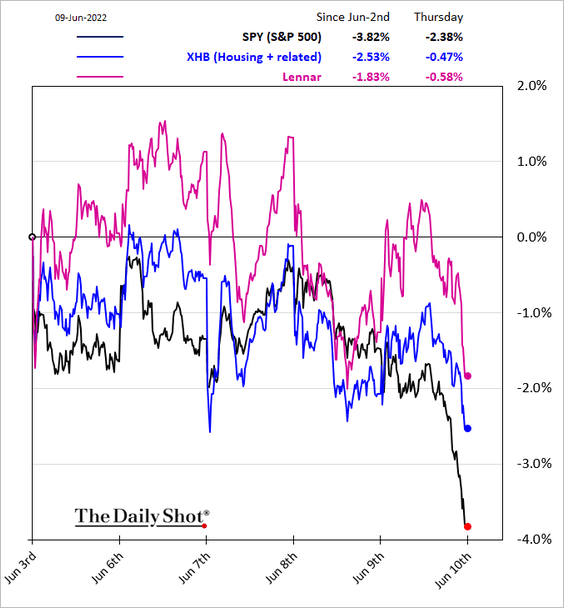
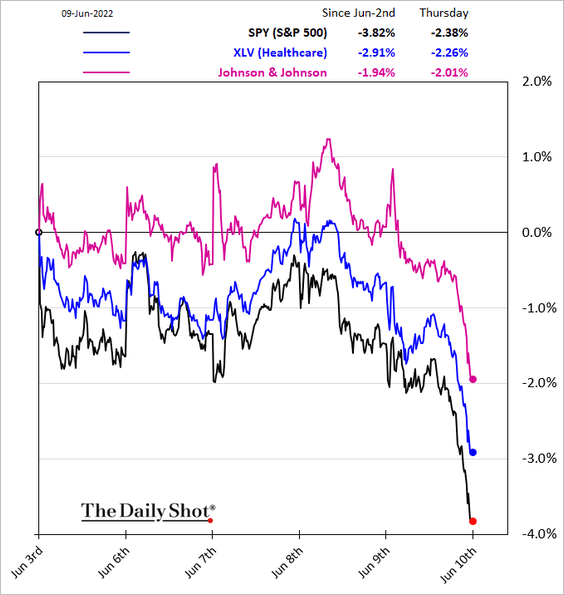
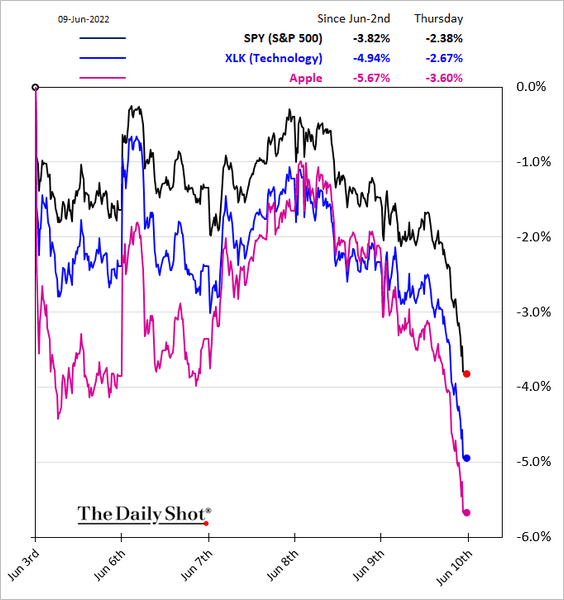
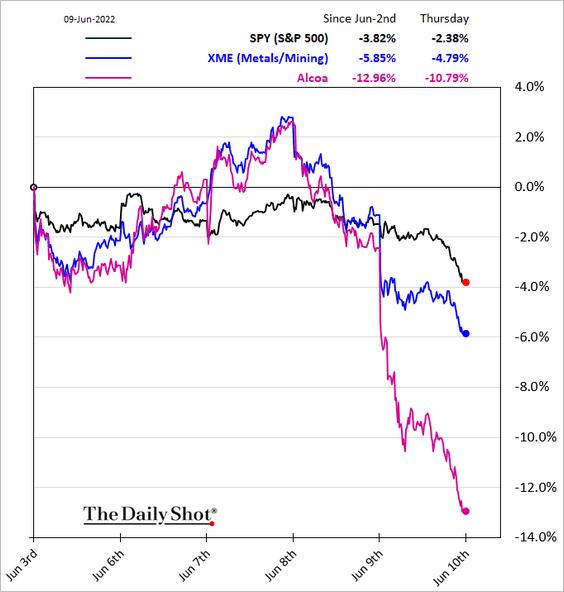
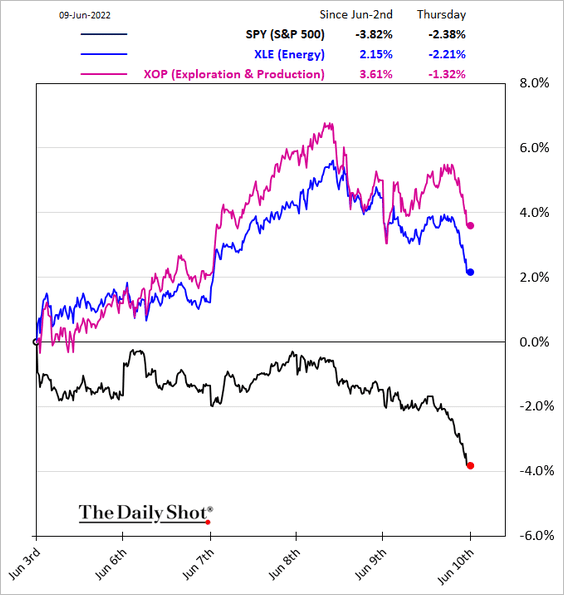
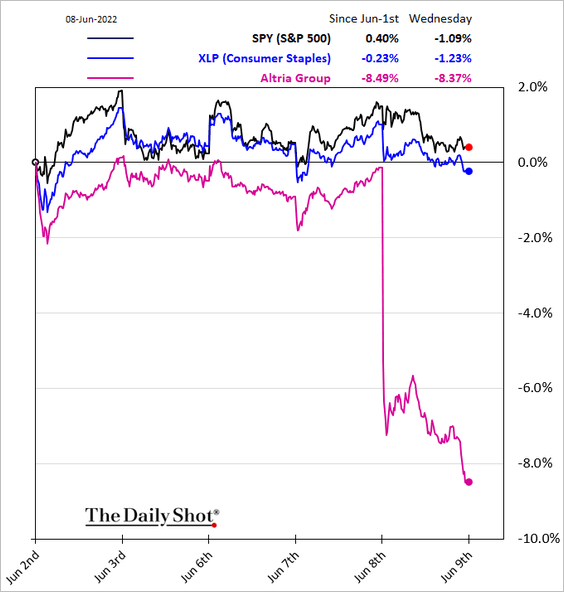
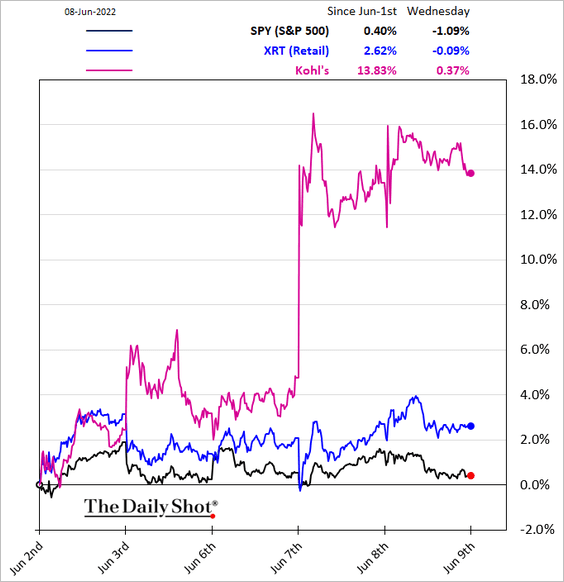
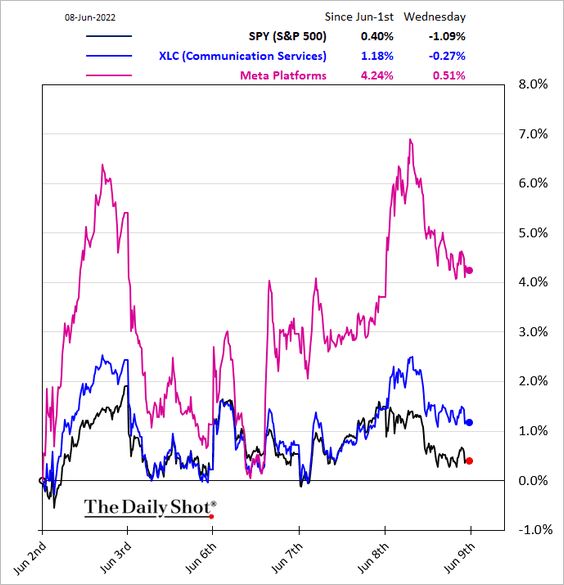
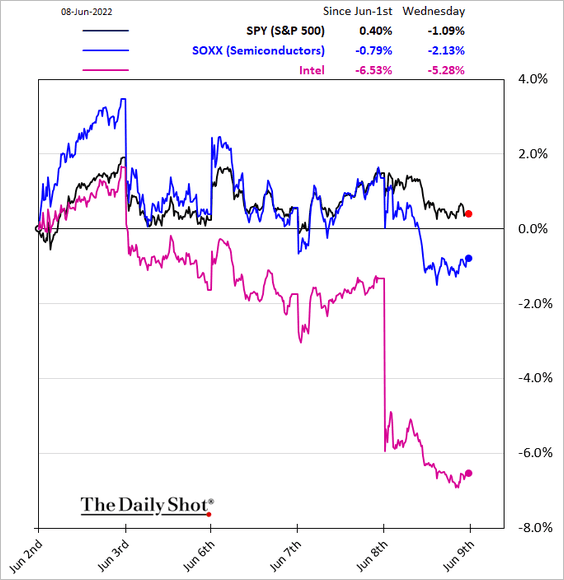
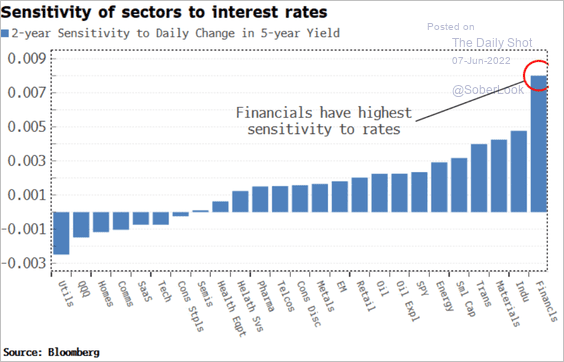
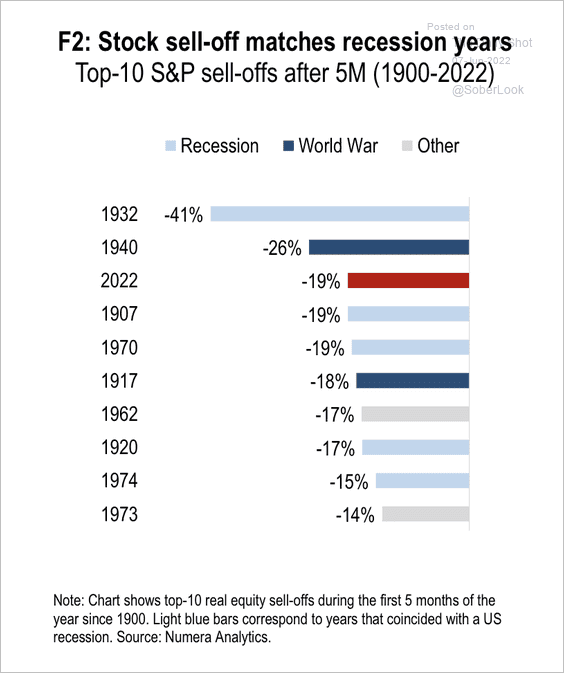
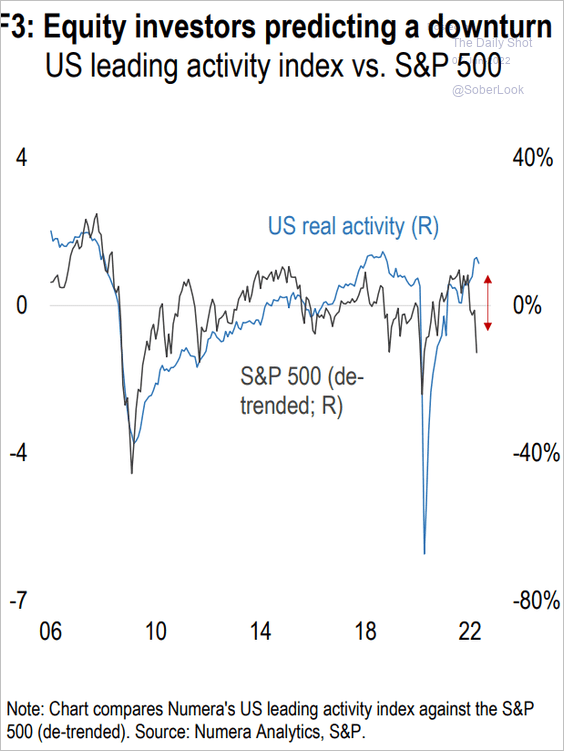
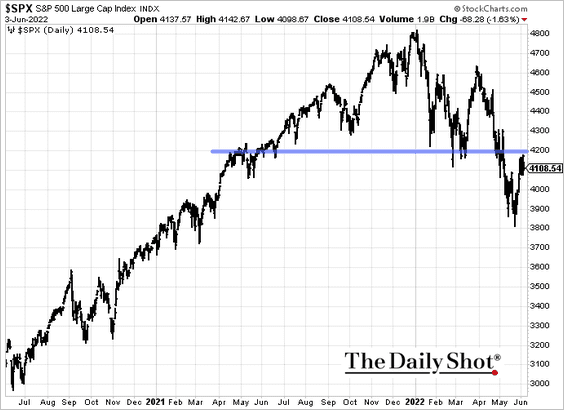
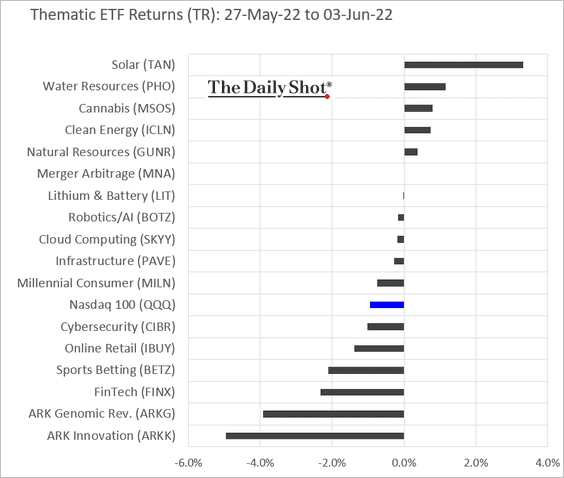
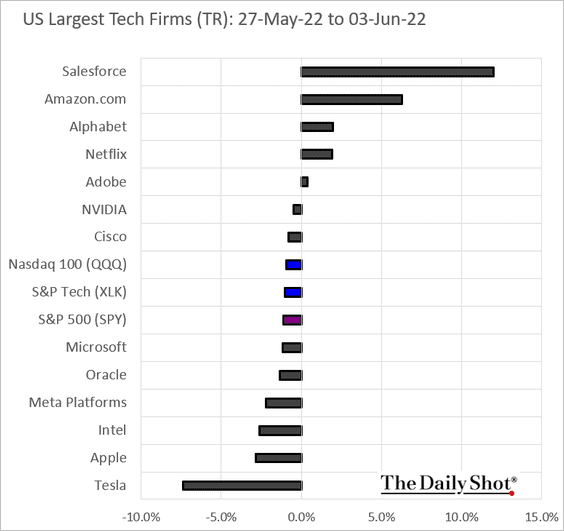
Equities
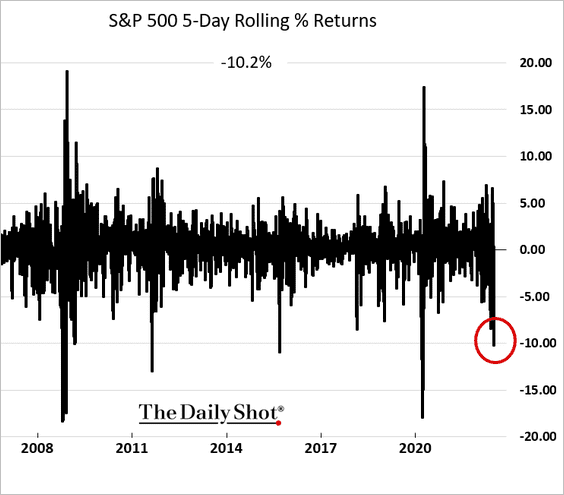
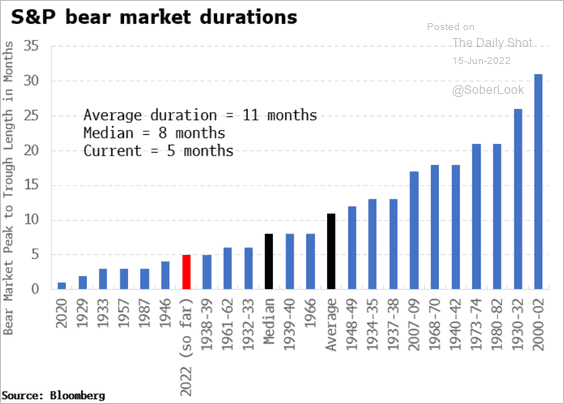
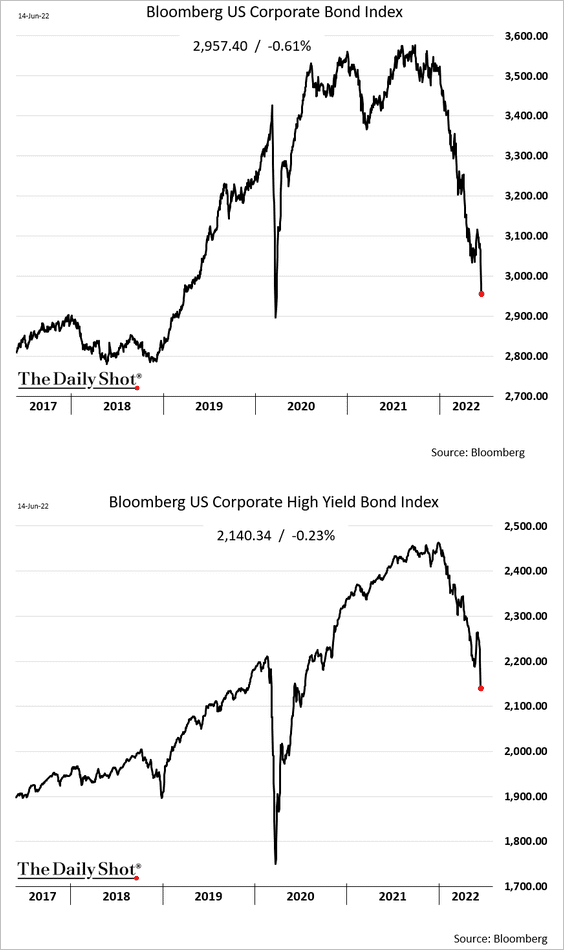
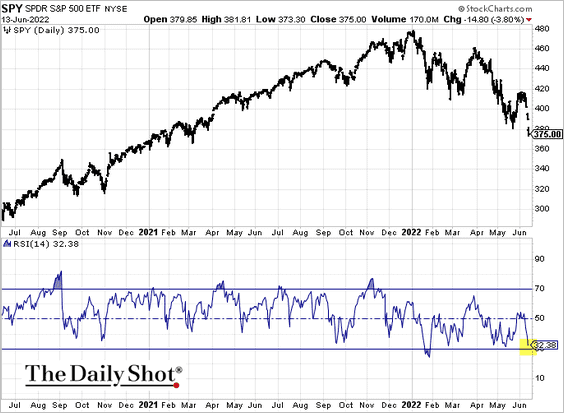
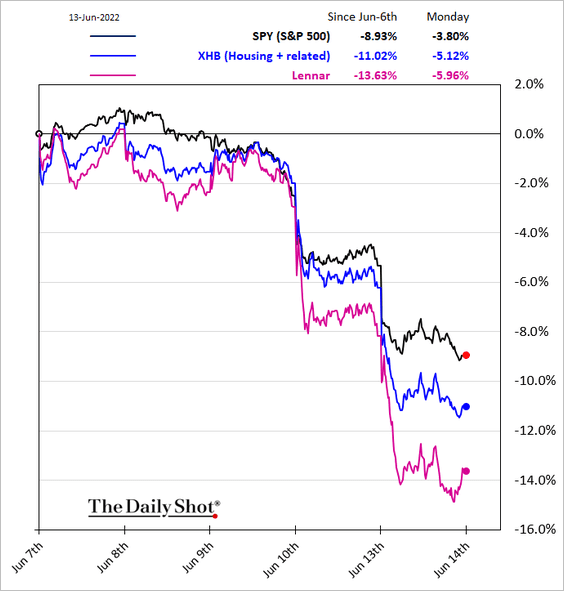
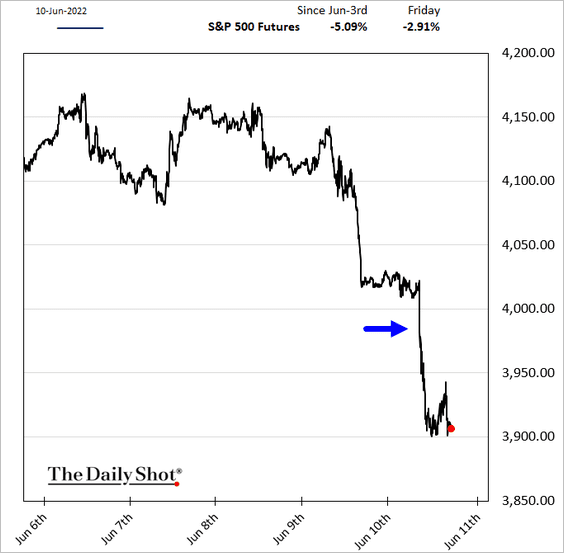
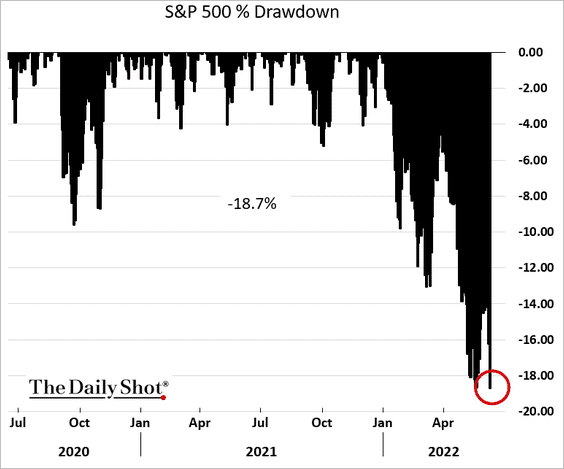
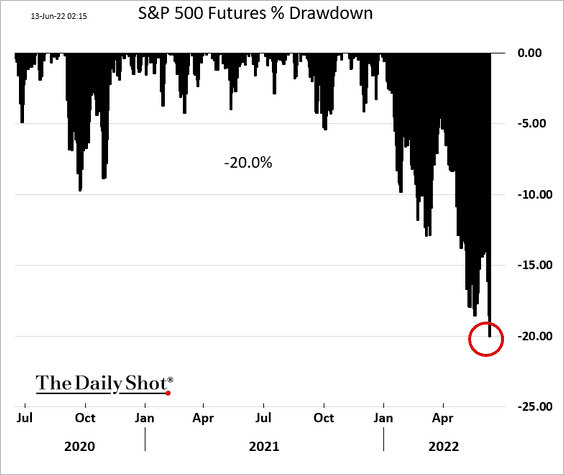
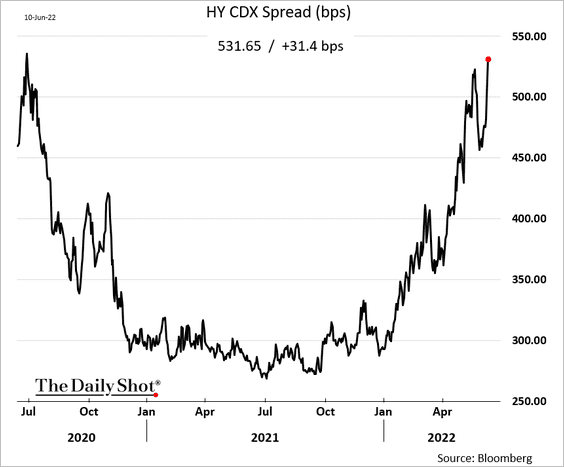
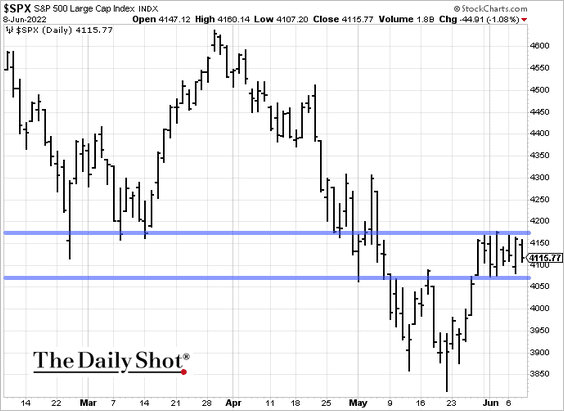
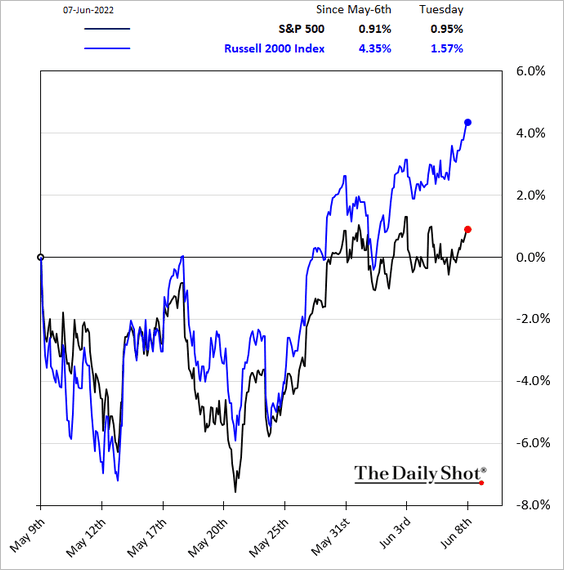
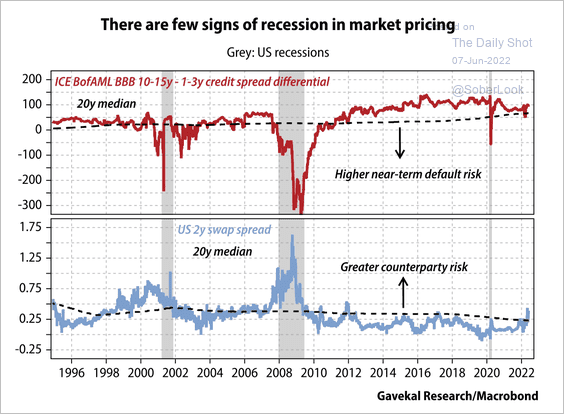
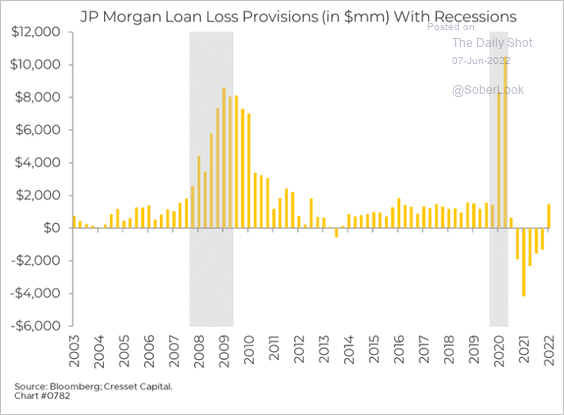
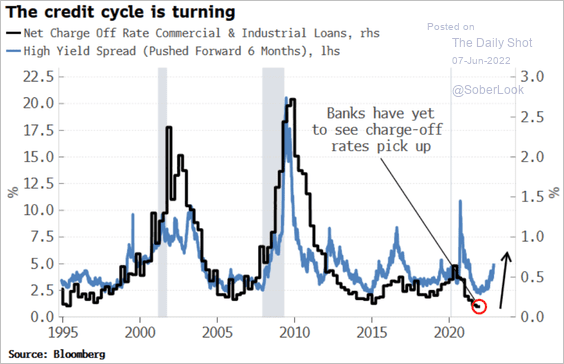
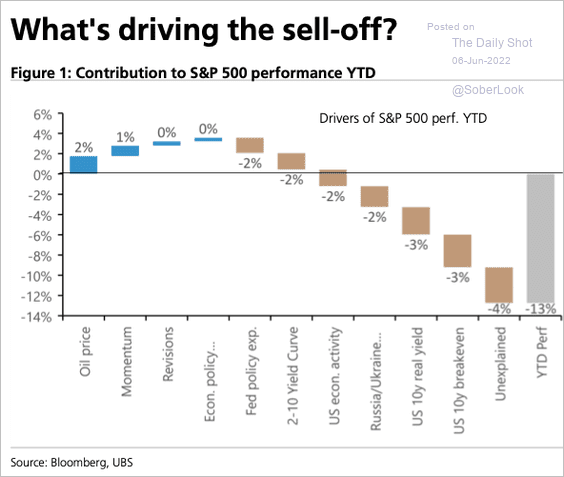
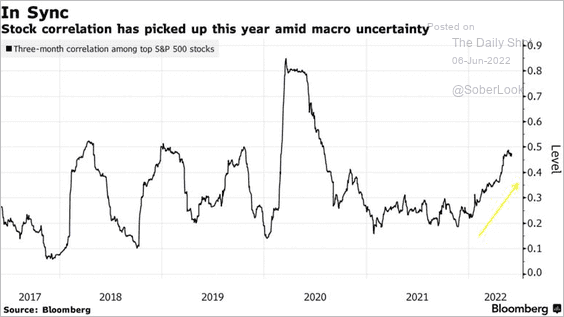
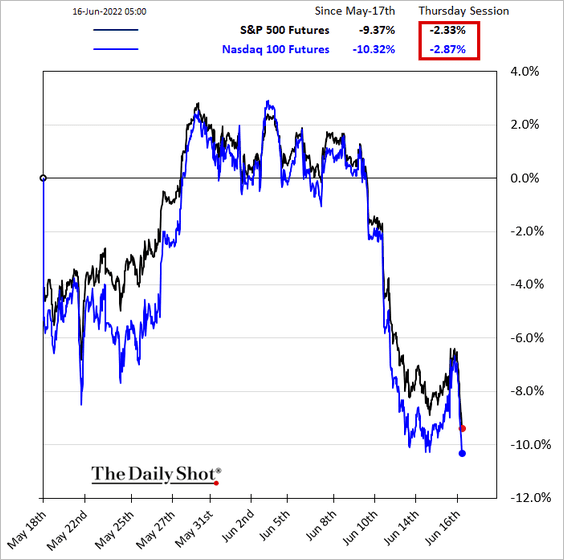
1. After a “relief” bounce on Wednesday, the stock market rout has resumed. It’s hard to see a catalyst to stabilize the market at this point.
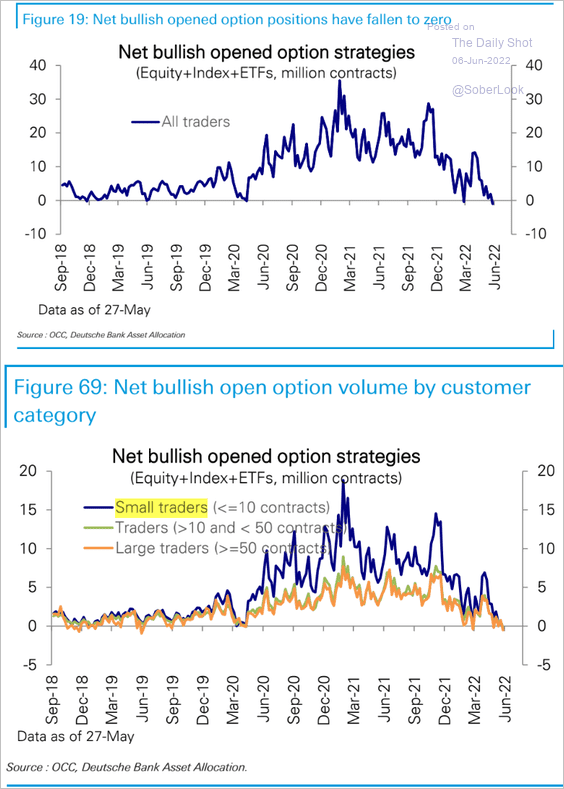
2. Selling pressure on Monday was historically severe, …
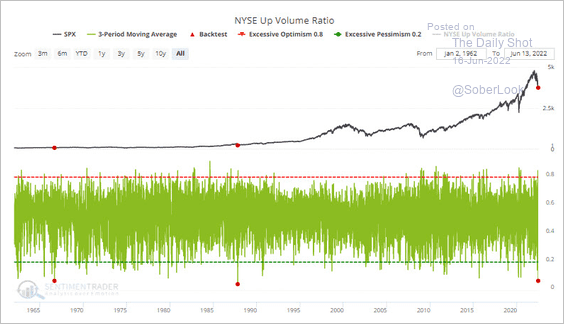 Source: SentimenTrader
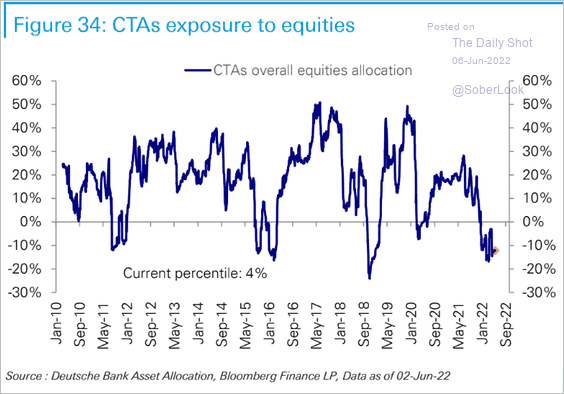
… exacerbated by hedge fund selling.
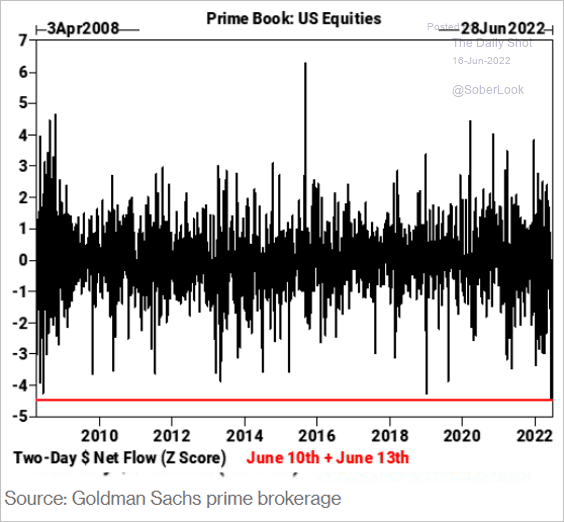 Source: @jessefelder; Goldman Sachs; @luwangnyc, @MelKarsh Read full article
——————–
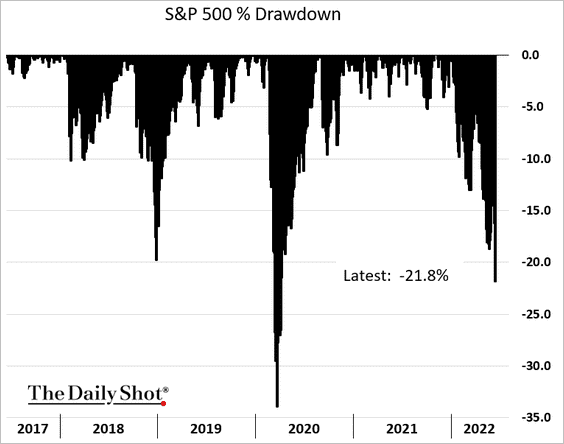
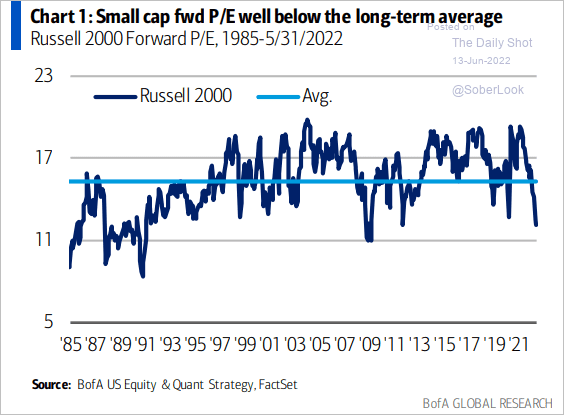
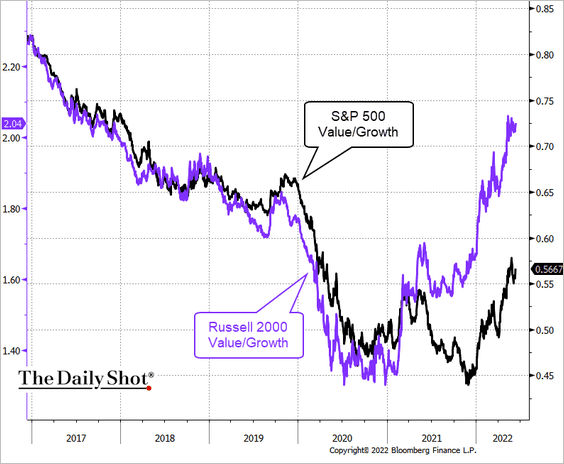
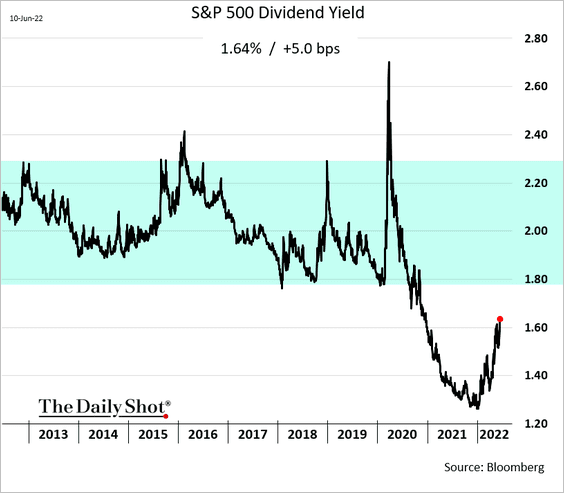
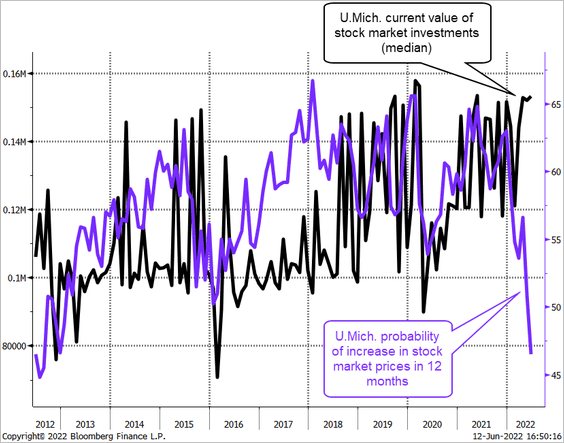
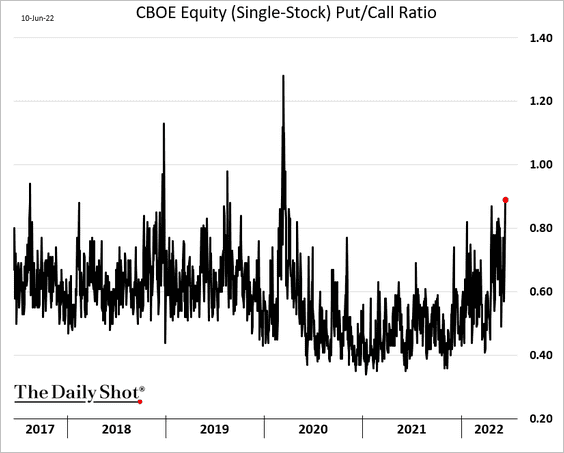
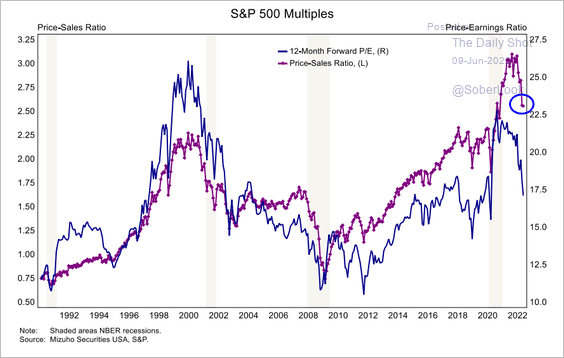
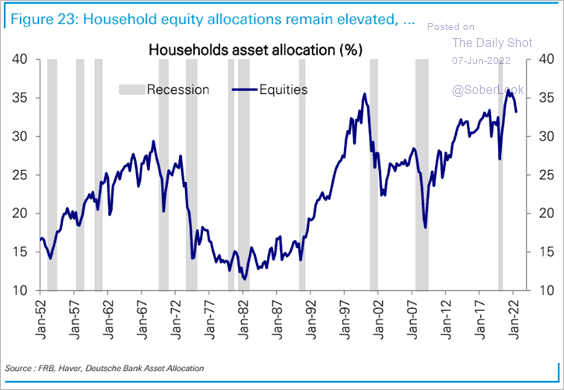
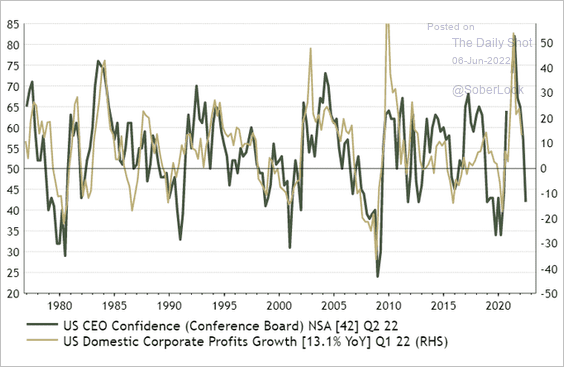
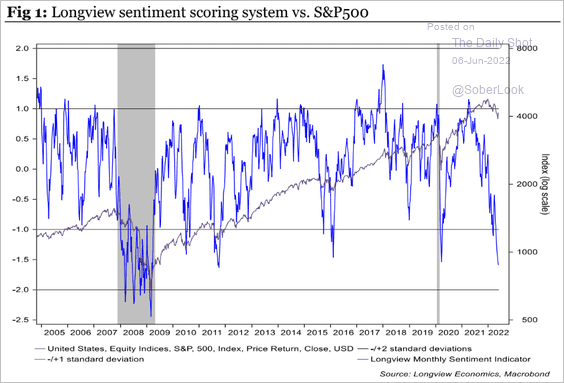
3. Investor sentiment remains near multi-year lows.

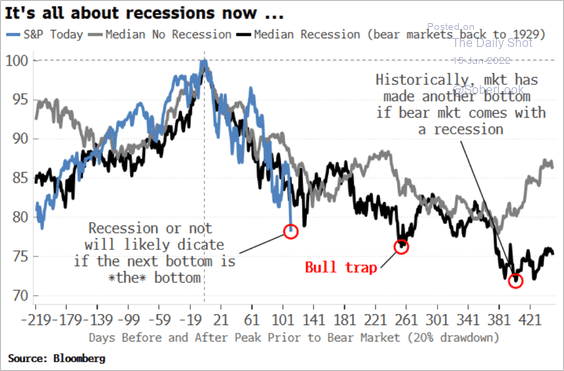
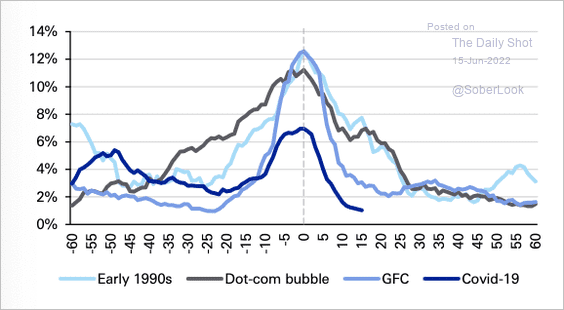
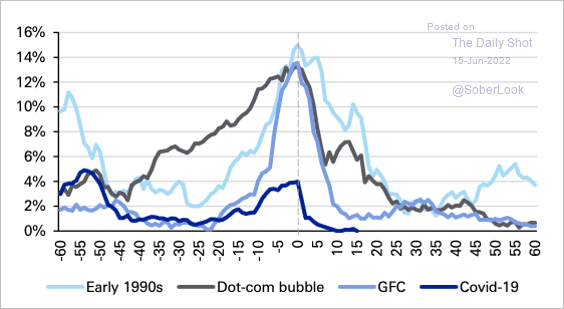
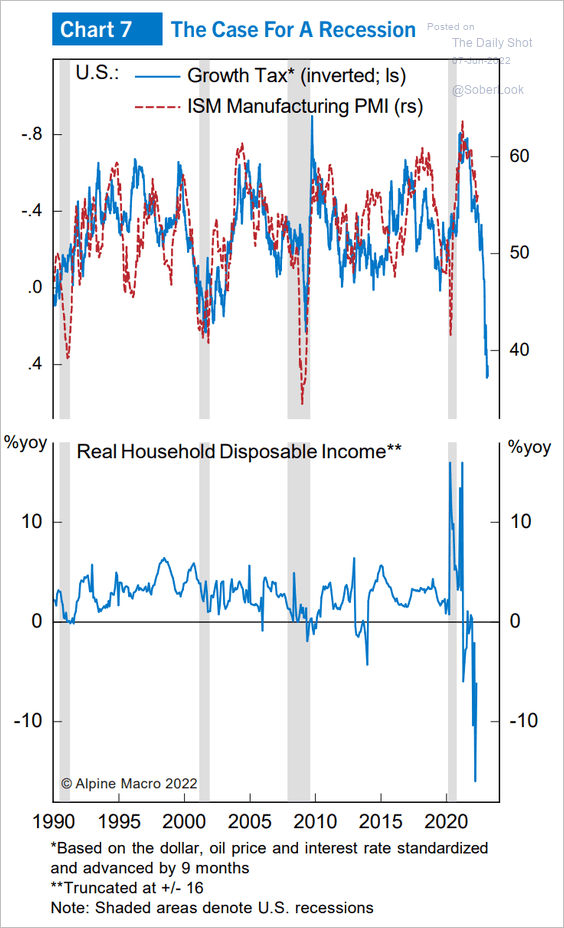
4. The median S&P 500 drawdown in a recession is 24%.
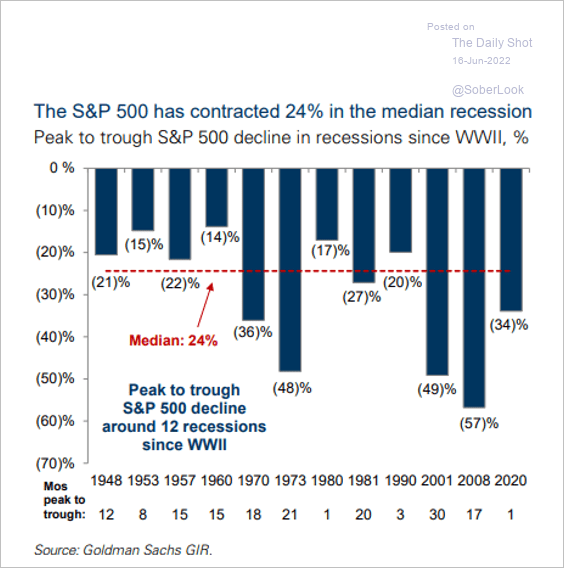 Source: Goldman Sachs
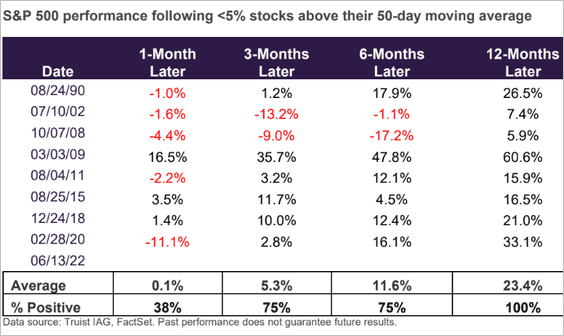
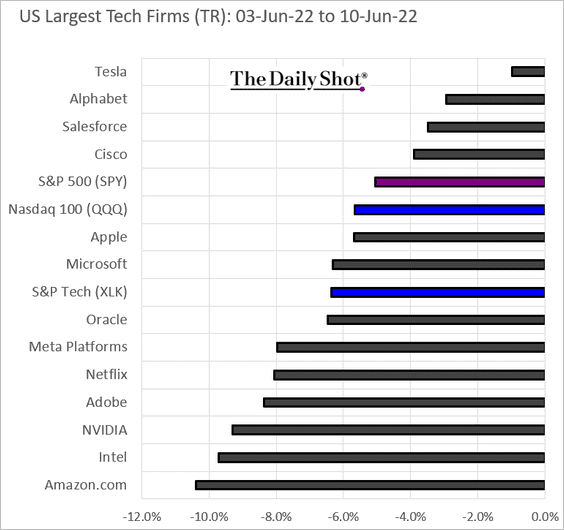
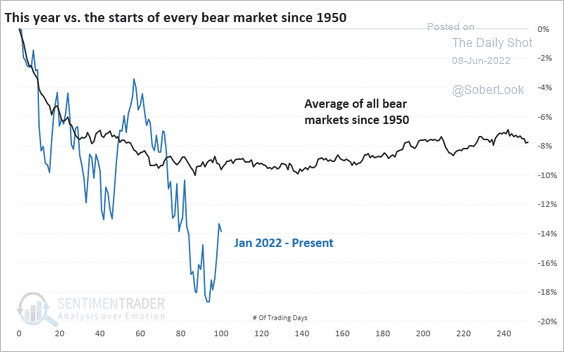
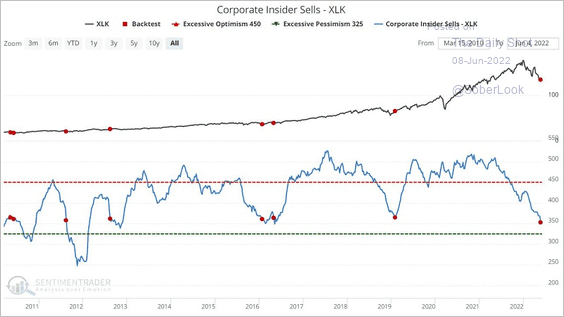
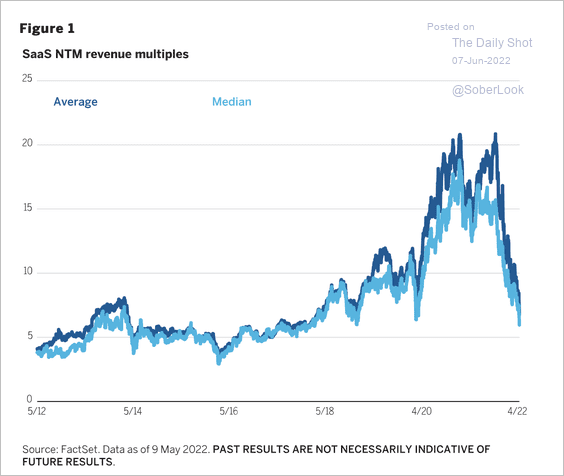
5. Almost all tech stocks are in a bear market, which typically precedes a period of positive returns, according to SentimenTrader.
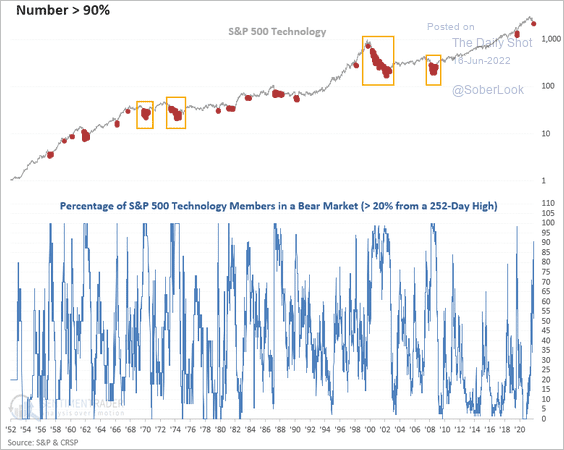 Source: SentimenTrader
6. The VIX (implied vol) term structure has been relatively flat in the latest selloff.
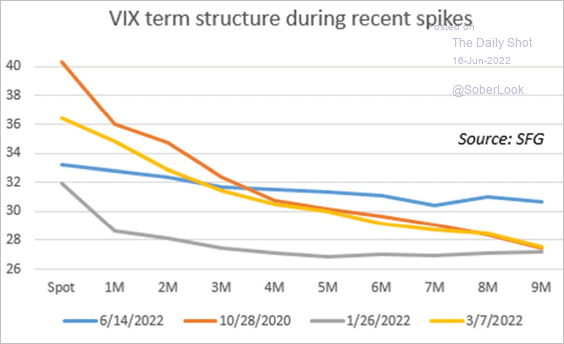 Source: Chris Murphy, Susquehanna International Group
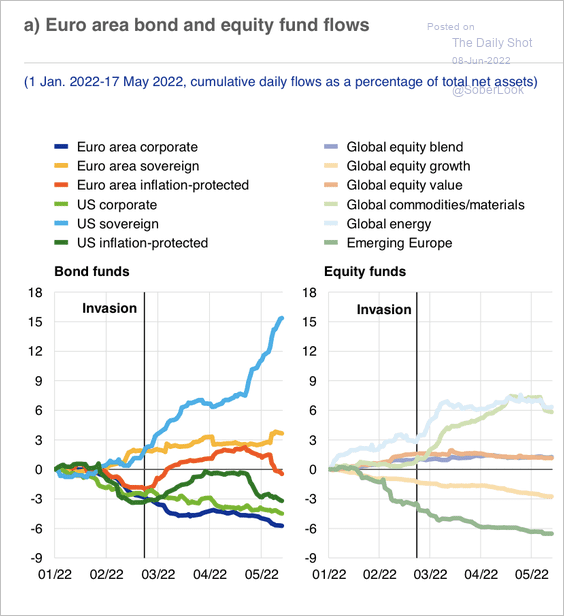
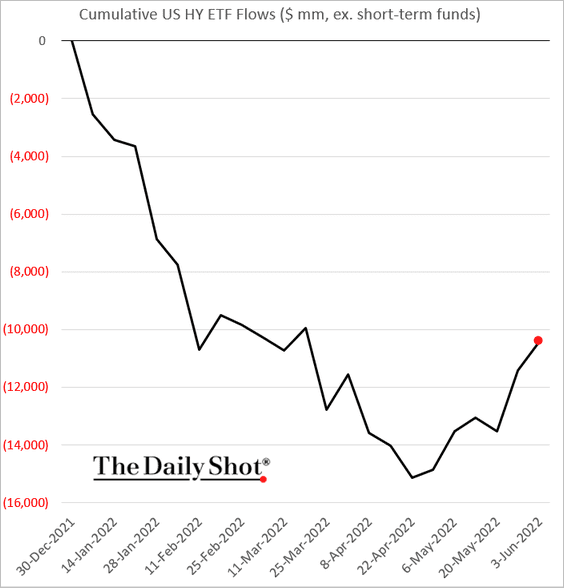
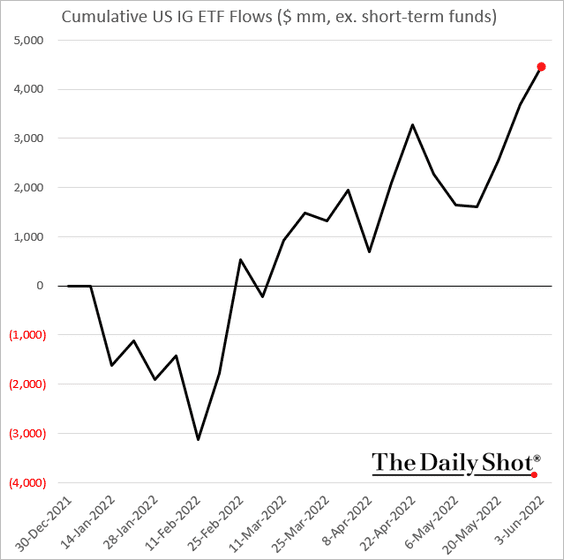
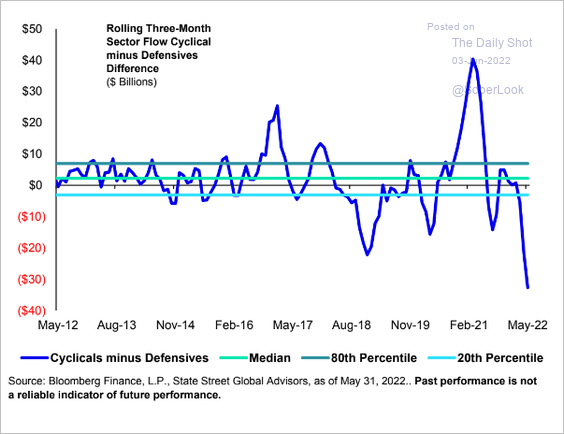
7. Next, we have equity fund flows by region.
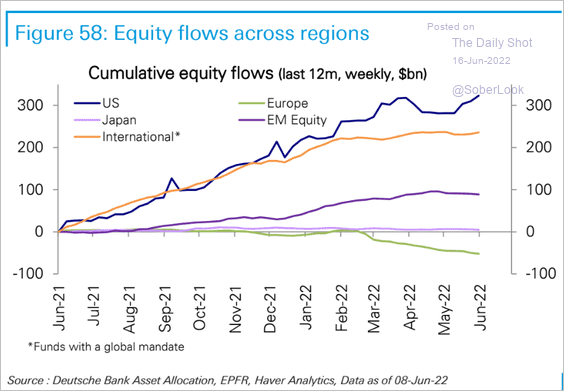 Source: Deutsche Bank Research
Back to Index
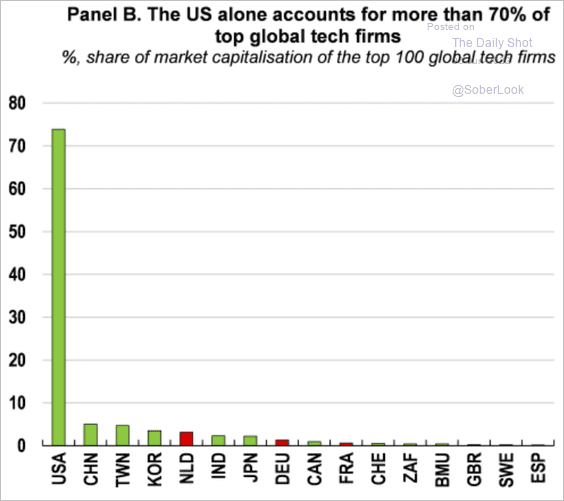
Global Developments
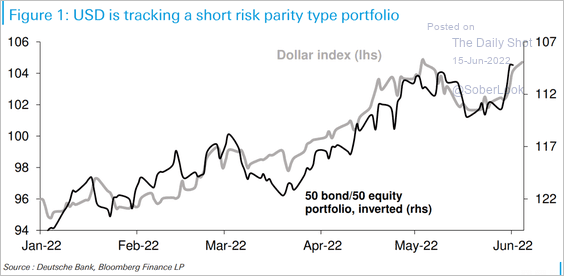
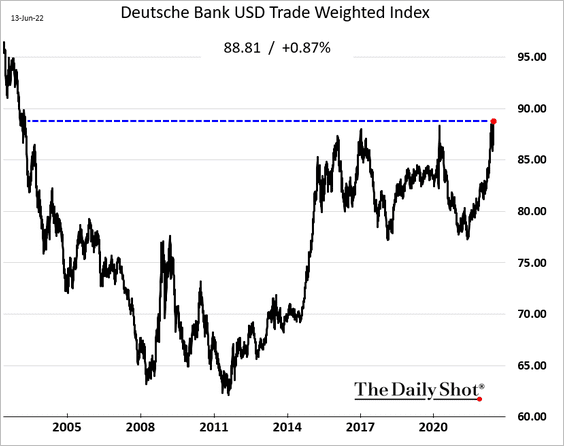
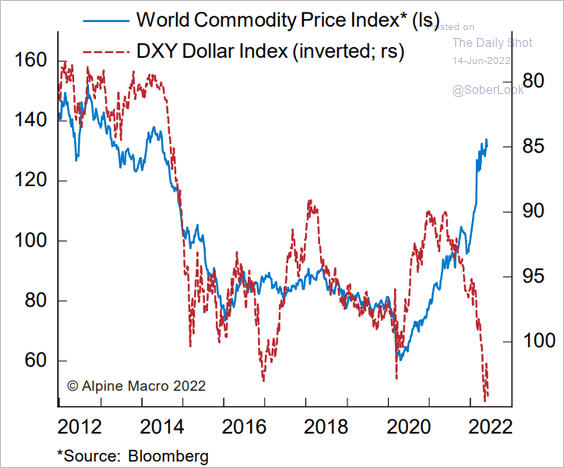
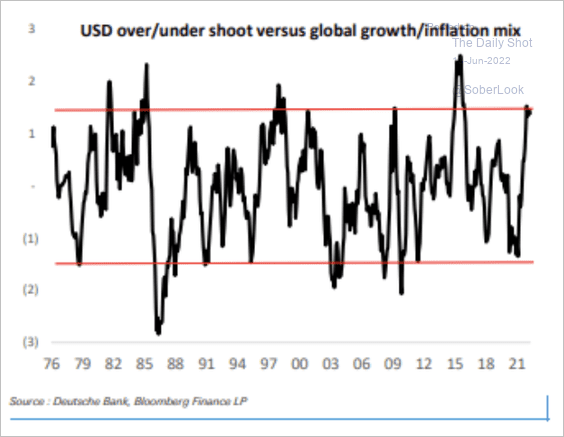
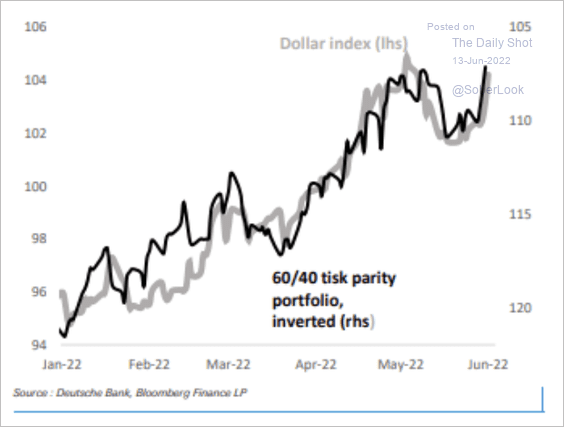
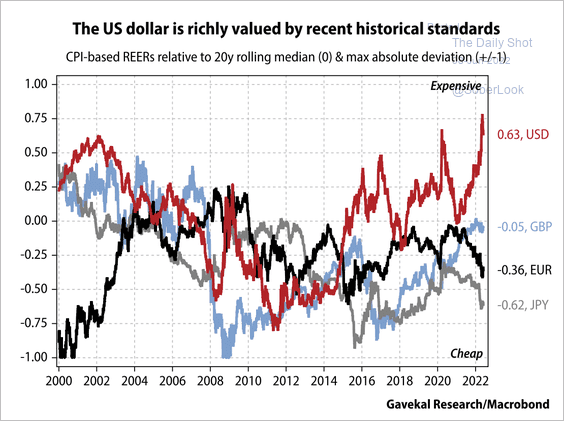
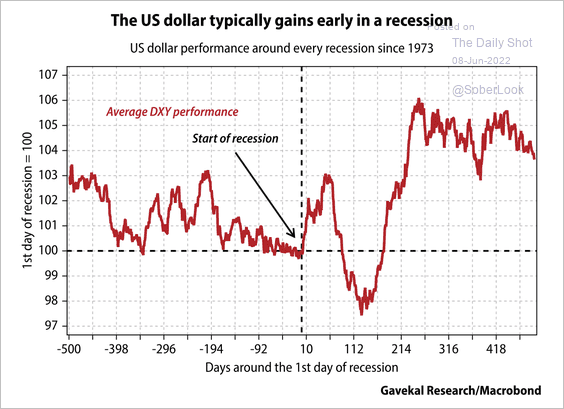
1. Will we see a pullback in the dollar?
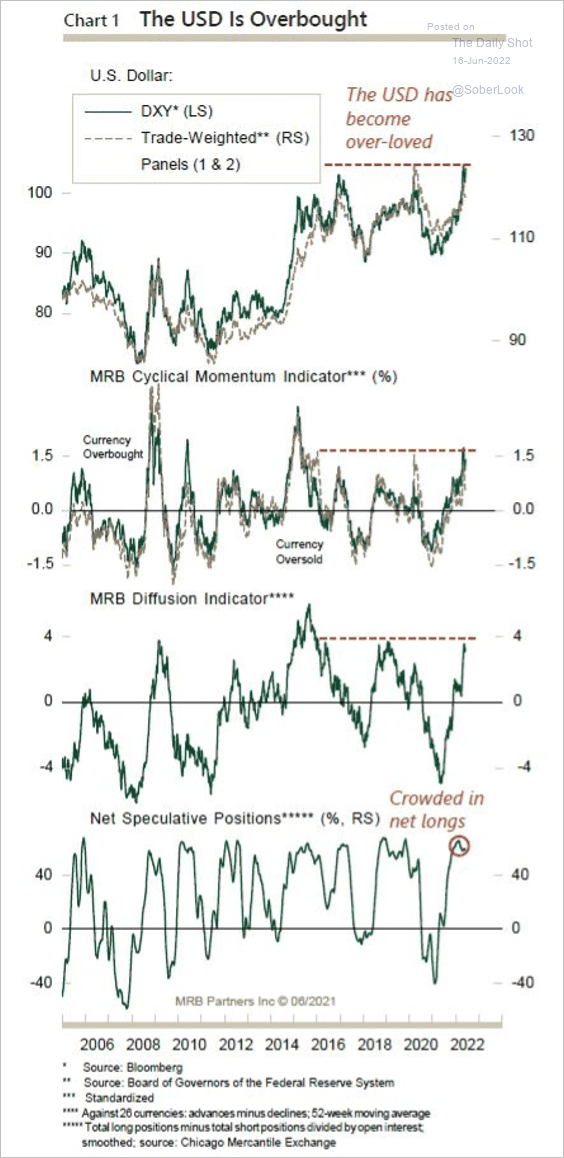 Source: MRB Partners
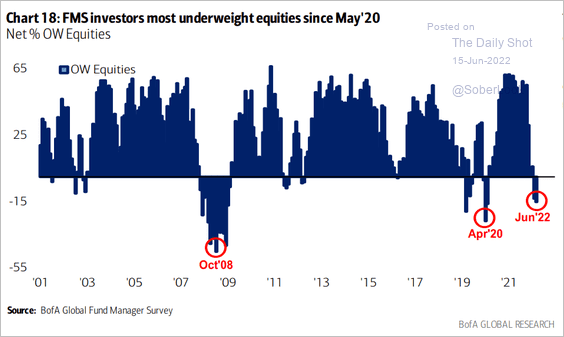
2. Fund managers are increasingly gloomy about global growth.
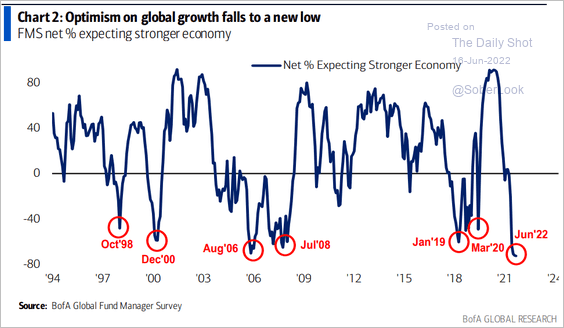 Source: BofA Global Research
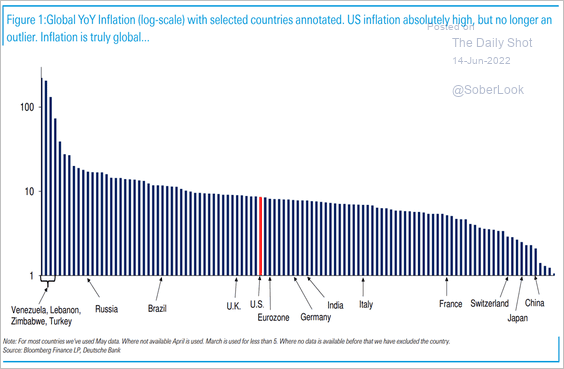
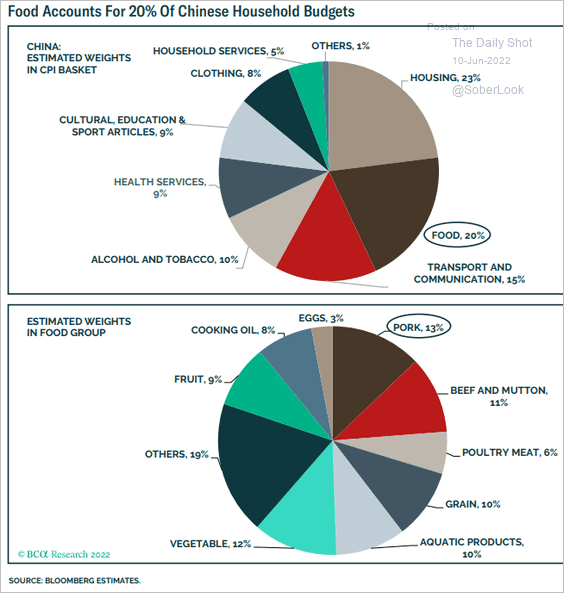
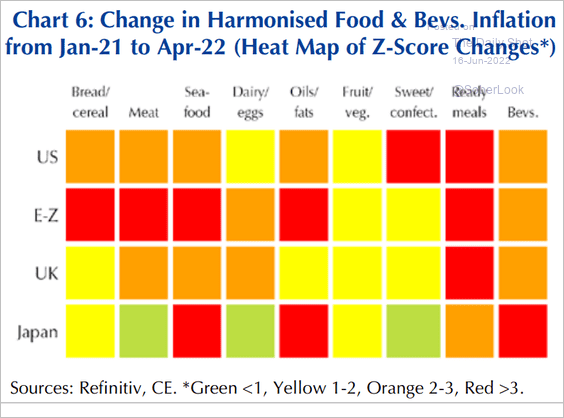
3. Here is a heat map of food inflation in select economies.
 Source: Capital Economics
——————–
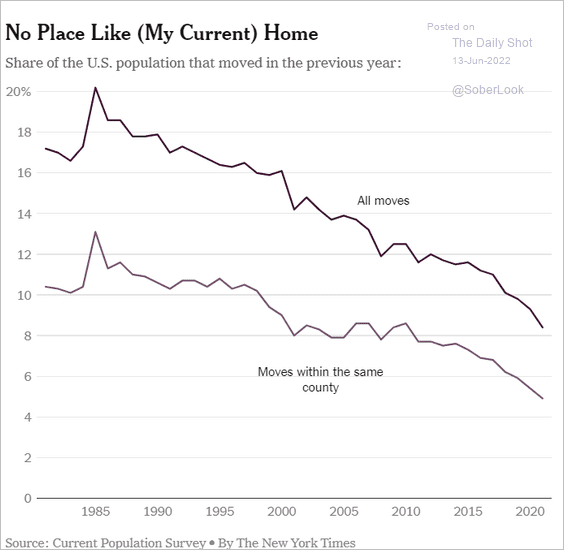
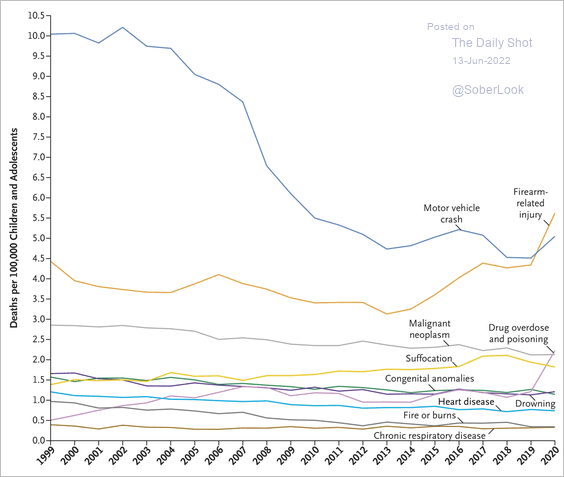
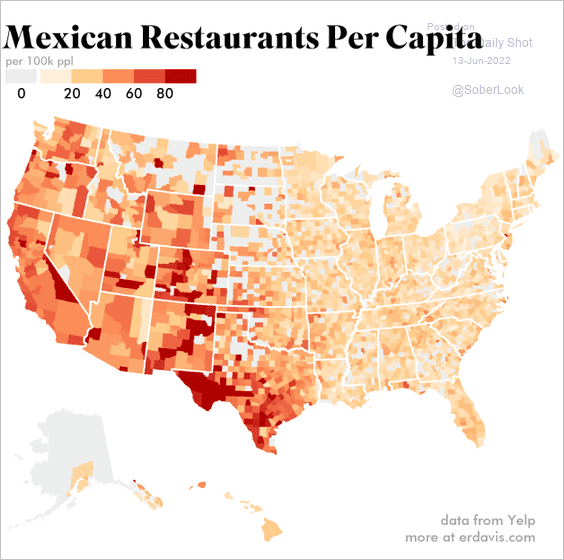
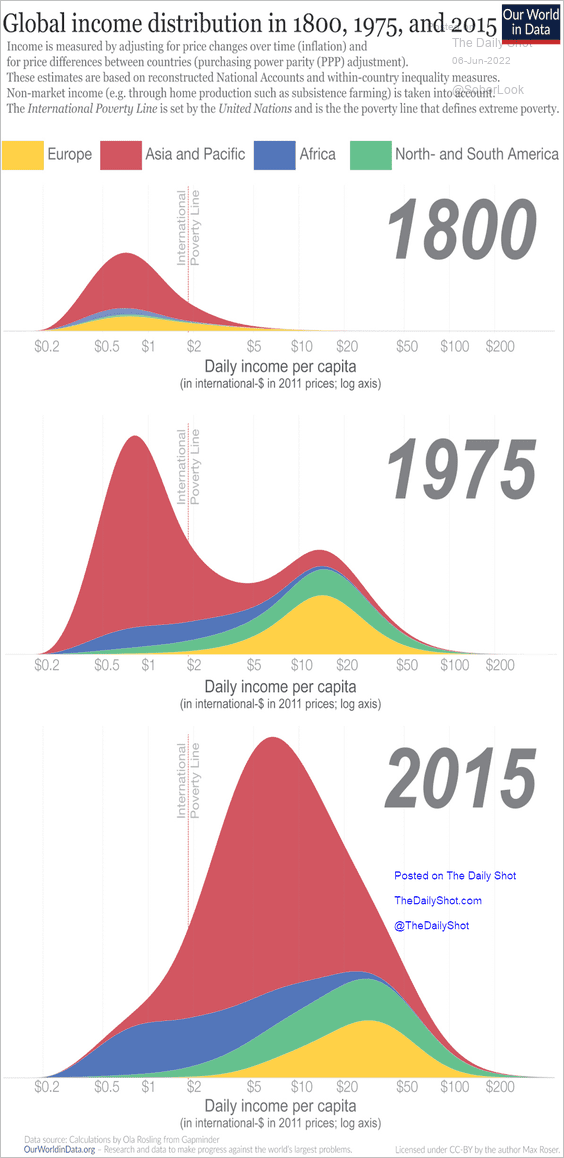
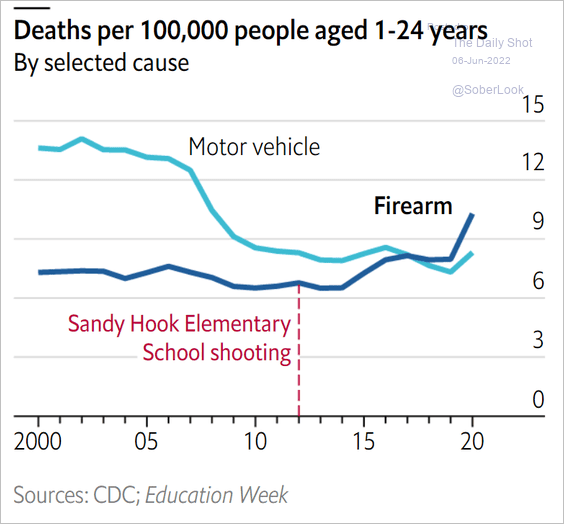
Food for Thought
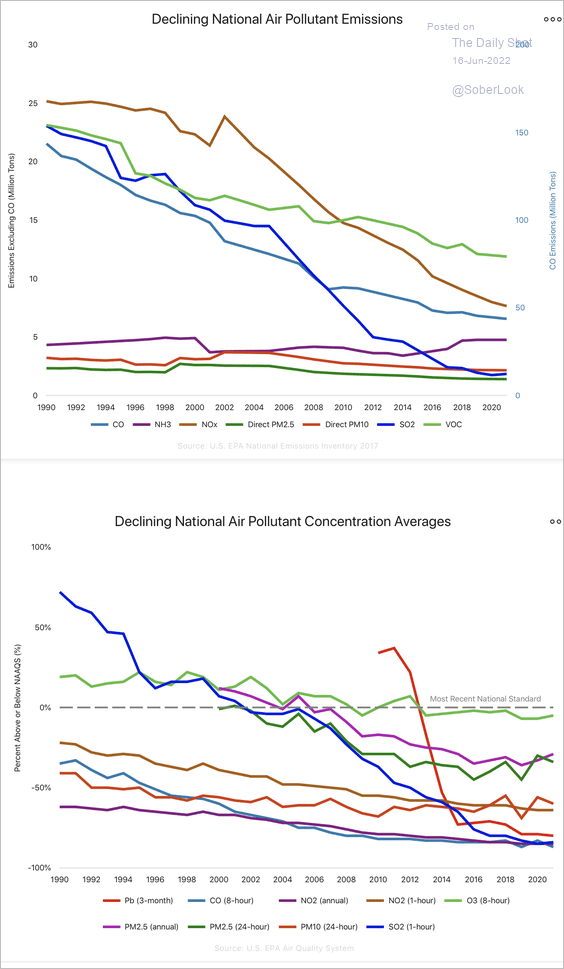
1. Improvements in US air quality:
 Source: EPA Read full article
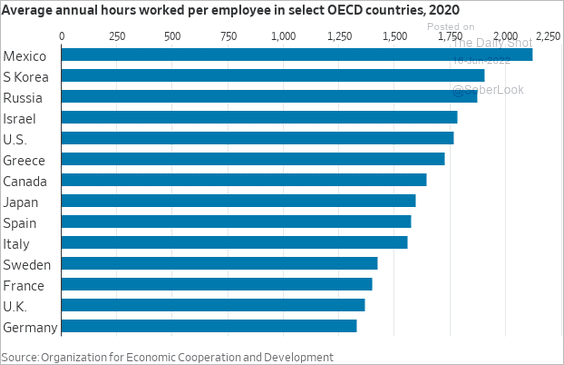
2. Annual hours worked, by country:
 Source: @WSJ Read full article
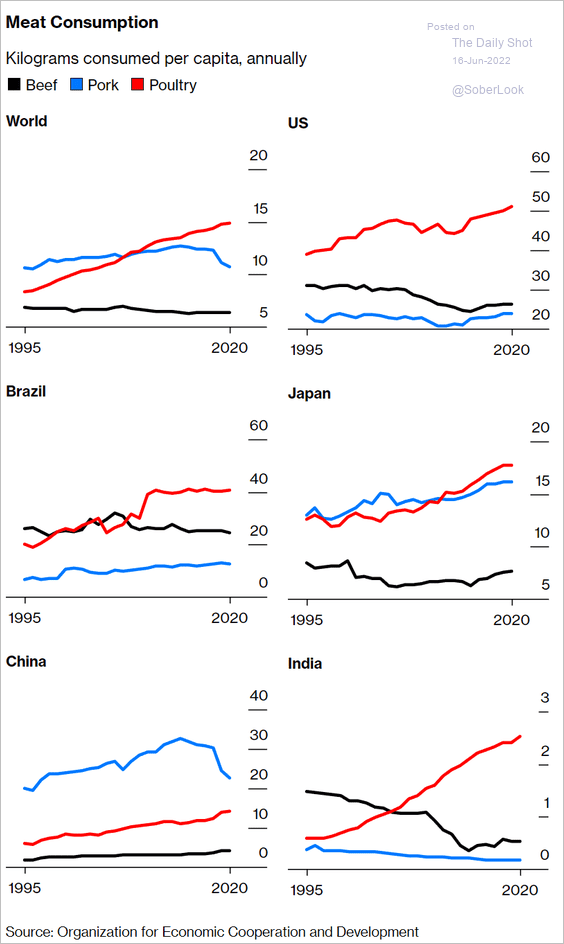
3. Global meat consumption:
 Source: Bloomberg Read full article
4. Change in US household net worth, by wealth level:
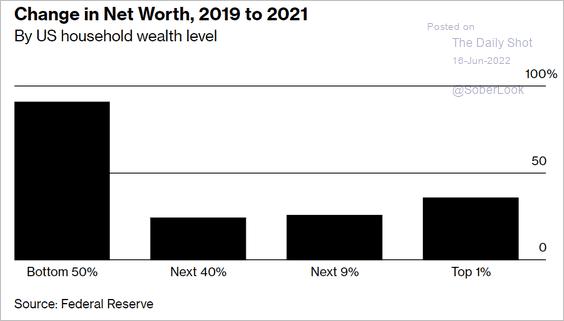 Source: Bloomberg Read full article
5. Projections vs. actual births in the US:
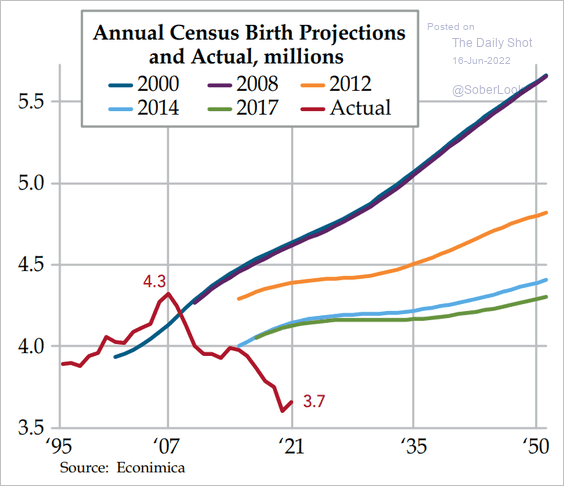 Source: Quill Intelligence
6. Distribution of species across different environments:
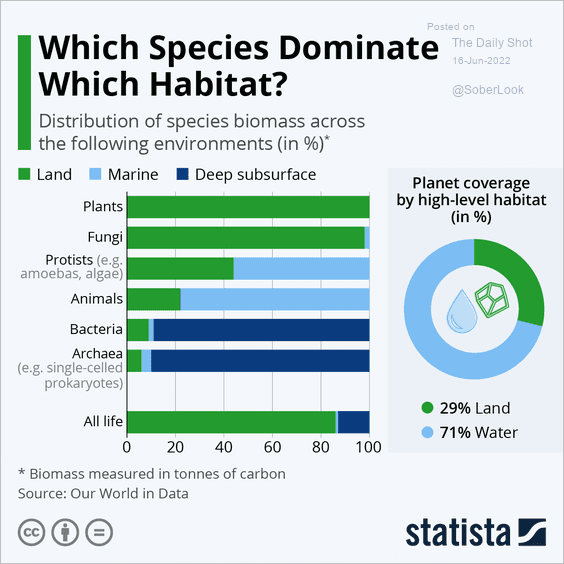 Source: Statista
——————–
Back to Index